U.S. stock prices as measured by the S&P500 fell almost 7% last week. What’s going on?
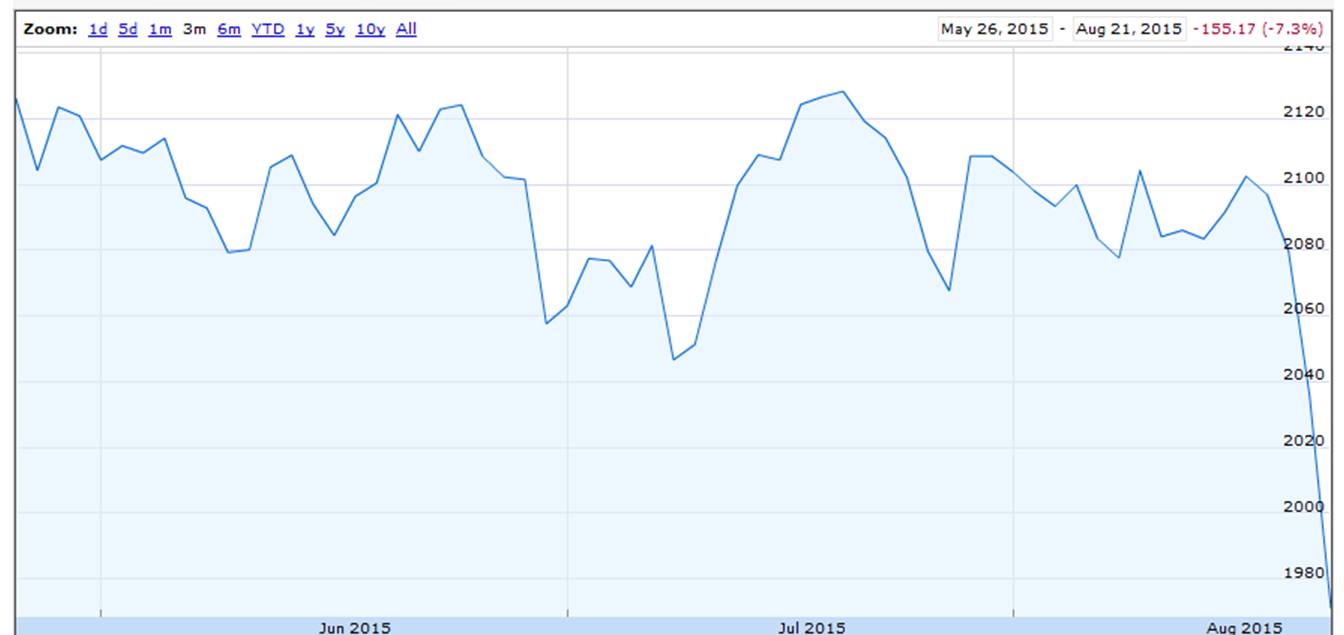
Value of S&P500 index over last 3 months. Source: Google Finance.
That’s quite a dramatic move for one week, though it’s useful to keep it in perspective. The decline barely takes a nibble out of the doubling in U.S. equity evaluations over the last 5 years.
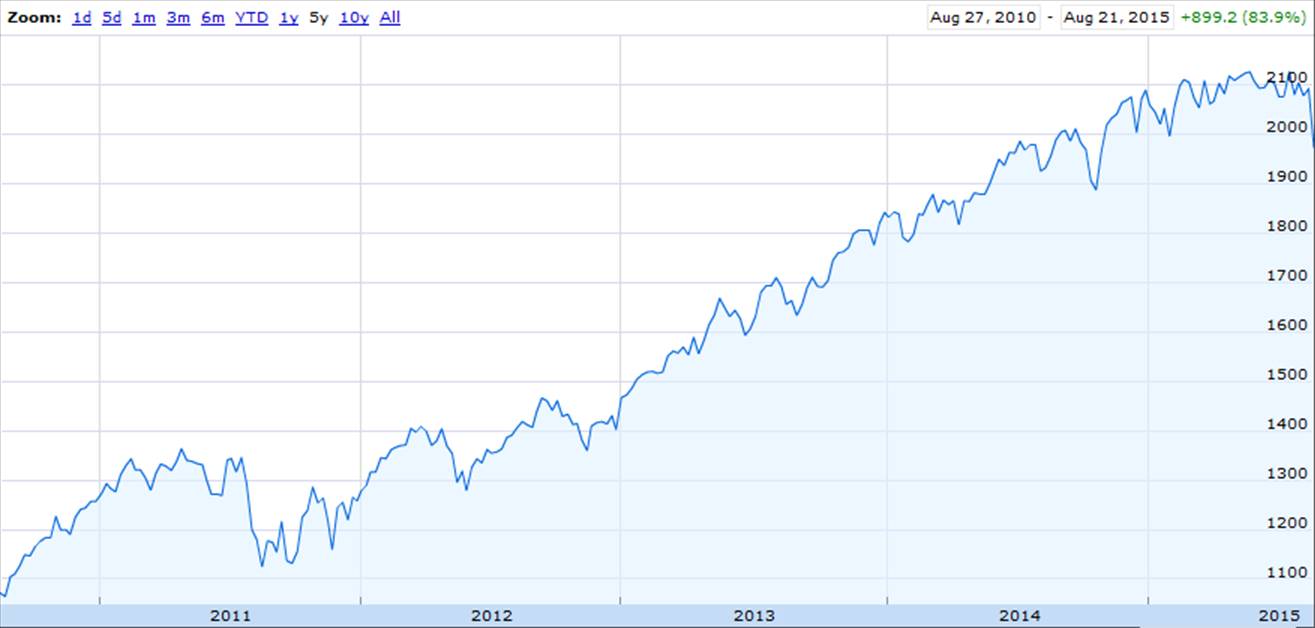
Value of S&P500 index over last 5 years. Source: Google Finance.
Center stage seems to be China’s stock market, where equities have lost about a third of their value since June 12. Though even after that loss, Chinese stocks are still up 57% from a year ago.
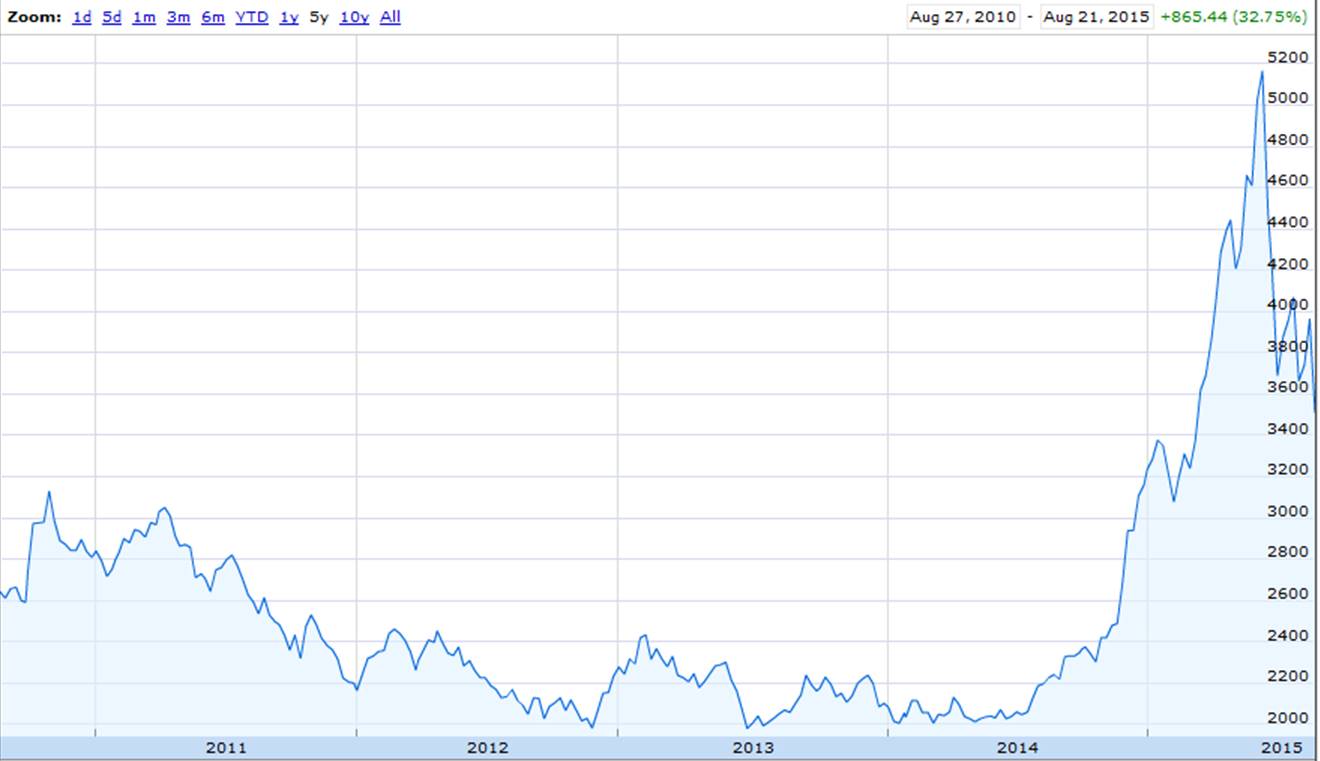
Value of SSE Composite Index of all shares traded on the Shanghai Stock Exchange over the last 5 years. Source: Google Finance.
If you believed that China had been experiencing a bubble that’s now in the process of popping, you might have expected to see a graph just like that one.
China’s economic growth has certainly slowed, and some of the recent indicators raise concerns. China’s Manufacturing Purchasing Managers’ Index fell to 47.1 in August. A value below 50 means that more establishments are reporting a drop in indicators like orders, output, and employment than are reporting increases. A value below 47 hasn’t been seen since the Great Recession, though it’s often come close to its current value without necessarily signaling anything.
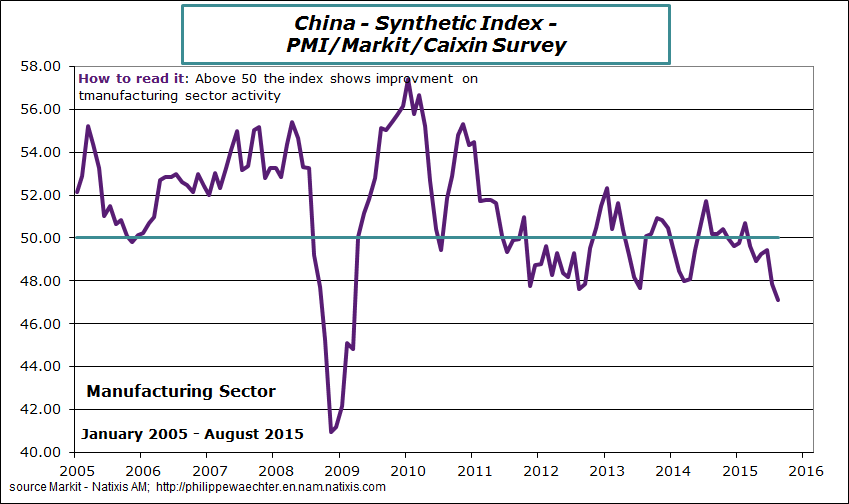
Value of China manufacturing PMI. Source: Philippe Waechter.
Rail shipments are also down, and the rate of growth of electricity production has slowed.
China railway freight traffic. Source:
Dr. Ed’s blog.
Annual growth rate of Chinese electricity production. Source: Dr. Ed’s blog.
Chinese leaders’ worries about a slowing economy likely figured prominently in China’s decision to devalue the yuan on August 10. If China’s economy is slowing significantly, it has huge implications for markets around the world. Concerns about a Chinese downturn were likely key not just in the recent U.S. stock market decline but for a host of other indicators as well. The yield on 10-year U.S. Treasuries has fallen 20 basis points since August 10, and West Texas Intermediate has dropped $4.50/barrel.
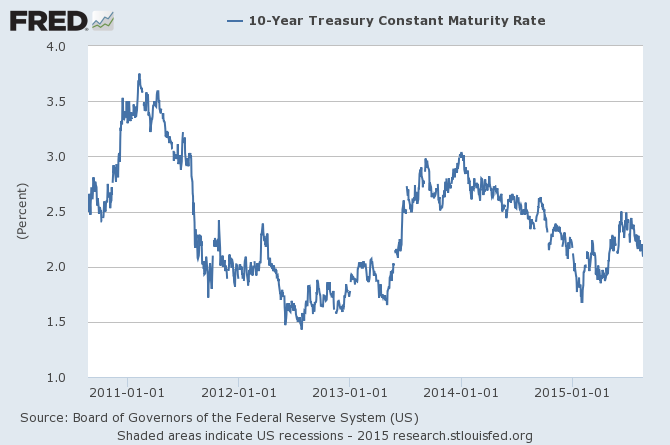
Source: FRED.
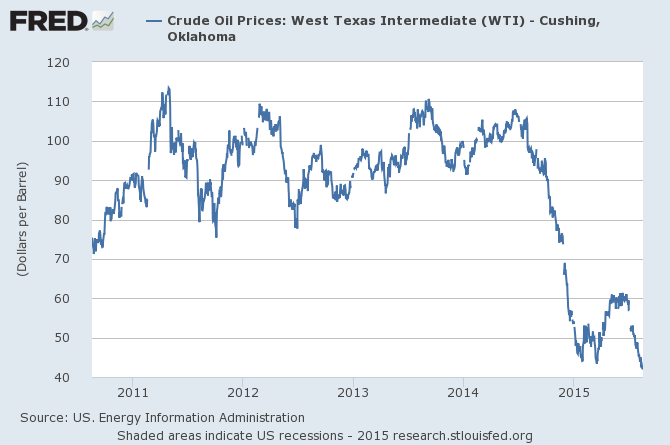
Source: FRED.
China’s changing demographics have to mean a slower economic growth rate. Coming off an apparent bubble in real estate and stock markets is clearly going to make it a challenge to manage a smooth landing.
the contango has been tightening last few days for WTI. IOW DEC16, 17, 19, etc. contracts have dropped more than the front month. Would think that a China recesson (or slowcession, whatever it means to drop from 8% growth to 4%) would affect front month more than further out (after all if it is an economic cycle…plus the indicator is now, not 4 years later).
While China demand obviously affects the whole futures strip, it seems like the tightening contango is more a reflection of long term supply worries (LTO dropping slower and more reluctantly*, OPEC far from cohesion or action on cuts, no action from Russia/Norway to coordinate (even less discussion than in 1986), Iran/q ramping up.).
*It’s not just pure cornucopian fantasy. Look how LTO has blown away skeptics over the last few years–many who said it would not compete even at $100+. And look at the natgas market and how that has changed versus mid 2000s.
The 12 month spread on Brent is $7, not exactly tight.
But what we’ve seen in the last six weeks is the disintegration of the back end of the curve, ie, confidence in marginal cost has collapsed. This has to do with the resilience of US shale production and as much fear of an explicit downturn in China. I calculated EOG’s breakeven for Q2, and it’s $76 / barrel whether we count it by net income or by cash flow. That’s $36 / barrel above current prices. Chevron’s at $85, Hess looked like $62-67. So if ask me whether marginal cost is dictating the oil price, well, not that I can tell.
But if not that, then what? Well, with collapsing confidence, the one number investors do have is the spot price. I call this the Finish Line Effect. If you think you see the finish line, you’ll keep your speed up, and maybe even sprint. If, however, those hopes are dashed, then at some point you’ll slow down to a sustainable pace and forget about the Finish Line. In such a case, the front of the curve will tend to dictate the price. And that’s what I think we are seeing.
The alternative view is simply a fear of China. If that were the case, we would expect to see a significant bump in the futures curve around 2017 when a presumed recession in China would end. No such feature in the curve, though.
Probably lower than that for EOG. See here:
http://seekingalpha.com/article/3421446-continental-resources-cash-flow-positive-in-2016-at-60-oil
Remember all the people saying shale wasn’t break even at $100, last summer (when their capex was funding 30% growth). Confusing investments for future returns with immediate profits.
Not for Q2 for EOG. I will publish on this.
http://www.marketwatch.com/investing/future/clz9/charts?symb=CLZ9&countrycode=US&time=4&startdate=1%2F4%2F1999&enddate=8%2F23%2F2015&freq=1&compidx=none&compind=none&comptemptext=Enter+Symbol%28s%29&comp=none&uf=7168&ma=1&maval=50&lf=1&lf2=4&lf3=0&type=2&size=2&style=1013
Note how the CLZ9 contract has dropped the last few days (MORE than the $5 drop in front month WTI). This is actually unusual. Normally further out strip tends to be much more stable than the near month.
This is the “longer aspect” of the “lower for longer” that gets talked about in the news. Of course, the market can always be wrong! But what the betting money is telling us is that people see (slightly) increased view in systemic low prices (at least relatively low versus 2011-14 100+ days.)
Right now, I believe investors are fearing the worst. It’s going to be very tough in oil markets if China goes down 1998-style.
I’m not sure I put too much importance on equities prices in China, but automobile manufacturing is potentially relevant. This, from the WSJ this evening:
“China passenger-vehicle sales fell for a second consecutive month in July, registering a 6.6% year-to-year decline. Sales of foreign branded cars fell 1.5% in the first half from a year earlier, compared with a 4.8% year-to-year rise in the overall Chinese car market—a disappointing growth figure compared with booming double-digit percentage growth in prior years.”
That shouldn’t happen with low oil prices.
http://www.wsj.com/articles/foreign-car-factories-curb-output-in-china-1440358381
This downturn may be cyclical, but I suspect it’s more structural, and has to do with the tone since Xi came to power. He has been more nationalistic and confrontational–not China’s comparative advantage. These chickens may be coming home to roost, as I describe here in my piece from last week.
http://www.prienga.com/blog/2015/8/13/oil-and-chinas-devaluation-an-alternative-view
Thanks for this piece, very helpful.
If you’re so inclined, you might sketch out how a meltdown in China might look.
Steve Kopits,
Read your linked article. This is the most cogent analysis of the situation in China that I’ve read. Thank you for posting.
Well, thanks. But I’ve been wrong a lot lately, so take it for what it’s worth.
You can be nationalist and confrontational. It worked for Hitler. But you need a well developed laboring and middle classes. This China does not have.
It most emphatically did not work for Hitler, or Tojo, either. It led to a world war and the decimation of those two countries.
Oil just traded down into the 39s again and Brent broke 45 (first time since 2009), record for the year.
I wonder if our discussions here are moving the market. Getting them thinking about microeconomics instead of triple tops and candlesticks and other technical trading silliness. 😉
Come on market…just look at natural gas…look at 1986. Think about it…be afraid! 😉
EA and MS had fundamentals reports out this morning. Both indicate strong fundamentals, lots of demand popping up everywhere and the oil supply slowing turning over.
Not that the market cared.
It’s not 1986 on the supply side. (It is on the demand side.) In ’86, OPEC had 13 mbpd of spare capacity, which took a generation (“the Great Moderation”) to consume. I could make a pretty good argument that spare capacity today is effectively zero.
We have about 200 mb excess inventory of crude and related products globally; and about 260 mb (let me agree with PIRA here) in total excess including NGLs and other stuff. That’s our cushion, and it’s not too bad. But there are no meaningful production reserves out there, best I can tell.
Oil prices are half of marginal cost. And US production is falling at the pace of 40 kbpd / week, representing a fall of 1 mbpd to year end 2015. This is consistent with guidance from the US independents for the period. We don’t have too much insight into international production. It too will roll over in quantity at some point.
The fundamentals are pretty bullish, not that the market cares.
Right now, the market thinks China is going down. And it might be right.
China could go down and it still wouldn’t matter. They would not go down enough. The market does not like change. Transferring from energy to consumer staples takes time and effort.
Professor Hamilton,
As you have shown us in the past, should we be looking at the logs of some of the above series?
China is an export economy. That means that they are taking orders and filling them. It has not been a secret that China has used its low labor costs to take assembly jobs from the developed world. That would seem to tell us that the consumption of the world has declined reducing China’s orders, and/or labor costs have increased so China has lost some of its competitive advantage.
I appreciate Steven Kopits insight that Xi has changed the tone but I would go farther. Xi has changed the economic fundamentals. China did not see massive growth by increasing liquidity. As a matter of fact China’s RMB was essentially fixed to the dollar during it strongest growth period. But China ended the link with the dollar even devaluing their currency, now we are hearing about China attempting to stimulate exports through QE and attempting to prop up the Chinese stock market through a “plunge protection” style intervention. Robert Mundell is kicking back in Italy and his phone is not ringing.
Bottom line is China is moving away from economic liberalization toward a demand theory, command economy. Rather than allowing the market to signal where problems are the allowing a market solution, the Chinese are attempting to whitewash the numbers. They want to keep the growth illusion going, while letting real growth slip away.
Steve Forbes does a good job of detailing the demand theory mistakes China has made recently. I do part ways with his conclusion that Chinese leadership will have to return to economic liberalism. China has a heritage of command government. If Xi looks to the current economic policies of the west for his solutions – something he appears to be doing – China could easily become the Japan of the 2000s.
Statements like “China’s economic growth has certainly slowed” (akin to others in the Western media like “Russia invaded Ukraine/shot down a passenger plane”) they are allegations only. The ‘proof’ offered are a few data points and those offering them clearly have no idea of the unique dynamics of the Chinese economy. Our Western cluelessness is willful: The Economist has predicted 56 crashes for China’s economy in the past 34 years; The Telegraph’s Ambrose Evans Pritchard? Only 12. Always wrong, never in doubt, it seems. Let’s see the annual results before we break out the champagne.
And whoppers like “China’s changing demographics have to mean a slower economic growth rate” are just plain ludicrous. China’s rising productivity more than offset its supposed demographic deficit, as they should.
From what I have read, China’s productivity is rising, but not rising at the rate it has during, say, the period 1990-2010. See, for example, here:
https://www.accenture.com/us-en/insight-outlook-beyond-capital-and-labor-China-productivity-frontier.aspx
and, here
http://blogs.wsj.com/economics/2014/09/01/chinas-productivity-problem-drags-on-growth/
The rate of productivity growth seems to be slowing. Do you have any evidence to the contrary? And, that it is slowing makes sense. When China started from the bottom, early productivity gains were pretty easy and rapid. Now that they’ve achieved a much higher level of productivity, further gains will be more difficult. If you want to accuse people of making “whoppers”, particularly based on “lack of proof”, I think that you should set the example by further substantiating your own claim. So, lay out your case in detail and your “proof” as to why Chinese growth is not slowing and/or is not going to slow (further) productivity gains will outweigh demographic developments.
Vivian Always like your comments. Here is more support for the view you hold.
In a barren mathematical sense, productivity is straightforwardly the product of new know-how, new technology, capital deepening, etc. There is, however, a more sentient sense in which it is useful to think about productivity. Though harder to measure, this other sense is equally valid and sheds additional light. Were the spirit of a nation to become clouded for whatever reason, all the traditional measurable elements of productivity could remain unchanged. Yet arguably output per manhour would fall and productivity growth would slow.
When the second derivative of the level of credit goes negative – as evidently it has in China since around 2013 – something similar happens. With a lag, nominal and real growth will slow too. Though there is always flexibility in the system regarding labor force growth and hours worked, the deceleration of credit growth will most assuredly fall through to slowing productivity growth. In my judgment, what is happening to credit in China today is the prime mover of what is happening to China’s productivity. (Of course, the current transition phase away from an export-driven strategy is an important factor, too.)
China was the global locomotive this recovery since it had a degree of freedom to do so. That degree of freedom was its low level of debt in 2008. That freedom is gone. For this reason, trend growth going forward will be much lower than generally believed. You might say credit ought to be another term in the production function. A rich multipurpose lubricant of sorts, that greases the wheels of supply by aiding the entrepreneur, and demand in obvious ways.
Ever so rapidly in an historic sense, debt has risen to the top of the list of impediments that will restrain global growth for decades unless something is done about it. The likelihood of something being done rests on political will, a commodity as rare as a rare earth element pretty much everywhere around the globe.
“Were the spirit of a nation to become clouded for whatever reason, all the traditional measurable elements of productivity could remain unchanged. Yet arguably output per manhour would fall and productivity growth would slow.”
this is a great sound bite. however, could you please provide more concrete evidence in how this fall in output per manhour and slowed productivity growth would actually play out if the traditional measurables are unchanged? its seems you are providing a fudge factor based on intuition, but there should be a simple model which can encapsulate this view on the operation of the economy?
baffling The paragraph you quoted from was meant to shed light on the paragraph immediately following. You might say that the preliminary paragraph is a highly abstract model designed to direct attention to productivity growth. State of technology, capital stock, size of labor force, and hours worked are givens at the time of a shock that affects the nation’s psyche. Such a shock will impact overall demand, which then impacts production and hence productivity. In the period following the shock, I posited that the following would occur: normal depreciation would erode physical capital while technological advance and investment would slow and keep the effective stock of physical capital roughly unchanged. So unless manhours got stopped dead in their tracks, productivity growth would almost surely slow.
Lehman was an event that cast a pall – as of Sep 08. Productivity growth fell the following quarter. Manhours however also fell. 9-11 was a definable shock – Sep 2001. Productivity growth actually rose the following quarter, as manhours fell. The Asian crisis in 97 was not enough of a shock. Saddam Hussein invaded Kuwait in July 90 – a bona fide shock given the drop in consumer sentiment. Productivity fell the following quarter. As did manhours. The Crash of ’87 cast a pall that was exemplified by the Sep to Nov drop in sentiment. The following quarter, productivity fell. Manhours rose a smidgen.
The price of crude rose sharply from Apr to Sep 1979 – this being a shock spread over time. Sentiment was off by Jul, rebounded, and was down again by Dec. (Crude continued higher and sentiment declined into 1980.) Productivity fell throughout 79, and from Apr to Sep manhours rose. The first oil price shock hit the US in Jan 1974 when the administered price of WTI quadrupled. The hike in WTI was preceded by OPEC production cuts, embargo, and higher posted prices the quarter before. Back then, Michigan surveyed households every third month. From Nov 73 to Feb 74 sentiment plunged. In Jan-Feb-Mar 74, productivity plunged as well. Manhours rose by a smidgen.
In summary, I would modify what I originally said in this way. Manhours don’t necessarily stay constant, they have a tendency to fall. What happens to the level of productivity is indeterminate. But the all-important growth rate of productivity virtually always falls. In only one episode did productivity not fall. During nearly every episode real business investment also fell; and after factoring in depreciation, the stock of physical capital was impacted deleteriously in all episodes.
My main points, to which all this was prelude, still stand. When the credit impulse goes negative, productivity will take it on the chin. Moreover, an excessive level of debt relative to the economy’s means to service it condemns the economy to slow growth. Debt is the cloud now hanging over the globe. One channel through which debt slows growth is productivity. If firms are able to ramp up productivity growth, it will be at the expense of manhours. So there is no getting around it. Productivity, manhours, or both get whacked.
Gantal: The growth rate of GDP is the sum of the growth rate of the number of people working plus the growth rate of productivity per worker.
If the working-age population grows more slowly, then to achieve the same growth rate of total GDP, the growth of productivity per worker would have to increase.
Surely you are not denying that the working-age population in China is going to grow more slowly over this decade than it did over the last (the working-age population could well in fact decline). And surely you are not suggesting that productivity per worker in China is going to grow even faster this decade than it did the last.
I am unsure about productivity in China because, with my admittedly limited knowledge, they’ve relied mostly on process investment and are now upgrading at the high end to robotics. As in a high end technology line has been designed for literal hordes of workers with marginally smaller hordes of “engineer” supervisors overseeing groups and that has allowed them to bring in numbers of processes and process improvements – much of the old time and motion variety for designing and carrying out tasks. But the biggest are trying to reduce assembly line head counts, perhaps in total, perhaps for now to direct manpower elsewhere (given the high turnover rates, cost of training, numbers of supervisors, etc.), and much of that is through increasing automation. A guess and it’s just a guess is that mechanization will have a substantial effect on productivity – and it will filter through sectors – and may well counteract the change in workforce age availability.
Right, Professor, but the evidence is that China’s labor force has been contracting for three years running and the implied real productivity given wages, investment, production, and money supply is ~1%. With population growing ~0.5%, that puts the implied potential real GDP per capita for China at less than 1% to near 0%, which is the average trend rate for real GDP per capita for the US, EZ, and Japan since 2007.
IOW, the structural “new normal” rate of real GDP per capita for “secular stagnation” of the Long Wave debt-deflationary regime for 75-80%+ of the world economy is less than 1% to near 0%.
“The growth rate of GDP is the sum of the growth rate of the number of people working plus the growth rate of productivity per worker.”
This is so simple, so elegant and so true (does anyone doubt that?) and it offers so much to think about. My only quibble would be that I think “real” should be inserted somewhere. All economists, bloggers and commenters (and not just Gantal) should write that down and put it in their wallets or purses, just as a reminder. It seems that almost everyone is much too focused on tangential and secondary stuff without even trying to tie that back into this basic formula.
How is productivity measured? I thought China still had a large pool of people not yet engaged in the market economy….
don: I’m measuring productivity as GDP per worker, which makes the equation I wrote down an accounting identity. In other words, it is true by definition.
This helps Trump.
In difficult times, people reach out to demagogic and simple men.
While Hillary is out of touch more and more, no one believes her “average Joe style” campaign-a total flop.
Trump and Palin for President. America deserves them both (pun intended).
Johnny I enjoyed your post. I heard someone say that Trump isn’t the best candidate, but he’s the President that America deserves so I second that! lol.
Nah, it hurts Trump. This is financial games. The real economy is accelerating. I can seen consumer confidence hitting 1990’s levels by 2016.
Shades of 1998 Asian Crisis? Just wondered if this has been discussed at all. That it’s less a 2008 humdinger danger but some sort of emerging market flareup.
Of course no analogy is perfect. (e.g. we are not in a raging dotcom growth period in the West).
Nony, the better analogy is the late 1930s, early 1890s, and late 1830s. We’re rolling over again into the second cyclical deflationary recession of the Long Wave debt-deflationary regime.
Moreover, the last time the world experienced simultaneous unreal estate lending and price bubbles was prior to the Barings Bank collapse and Panic of 1893 that was followed by a global depression into the late 1890s.
Yes, it’s “different this time” because of fiat currencies and Keynesian deficit spending to prevent debt, price, and nominal GDP deflation; but this has only increased the scale of private and public debt to wages and GDP and the increasing drag from the imputed compounding interest costs to profits, wages, and gov’t receipts to service the debt that primarily benefits the rentier caste and thus contributes to exacerbating inequality and the pernicious effects.
http://www.bis.org/publ/work482.pdf
https://www.ifk-cfs.de/media-lounge/news-folder/excessive-private-debt-creation-as-a-cause-for-the-financial-crisis.html
http://www.latimes.com/business/la-fi-global-debt-20150729-story.html
http://tinyurl.com/nl9hu58
http://www.debtdeflation.com/blogs/2015/06/18/how-rising-debt-causes-inequality-and-crisis/
https://static1.squarespace.com/static/52c4c212e4b019e1bba20f52/t/54b4ed4ee4b0b491c39819b8/1421143374162/Final+Outlook+0115+x.pdf
There is simply too much debt, which is synonymous with asset bubbles, extreme inequality from wealth and income concentration to the top 1-10%, secular eras of slow growth and deflationary depressions, and financial instability, which in turn leads to economic insecurity for the working class bottom 90% and the tendency for social instability and gov’t reaction in response.
1937 anyone?
https://research.stlouisfed.org/fred2/graph/fredgraph.png?g=1GKx
The annual change rate of US household net worth adjusted for CPI, the US$, and population is again contracting at the rate previously experienced at the onset of recessions in 2008, 2001, 1981, and 1974; and this is likely worsening into Q2-Q3.
The stock market is finally recognizing the phenomenon, as the stock market has become a lagging indicator since the late 1990s rather than a leading indicator as is widely believed.
This contraction of household net worth is occurring despite of the Fed’s ZIRP and forward guidance to talk up price inflation, “escape velocity”, and asset prices/bubbles. Even the likes of Blackstone, Bridgewater, Leuthold, some Fed economists, and the IMF and BIS are stating the obvious that QE has little, if any, benefit to the real economy, and it likely increases finanancial instability by encouraging asset bubbles that result in gross distortions to commodity and asset prices and allocation of resources, capital, and investment.
Therefore, most economists, business leaders, politicians, and Wall St. types have been trained and conditioned that there cannot be a recession unless the central bank tightens with accelerating inflation and capacity constraints, resulting in a yield curve inversion that precedes recessions. But historically the yield curve DOES NOT invert ahead of recessions and bear markets during Long Wave debt-deflationary regimes, as in the case of Japan after 1992 and the US and UK during the 1930s-50s, 1890s, and 1830s-40s.
However, recessions and bear markets occur during debt-deflationary regimes (once-in-a-lifetime phenomena) due to insufficient income and demand after debt service occurring with very weak secular trend growth that renders the economy highly susceptible to all manner of shocks, including energy, natural disasters, labor actions, financial panics, and geopolitical events.
http://angrybearblog.com/2015/08/world-trade-is-falling.html
From Spencer on another thread. This is something that was evident as long ago as Q3-Q4 ’14, which I noted at the time in the context of world real GDP per capita decelerating to “stall speed”.
The world economy is in recession, including the US, only it is so far in the US being led by the energy, energy-related transports, and manufacturing. The stock market is only now catching on as a lagging indicator.
I just read the Adelman chronology of 1986. Of course nothing is identical but there are some interesting parallels. One is the complaints from OPEC about non OPEC being too sticky coming down, taking too long.
http://dspace.mit.edu/handle/1721.1/50178
Fun read, also.
https://research.stlouisfed.org/fred2/graph/fredgraph.png?g=1Hsd
https://research.stlouisfed.org/fred2/graph/fredgraph.png?g=1Hsh
https://research.stlouisfed.org/fred2/graph/fredgraph.png?g=1Hsy
Implied credit risk is at, or above, historical recessionary levels and similar to that of the early to mid-1930s, suggesting that there will not be a yield curve inversion before the next (current) financial market panic/crisis and recession.
https://research.stlouisfed.org/fred2/graph/fredgraph.png?g=1HsT
Instead, the yield curve will continue to flatten with banks’ net interest margin falling further, discouraging growth of lending and thus growth of deposits/money supply less reserves, which in turn will further reduce the trend rate of investment, wages, inflation, and GDP per capita. Banks will thus prefer buying Treasuries at 1-2% yields and selling to the Fed at a premium as part of ongoing QEternity rather than growing lending, i.e., liquidity trap of the debt-deflationary regime.