Food for thought over the long weekend.
Why Tighten?
I hear a lot about why, despite (by some accounts) a measurable output gap, and low inflation, we need to tighten because of e.g., an incipient housing bubble (or some other unidentified asset bubble). Reuven Glick and Kevin J. Lansing and Daniel Molitor at the SF Fed deal decisively with the leverage-induced housing bubble meme:
After peaking in 2006, the median U.S. house price fell about 30%, finally hitting bottom in late 2011. Since then, house prices have rebounded strongly and are nearly back to the pre-recession peak. However, conditions in the latest boom appear far less precarious than those in the previous episode. The current run-up exhibits a less-pronounced increase in the house price-to-rent ratio and an outright decline in the household mortgage debt-to-income ratio—a pattern that is not suggestive of a credit-fueled bubble.
Figure 2 from the piece conveys concisely and persuasively their argument.
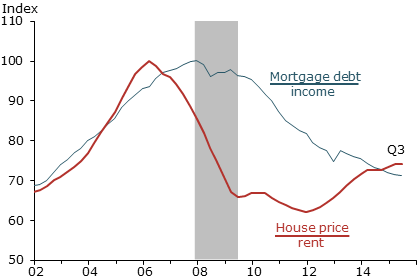
Source: Glick, Lansing, Molitor (2015).
For me, I remain unconvinced that there is tremendous froth in financial markets thereby validating the case for tightening. At least, it doesn’t appear to be in the housing market.
Tightening Already Underway
I’ve mentioned in an earlier post that the tightening has already begun, and dollar appreciation has in part signalled the reduced rate of Treasury accumulation by foreign central banks that in the past depressed long term yields. These trends are documented in Figure 1.
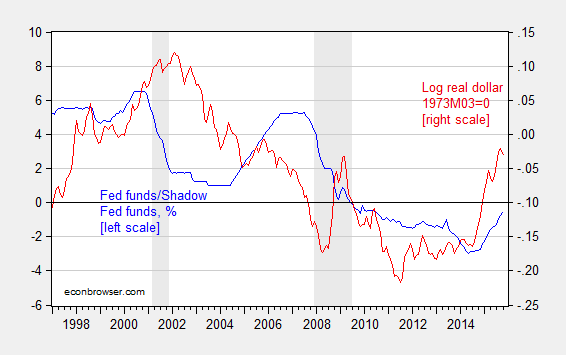
Figure 1: Fed funds/Shadow Fed funds rate (blue, left scale), log real trade weighted dollar – broad index, 1973M03=0 (red, right scale). NBER defined recession dates shaded gray. Source: Federal Reserve Board, Wu-Xia, NBER, and author’s calculations.
What is going to happen when the Fed actually raises rates? This is an interesting question, which is related to the trilemma. Joe Joyce at Capital Ebbs and Flows contrasts the views of Helene Rey (there’s only a dilemma) vs. those of Klein-Shambaugh, Popper-Mandilaris-Bird, and Aizenman-Chinn-Ito (there’s a trilemma). Professor Joyce sides with exchange rate regimes as still mattering, but re-interprets the Rey thesis:
…But her wider point about the linkages of asset prices driven by capital flows and their impact on domestic credit is surely correct. The relevant trilemma may not be the international monetary one but the financial trilemma proposed by Dirk Schoenmaker of VU University Amsterdam.
In this model, financial policy makers must choose two of the following aspects of a financial system: national policies, financial stability and international banking. National policies over international bankers will not be compatible with financial stability when capital can flow in and out of countries.
I don’t disagree with this view. But I must confess to being of limited imagination, and have a hard time conceiving of an international system that co-ordinates in an enforceable fashion a harmonized and effective system of international financial regulation. In other words, we have to consider policy effects in a world — for now — with regulatorily balkanized financial regulation.
In that context, Joshua Aizenman, Hiro Ito and I have updated our assessment of the impact of core country monetary policies on emerging market economies.
Generally, however, the linkages between developing countries’ exchange market pressure (EMP) and CE’s policy interest rates appear weak. The proportion for the significant linkage rises in the 2010-2012 period, but only to less than 20%. The EMP of developing countries is a little more sensitive to the REER movements of the center economies. The proportion of developing countries for which the center economies’ REER are jointly significant for the EMP estimation is the highest among the vectors of explanatory variables in the 2010-2012 period.
In general, the EMP of developing countries is more exposed to the influence of the center economies’ EMP. Especially, during the GFC years and in their aftermath, developing countries’ EMP is found more sensitive to the movements of the EMP of the CE’s, indicating that financial stress that arose in the CE’s must have been transmitted to developing countries during and after the GFC.
Exchange market pressure is a weighted average of exchange rate depreciation, reserve decumulation and interest rate increase, viz., αΔs + βΔi – γΔr (changes expressed relative to base country). What is the quantitative extent of the impact?
Based on the estimation results, for the group of EMEs, if the U.S. [real effective exchange rate] REER rises (i.e., real appreciation) by 10%, the EMP on average would rise by about 1.2. This (unit-less) figure stands for about 0.6-0.8 standard deviations of major EMEs’ EMP, which is not unsubstantial.
In other words, the US dollar appreciation — in the neighborhood of 15% — is feeding through into elevated exchange market pressure. The components of the EMP are shown for select EMs below.
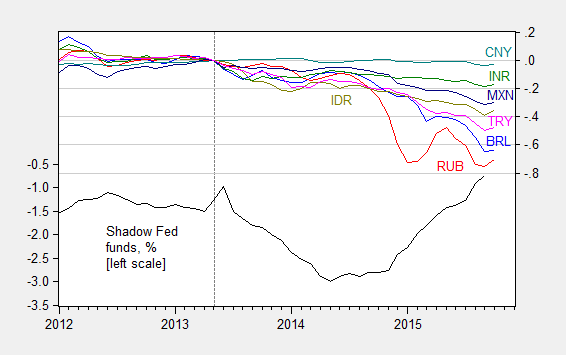
Figure 2: Shadow Fed funds rate, in % (black, left scale), log exchange rate against USD, where down is depreciation, for Brazil (blue), Russia (red), India (green), China (teal), South Africa (purple), Indonesia (chartreuse), Mexico (dark blue), and Turkey (pink), all normalized to 2013M05=0, right scale. October data is through October 14th. Source: FRED, Wu-Xia, Pacific Exchange Services and author’s calculations.
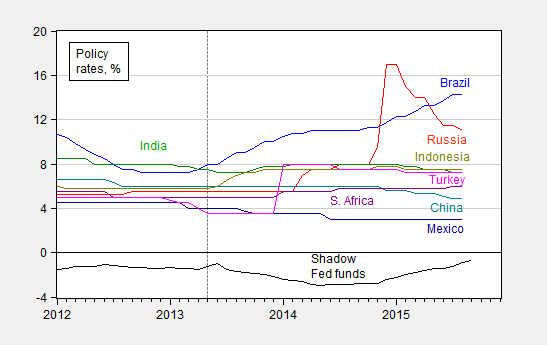
Figure 3: Shadow Fed funds rate (black), policy rates for Brazil (blue), Russia (red), India (green), China (teal), South Africa (purple), Indonesia (chartreuse), Mexico (dark blue), and Turkey (pink). October data is through October 14th. Source: FRED, Wu-Xia, Pacific Exchange Services and author’s calculations.
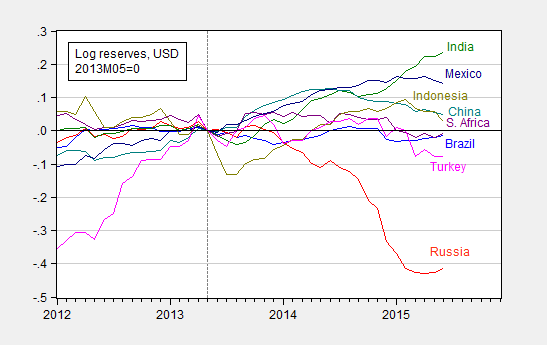
Figure 4: Shadow Fed funds rate (black), and log international reserves ex.-gold for Brazil (blue), Russia (red), India (green), China (teal), South Africa (purple), Indonesia (chartreuse), Mexico (dark blue), and Turkey (pink), all normalized to 2013M05=0. Source: FRED, Wu-Xia, and author’s calculations.
The “Just Get It Over With” Pespective
I’ve been to three conferences over the past month or so involving emerging market central bankers. One common refrain I heard was that it would be better to just get the “liftoff” over with, and resolve the uncertainty. While I think it’s human nature to want to act, it seems to me that after the first rate increase, one would immediately start wondering about the timing of the next rate rise.
In other words, an earlier Fed funds rise might be cathartic for emerging market policymakers, but I think their relief might be short-lived.
“Just Get It Over With”
That was what all the leaders said in the run up to WWI. Everyone knew it was a bad idea but they just couldn’t resist the urge. These are our best and brightest? What a irresponsible and childish way to run things.
I think, the Fed telegraphing a small and slow tightening cycle can raise optimism and reduce uncertainty.
It won’t be like the 2004-06 tightening cycle when the Fed Funds Rate was raised 1/4 point at each meeting, from 1% to 5 1/4%.
Also, I think, markets will be comforted the Fed’s balance sheet will shrink and the Fed will be in a better position to deal with the next recession.
Moreover, I think, markets already have confidence in how the Fed responded to economic conditions, at least since the 2007 peak, and that confidence will continue.
Peak: “I think, the Fed telegraphing a small and slow tightening cycle can raise optimism and reduce uncertainty.”
https://app.box.com/s/earfgyknu6xx8woigktnnny6dn7devt2
https://app.box.com/s/7n04zb119bd8edjlpho9akk14xqvxvvf
https://research.stlouisfed.org/fred2/graph/fredgraph.png?g=2HBg
https://research.stlouisfed.org/fred2/graph/fredgraph.png?g=2HAM
https://research.stlouisfed.org/fred2/graph/fredgraph.png?g=2yLR
https://research.stlouisfed.org/fred2/graph/fredgraph.png?g=2FMK
The market has already been tightening such that the acceleration of the velocity of TMS to private GDP is in a recession-like contraction; Aaa and Baa spreads are at recession/crisis levels of the past; the broad equity market is in a bear market; and household net worth is contracting YoY.
The Fed raising rates now would be like tightening in spring-summer 2008; summer-fall 2001; during the recessions of the early 1980s and mid-1970s; and during the 1930s-40s Great Depression and WW II.
In this context, assuming that the Fed had the power implied, which they don’t, the Fed has already failed to prevent TMS from contracting, a bear market, and loss of household net worth. So much for the Fed “controlling the money supply” and “managing” the “wealth effect”. Oops!
The Fed is too late to tighten and as likely to resume QEternity in 2016 to liquefy further TBTE banks’ balance sheets in order to fund an increasing deficit/GDP to prevent nominal GDP from contracting in 2016-17 with CPI at ~0%, Japan again in recession, China at a potential real GDP per capita of 0%, and parts of the EZ in deflation and at NIRP.
peak,
“I think, the Fed telegraphing a small and slow tightening cycle can raise optimism and reduce uncertainty.”
i hear this argument time and again by the pundits, media and policy makers. personally i think it is a garbage perspective, but it is a free country and you can choose your own beliefs. but menzie already addressed this type of response when he said
“While I think it’s human nature to want to end to act, it seems to me that after the first rate increase, one would immediately start wondering about the timing of the next rate rise.”
so peak, why is there so much uncertainty at the current rate, but an increase of 0.25% will reduce uncertainty of the next rate? in particular, why does increasing the rate while we are in a fragile recovery, with the threat of increasing future rates, improve the uncertainty? other than perhaps increasing the certainty of a future downturn due to such rate increases. but that won’t help your increased optimism, peak.
Baffling, you seem to believe a recession is around the corner.
What if the labor market continues to strengthen or improve and inflation accelerates?
Then, the Fed, given lags in the adjustment process, will need to raise rates sharply and quickly, from a very low level.
If it doesn’t and falls further behind the curve, expect a further plunge in optimism and a further spike in uncertainty.
no peak, i do not believe recession is right around the corner. but the economy is not hot enough to require higher rates either.
“What if the labor market continues to strengthen or improve and inflation accelerates?”
you either fail to understand the asymmetry of risks or you intentionally ignore the asymmetry. the risk of higher inflation produces much less damage than a return to deflation and/or recession. so i see no reason to worry about your imaginary inflation risks until it actually appears. at that point, you can raise rates. it makes absolutely no sense to raise rates prior to actual inflation. calling for rate hikes today is simply silly economics or the pursuit of an agenda. which is worse, 4% inflation or a return to recession and deflation?
Rate increase will be in Dec. that’s already decided.
The dear Janet.
The amount : I do not know.
Get it over with.
Real wages and new home price:
https://research.stlouisfed.org/fred2/graph/fredgraph.png?g=2Gma
https://app.box.com/s/rc12ftw8oprf10pbnfb2vcry7tsyyiwm
https://app.box.com/s/zsa8qobvkd141ghmq7o8mj90p7d2x5rx
Wilshire Total Market Full Cap Index:
https://research.stlouisfed.org/fred2/graph/fredgraph.png?g=2GmJ
https://research.stlouisfed.org/fred2/graph/fredgraph.png?g=2GmP
https://research.stlouisfed.org/fred2/graph/fredgraph.png?g=2Gmo
https://research.stlouisfed.org/fred2/graph/fredgraph.png?g=2yLR
Household net worth:
https://research.stlouisfed.org/fred2/graph/fredgraph.png?g=2FMK
As is clearly evident from the data at the links above, there are/were no equity or real estate bubbles in the US, and Americans’ net worth is in good shape.
Therefore, there can be no deflating bubbles and bear markets to adversely affect net worth, confidence, and consumer spending, which implies that the Fed is free to raise rates because there are no bubbles and no risk of bursting asset bubbles.
What could be more logical?
No worries. It’s all good.
We are bankers – this is what we do.
“We are bankers – this is what we do.”
Precisely, which is creating successive bubbles and busts for decades (centuries?) while denying that bubbles exist or can ever be identified in real time (demonstrably false, of course), only to print trillions in fiat digital book entry reserve credits to TBTE banks (or the TBTE banks direct the Fed to print the reserves) out of the virtual ether to bail the banks that profit from the bubbles (and often the busts by shorting assets, including those held by their own clients in the case of GS) at the expense of the rest of society.
But let us give thanks for being lucky enough to be denizens of the Anglo-American, militarist-imperialist, rentier-socialist corporate-state rather than on the receiving end of drone bombing (at least not yet) and the consequences of the chaos and mass destruction of Anglo-American and European oil empire.
Order from chaos.
Housing is a microcosm. No one believes housing is enough of a bubble that it can bring down the house of cards as in 2008. The next crisis will source from elsewhere. Nonetheless, the first chart (fig 2 from the SF Fed paper), raises a very interesting point. Household mortgage debt to income is steadily declining and is no longer in bubble territory. Whereas (not shown on the chart), home prices to income are a third of the way back to their 2006 bubble peak. So the question becomes which construct better illustrates underlying reality? The ratio of the stock of mortgage debt to income (fig 2), or the ratio of home prices to income?
The denominators are both the same. However the numerators are wholly different concepts, and expressed in different units. If high debt and high prices, it’s a bubble. If low debt and low prices it’s not a bubble. But what about high prices and low debt (the current case)? Or the other case of high debt and low prices? The latter is hard to envision in the late expansion phase of any business cycle unless the cumulative debt had gotten so large as to still press down on price. Anyway that is not the case today, as home prices bottomed in 2011. Today it is case 3 – falling debt and rising price. How can this be? Existing home inventory is flat, but new home inventory is rising. The percent of all cash buyers has been tapering since 2011. If mortgage debt to income is falling, and on the margin cash buying is not what is taking home prices up, what is?
My instinct is that the search for yield during this ZIRP era has taken supply off the market turning a significant portion of single family dwellings into rental units. Also most underwater homeowners are not willing to sell (having mostly weathered the storm at this point). Both limit supply. Does this seemingly strange behavior of home prices have something to do with real estate owned (REO) by banks? Is there some kind of hidden or shadow bubble here that household mortgage debt to income does not account for, but instead non-household balance sheets does?
Any ideas?