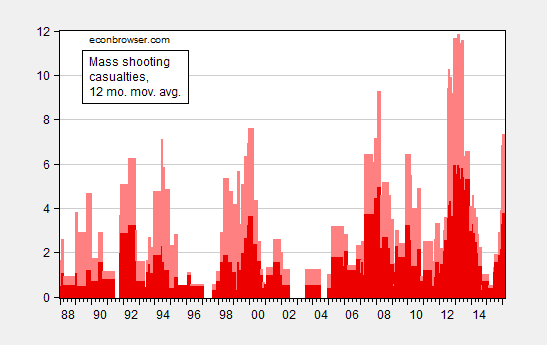
Figure 1: 12 month moving average of mass shooting casualties; deaths (dark red), wounded (pink). Source: Mother Jones, GunViolenceArchive.org. for January 2016, and author’s calculations.
Update, 2/5 1:45PM Pacific: Title amended to address m4570d0n‘s pedantic comment.
Update, 2/6, 10:30AM Pacific: Reader joe argues per capita figures would be more intuitively accessible. Here is the relevant graph.
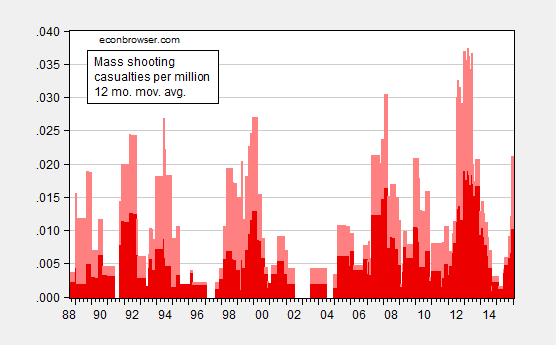
Figure 2: 12 month moving average of mass shooting casualties per million; deaths (dark red), wounded (pink). Source: Mother Jones, GunViolenceArchive.org. for January 2016, and author’s calculations.
Note: Mother Jones used a 4 death threshold for definition of mass shooting; I have used that criterion for tabulating January 2016 numbers.
Obviously we need more good guys with guns.
Wouldn’t taking a moving average make anything look cyclical, iid or otherwise?
James G: Yes, but does that matter? If I just run a linear regression of casualties on time over the past year, I see a positive trend.
And we have idiots with guns in Oregon trying to overthrow the government because they aren’t getting enough free stuff from the government.
Is it really a mass shooting if 1 person dies? Just saying that a moving average might not be the best way to visualize this because for over half those years that’s what the chart shows.
Between 1988 and 2016, the US population has increased from @244 million to @323 million, roughly 30%. So we might expect at least that much.
joe: Maybe you do; I don’t. The elasticity of mass shooting casualties with respect to population is about 2.8 (statistically significant), so casualty intensity is increasing.
To clarify, I meant that I would expect an increase of 30%, all else being equal.
joe: According to my estimates, the increase is greater than 30%. So by your criterion, casualty intensity is increasing, yes?
I wasnt disputing your claim, just noting that a per capita stat may be more informative.
joe: I’ve added Figure 2. The trend is apparent in the per capita series.
Including incidents that involve zero deaths is, at best, intentionally misleading. The incidents involving zero deaths made up about 50% of what gunviolencearchive.org erroneously labels as a mass shooting for 2015. You cite Mother Jones, but even the page you cite shows 4 mass shootings for all of 2015. How is that indicative of mass shootings being on the rise?
The Congressional Research Service put out a report in July 2015 titled “Mass Murder with Firearms: Incidents and Victims, 1999-2013.” It’s is much more thorough and a more more reliable source of information.
http://fas.org/sgp/crs/misc/R44126.pdf
According to their data, of the 317 mass shootings in the US between 1999 and 2013, 66 (21%) were mass public shootings. The other 79% of incidents (and 71% of fatal victims) were family or felony-related. And when you look at Figure 3 in the report, which shows the number of mass public shootings by year, it is immediately clear that there is no discernible trend. These events are not on the rise and continue to be exceedingly rare events. To further illustrate that point, CRS also noted that for the 13-year period of 1999-2011, there were 54 incidents that could be classified as mass public shootings, out of a total of 197,191 murder and nonnegligent manslaughter incidents. Or stated another way, mass public shootings accounted for 0.027% of all murder and nonnegligent manslaughter incidents over this period.
Additionally, only 31 of 317 mass shooting incidents (9.8%) involved firearms that could be classified as “assault weapons” (and even that is a stretch).
m4570d0n: If you actually look at the XLSX file, you’ll see there is a 4 death threshold in the Mother Jones dataset. I used the same criteria to judge casualties for January sourced from GunViolenceArchive. Hence, there are no “zero death” entries incorporated into the graph.
In addition, I have changed the title of the post to accommodate your critique of numbers.
Relax. The Oculus rift is coming out in mere weeks. Once it is out, mass shootings will go down again….