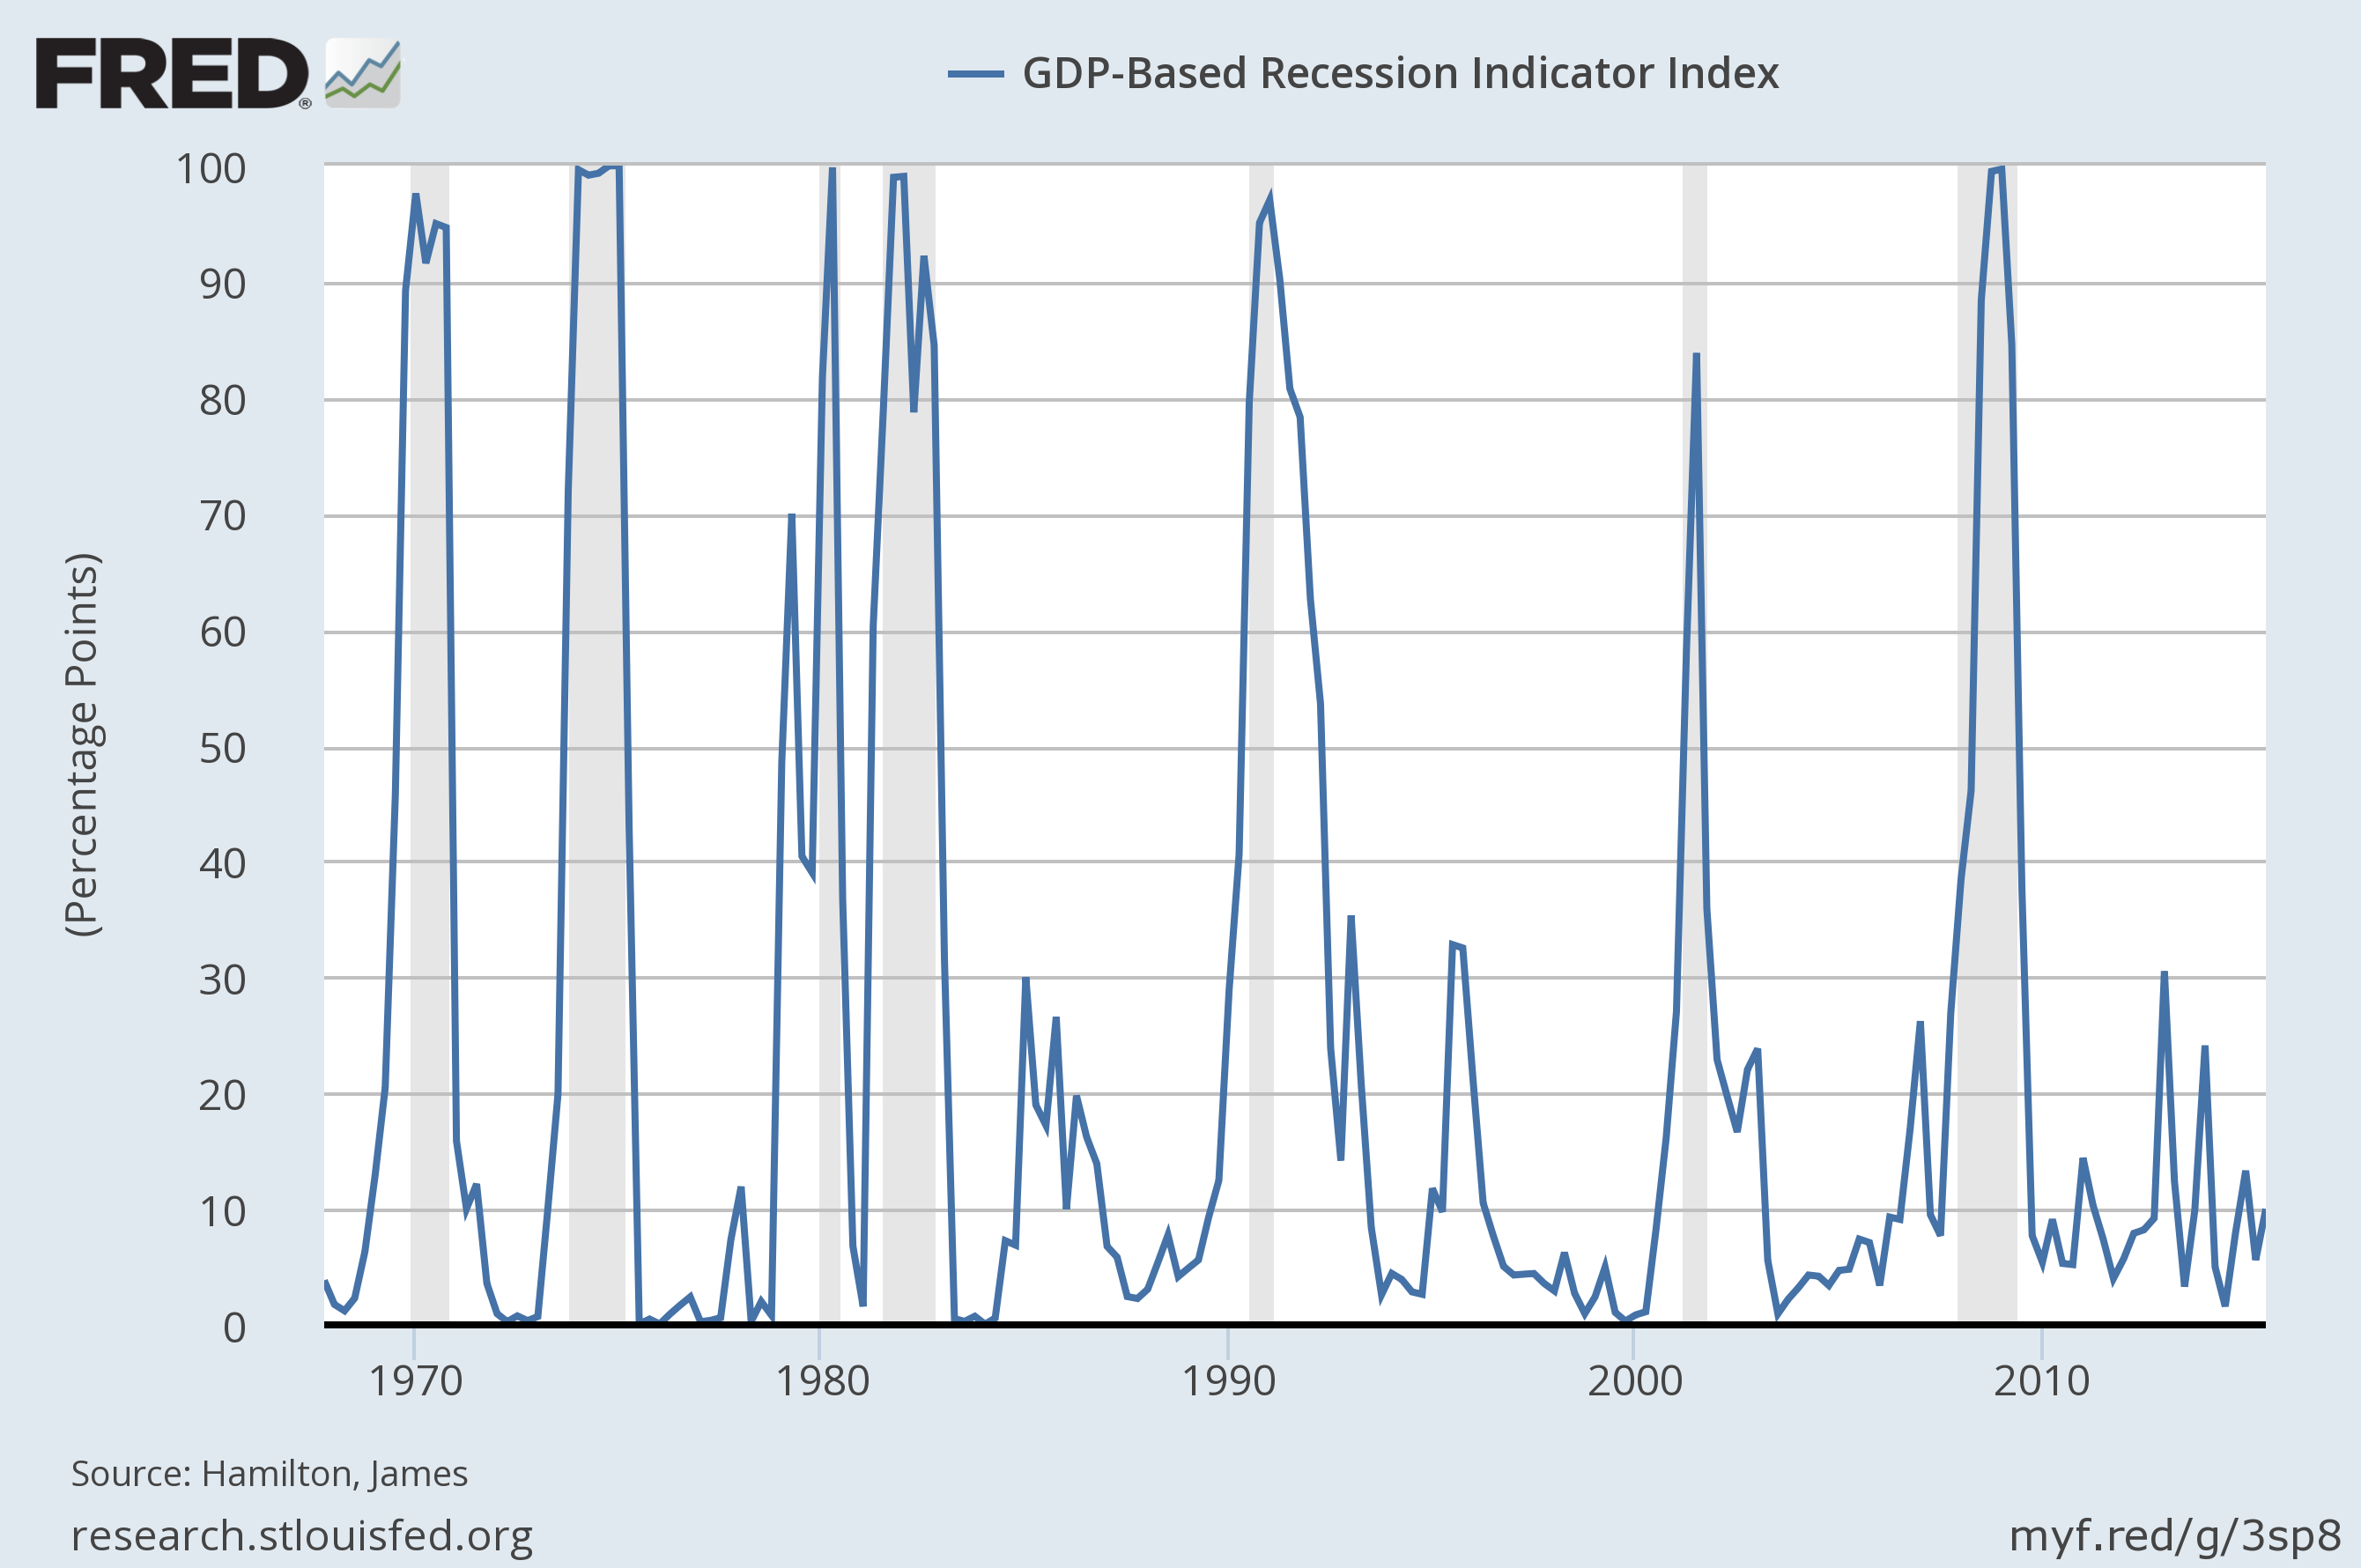
Our GDP-based recession indicator index is now available from FRED, the database maintained by the Federal Reserve Bank of St. Louis.
Source: FRED.
One use of this series is for academic research where it is important to specify predictive relations based on what market participants could have actually known at the time. The recession dates established by the NBER Business Cycle dating committee (shown as shaded bars in the graph above) were assigned long after the fact. That means if you include the NBER dates in a regression, you are “predicting” variables on the basis of future outcomes, which can lead to all kinds of spurious conclusions. By the way, I have the same objection to the popular Hodrick-Prescott filter, which also uses future observations to construct the “cyclical” component of a given time series. By contrast, the solid line in the graph above is strictly real-time, with each observation based solely on data available as of one quarter after the indicated date, and is never subject to data revisions. A link to the historical date when each value was released in real time can be found here. Even prior to 2005, each value for the series plotted above was calculated based solely on the unrevised GDP data as it would have been available as of one quarter after each plotted date.
The index is a nonlinear function of the observed historical GDP data as of each date that is intended to capture the move in and out of recession. See my recent paper for a survey of this and related ideas.
FRED is also maintaining a series of recession dates that come from this approach. These are not strictly real-time, but are based on the following algorithm. When the above strictly real-time index crosses 67%, the economy is declared to be in a recession, and the beginning date of the recession is defined as the first date for which the nonlinear inference (based on all the data available as of the date of the recession declaration) went above 50%. The assigned beginning date is not strictly real-time because it is now using the revised data for earlier quarters as well as the new data for the observation that generated the recession call to revise the probabilities assigned to earlier quarters. Once the beginning date is announced it is not subsequently revised. When the real-time index falls below 33%, the recession is declared to be over, with the end date again determined as the date for which the revised inference as of the time of the recession-over declaration first fell back below 50%. Dates at which the recession beginning and ending dates were announced can be found in this spreadsheet. Again an important difference from the NBER dates is that these dates are generated entirely mechanically with no subjective judgments.
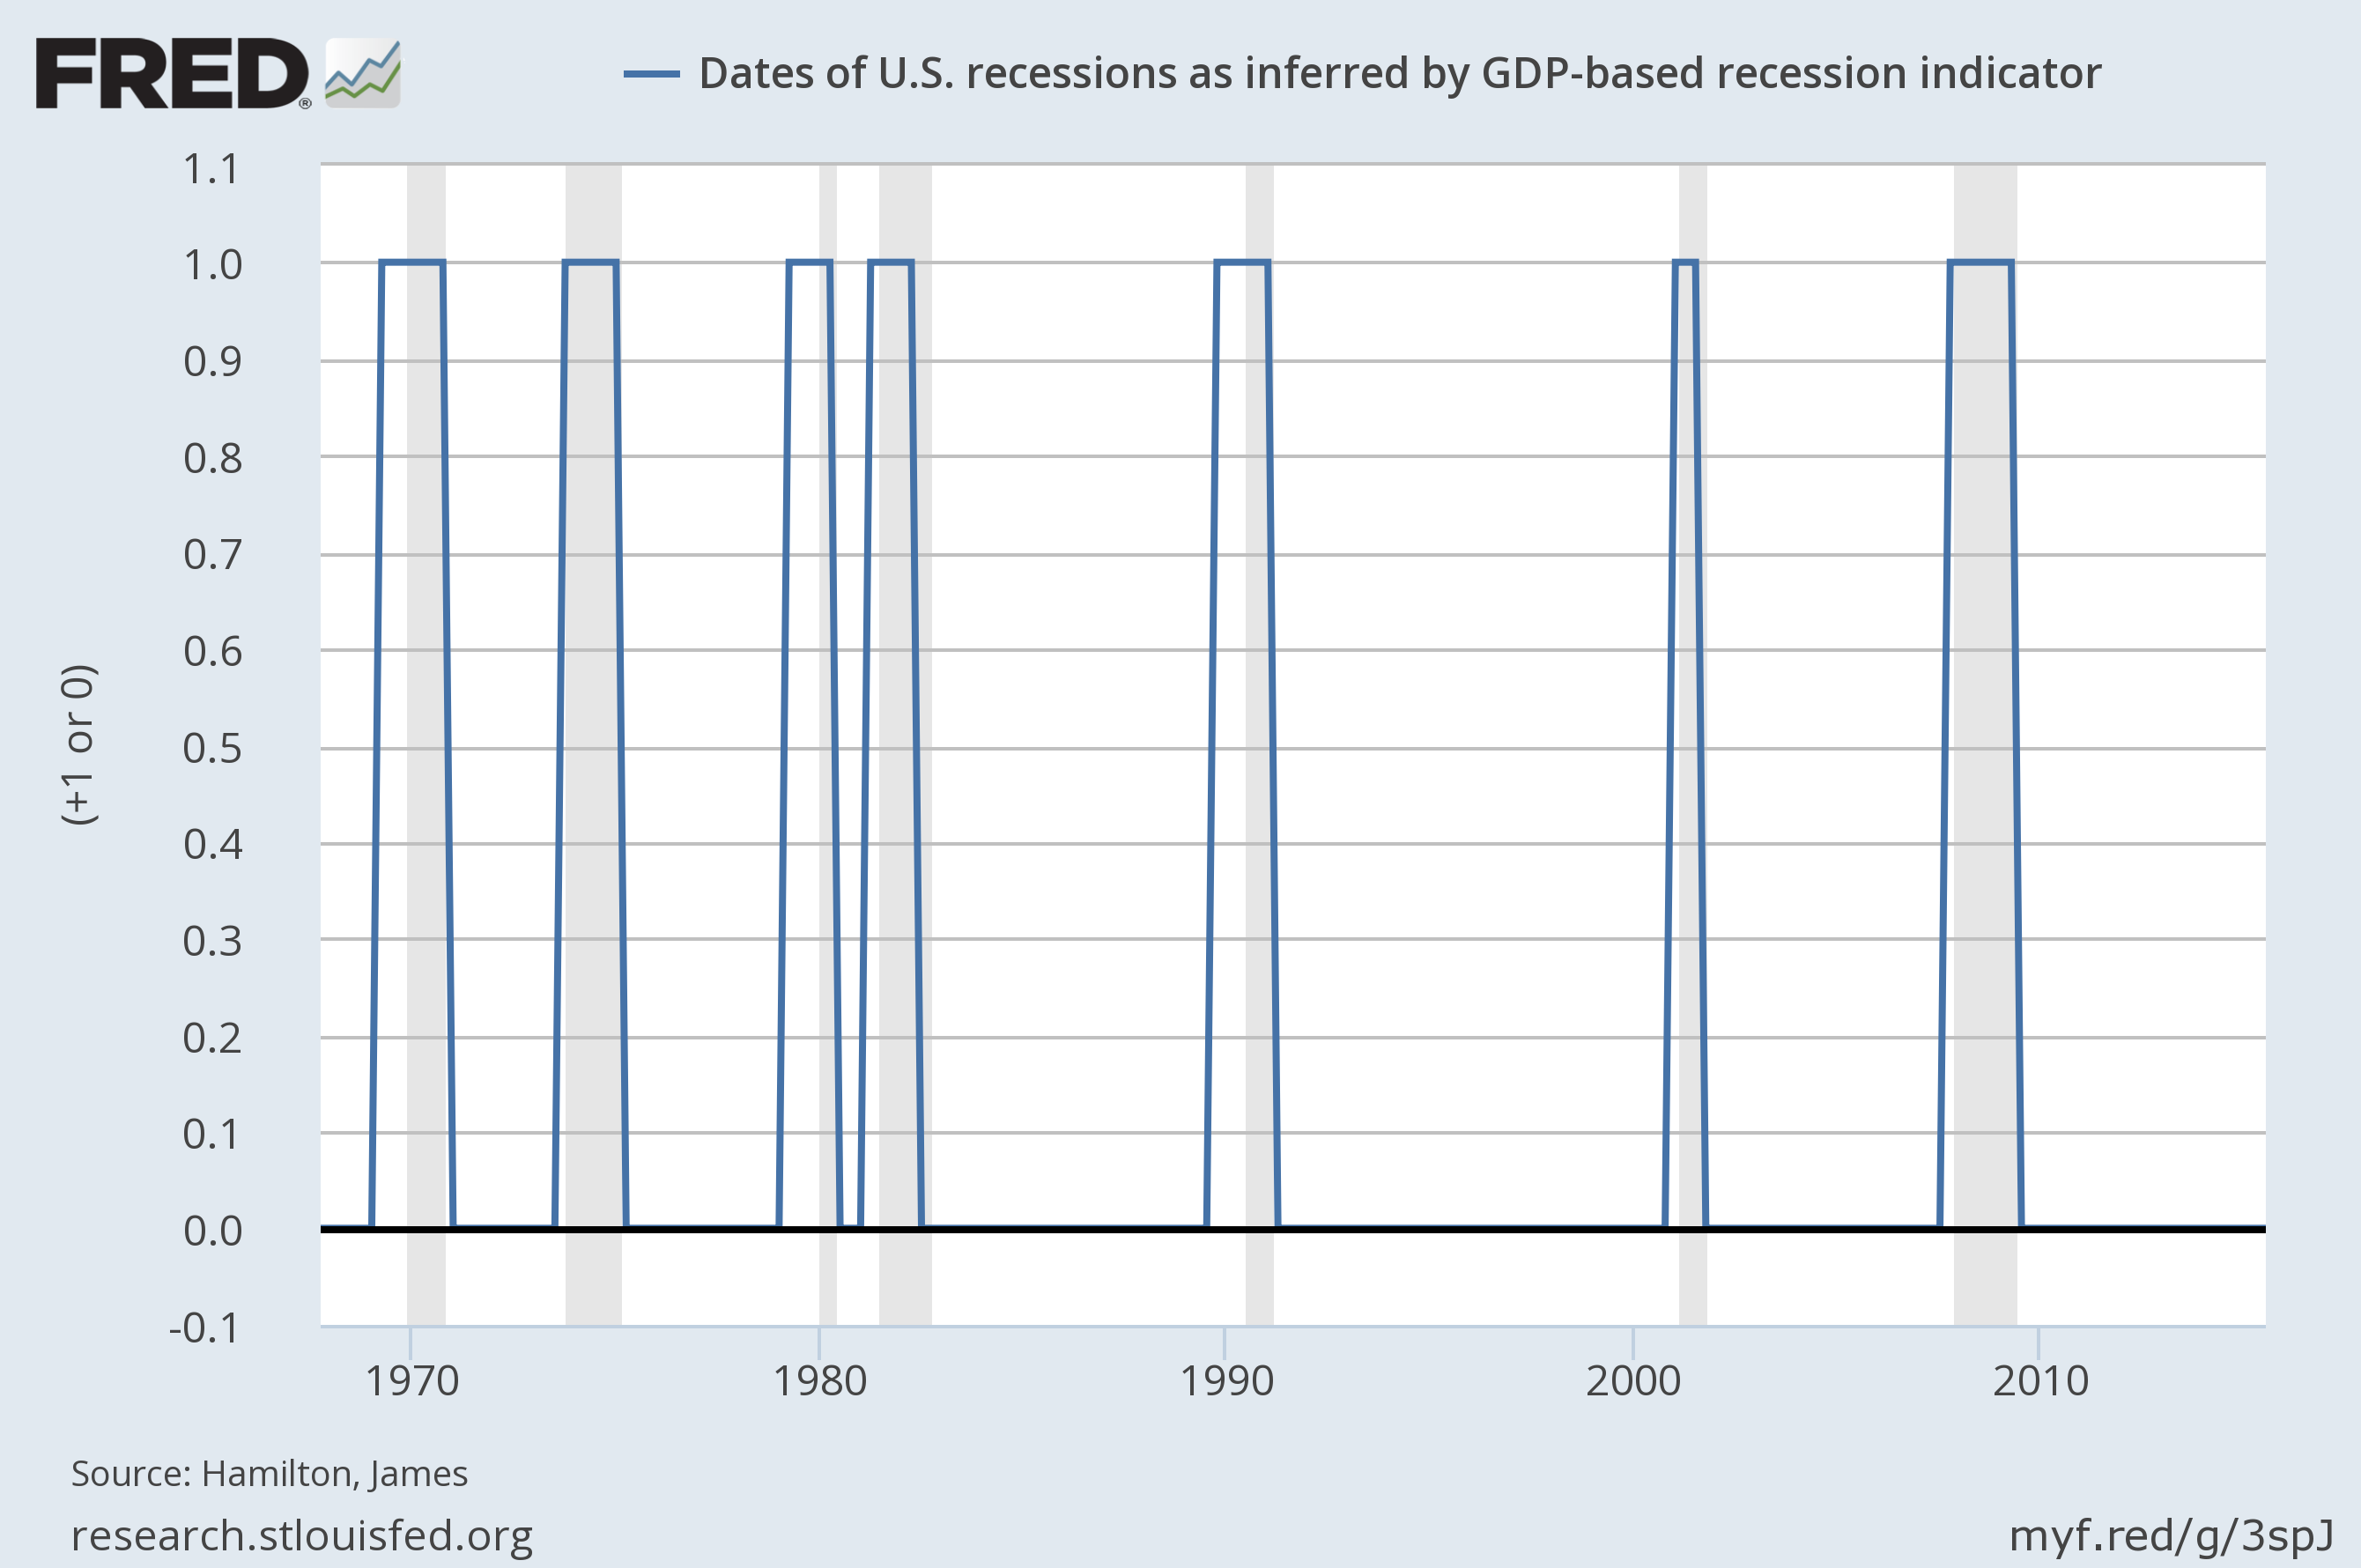
Source: FRED.
FRED also provides access to an alternative recession-dating procedure developed by Chauvet (1998). This is based on 4 monthly indicators. Unlike the real-time indexes above, the values in the graph below use all the data as available and revised today to form an optimal inference about each plotted date. But as in the above two graphs, the inference is entirely mathematical.
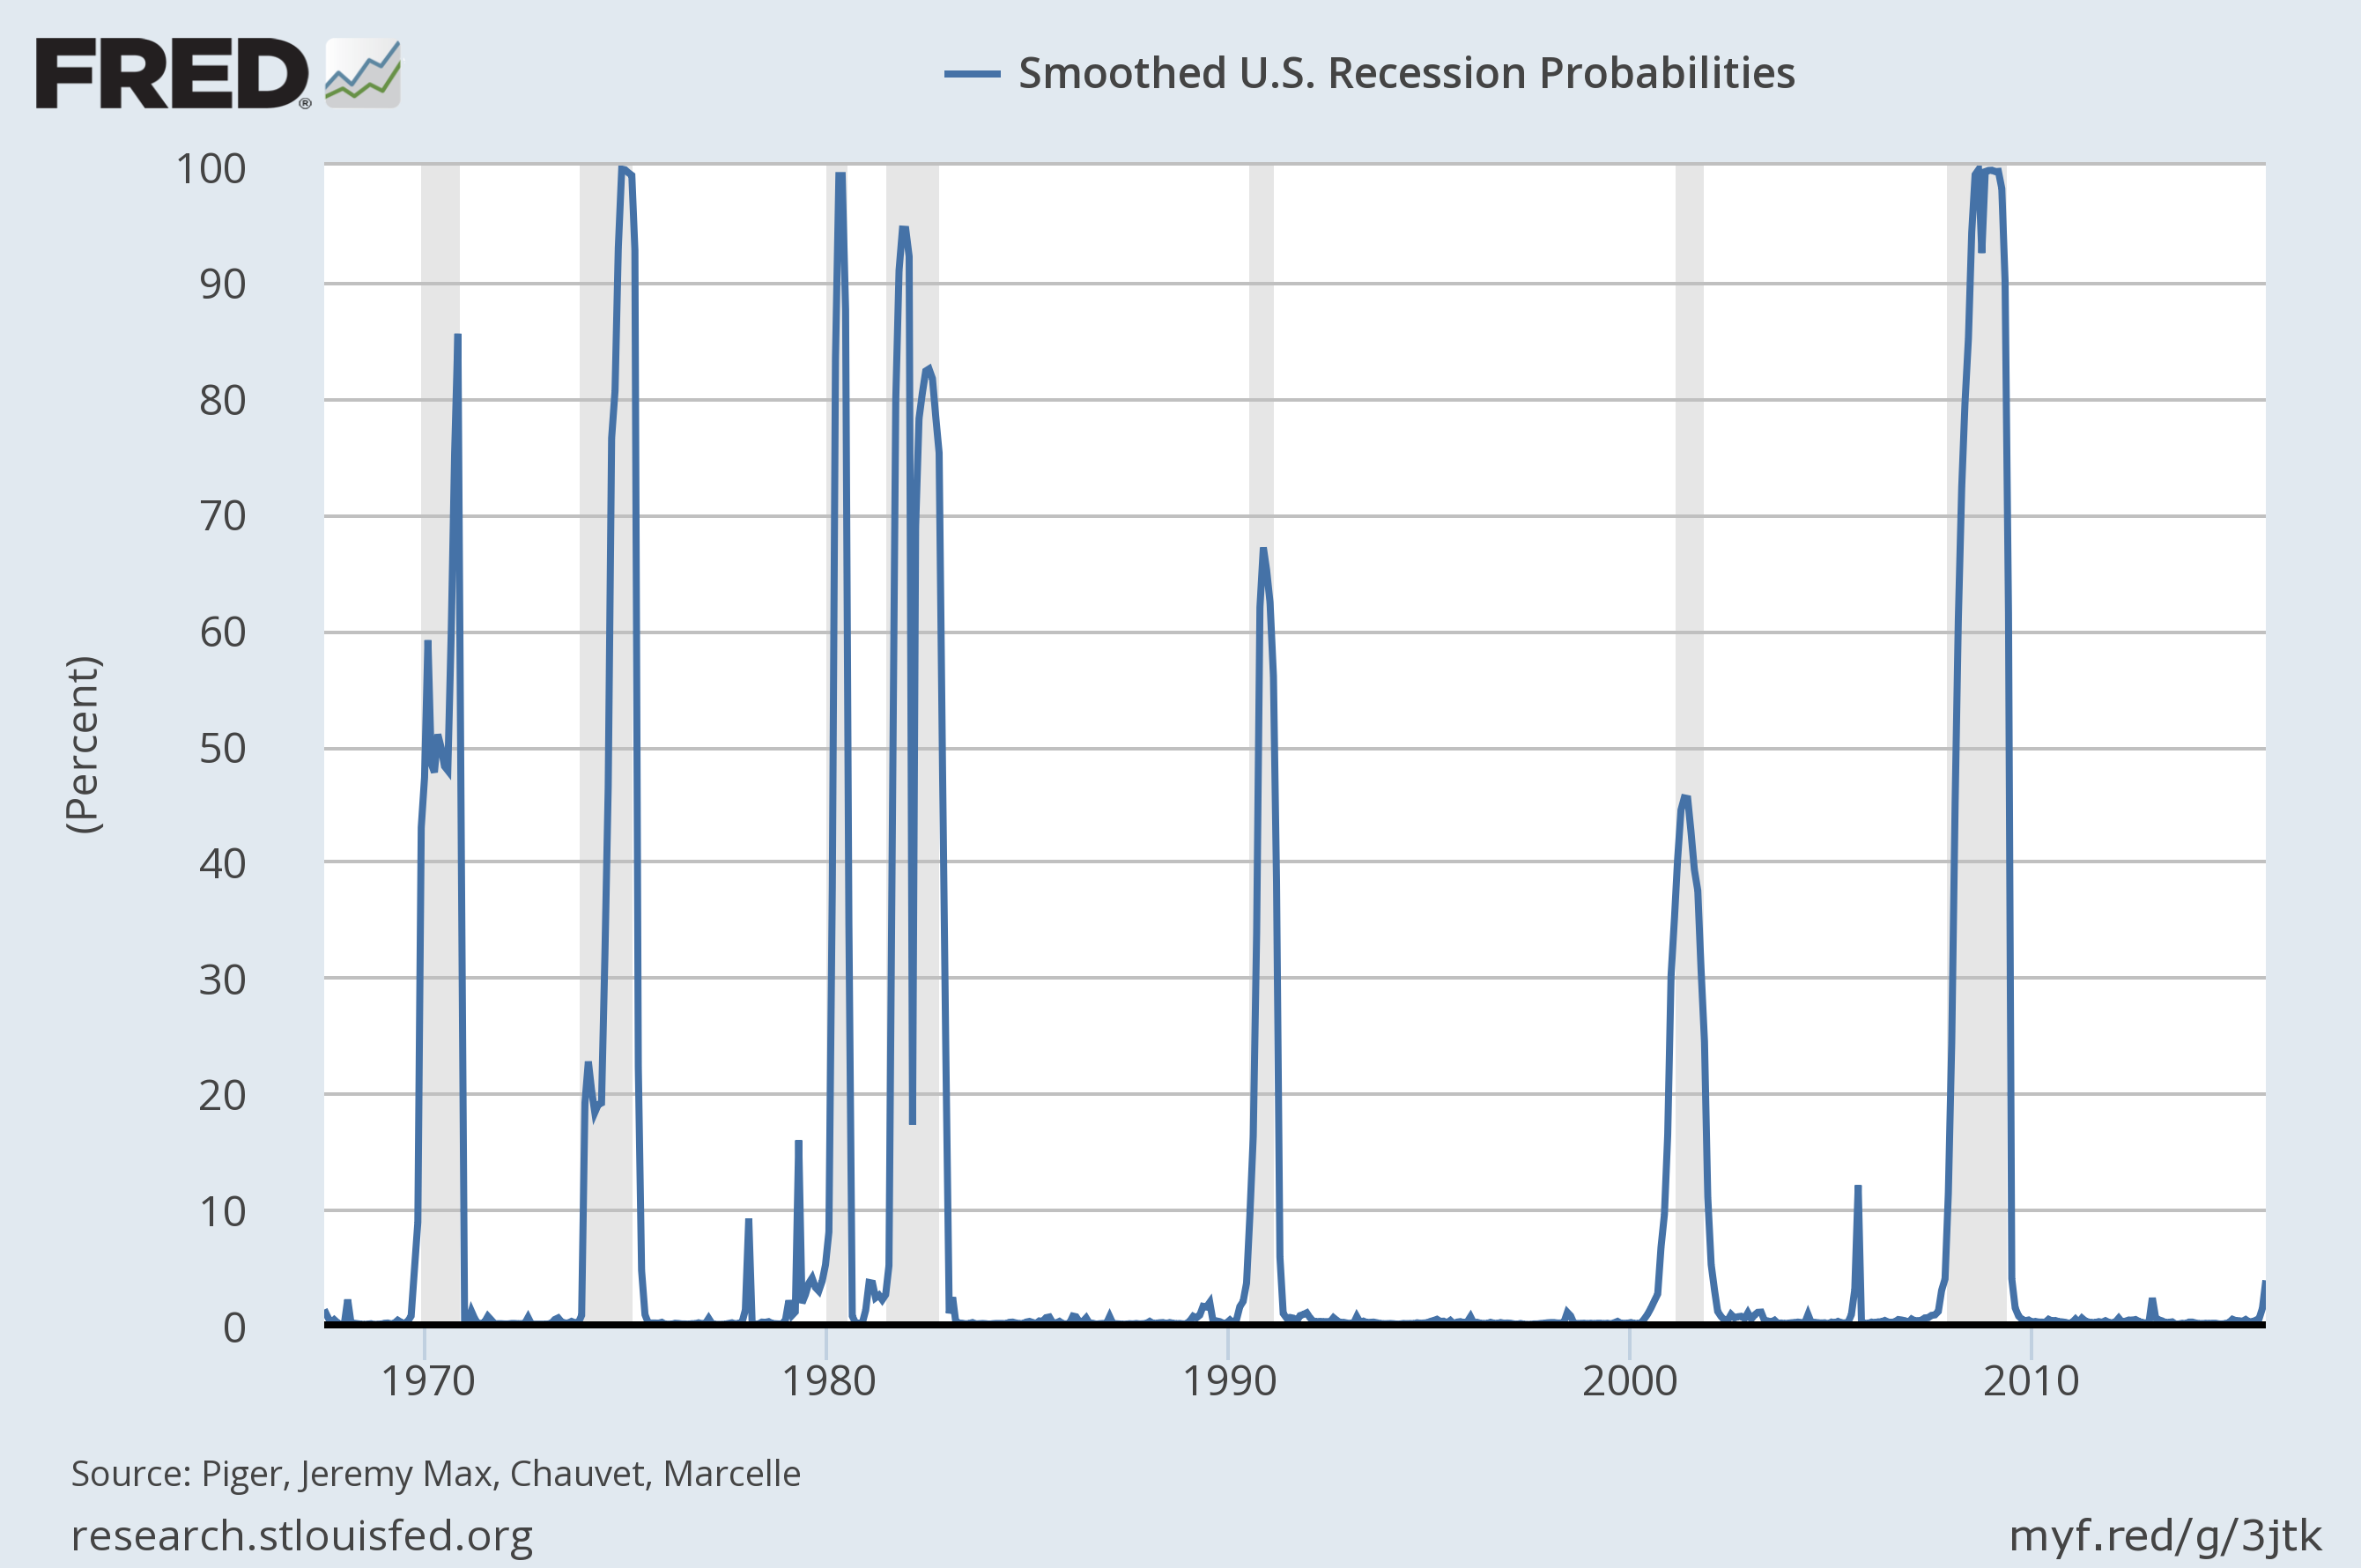
Source: FRED.
These indexes are strictly backward-looking, seeking to answer the question of whether the U.S. has already entered a recession. As you can see, their answer is that the U.S. is not in a recession. It is of course a more interesting (but far more difficult) task to try to predict whether a recession is about to arrive. Menzie has been keeping us up to date on one of the more promising approaches to predicting recessions before they arrive, for which the current answer is still that a recession is not imminent.
Just before the 1980 recession there is another occasion when the line crosses the 67% mark and thus should be classified as a recession by your criteria but has not been defined as a recession by the NBER.
Incidentally it also counts as a mild and short-lived recession by another criterion: YoY changes in real personal consumption expenditure. See the graph on http://www.philipji.com/item/2015-10-04/us-recessions-and-recoveries-over-55-years
The Fed had less control over asset prices than you think. The FOMC raised the Fed Funds Rate from 1% in 2004 to 5 1/4% in 2006, and left it at 5 1/4% till September 2007.
When it began the easing cycle, oil prices continued to soar reaching $150 a barrel by mid-2008. The only significant mistake the FOMC made was not beginning to ease sooner, I.e. early 2007.
And, the Fed had less control over the housing and student loan booms. Moreover, given trade deficits reached $800 billion a year in the mid-2000s, it had no control “refunding” U.S. consumers through tax cuts.
Philip George: The recession call would have been issued when the index rose to 70% for 1979:Q2, and would have remained in effect until the index fell to 6.8% for 1980:Q4, at which date the last quarter of the recession would have been declared to be 1980:Q2.
The funny thing about recessions is that recession predictions can become self-fulfilling (expectations). I am hearing a lot of chatter of a recession during the next two years based solely on the notion that expansions die of old age.
The fundamental problem remains tight money from the Fed. They have been overly optimistic about almost all their predictions for the last 7 years. Inflation has not been above 2% for how many years now? It’s not an average, it’s a ceiling!
While I do not buy the “old age” theory of recessions, I do buy the tight money theory of recessions, and we are definitely entering territory where the risk of a policy mistake is quite high.
We may have had a “soft landing” already (from a low altitude).
You’ve heard the story of the tortoise and the hare?
Maybe, it’ll be steady and slow growth for an extended period of time.
And, won’t stop before growth accelerates.
I am more worried about the service sector overheating 2017-19 than recession. The service sector overheating is pretty much a future recession. Capital is flush and the demand chain for residential investment is growing.
Unfortunately these indices are largely useless because of their lags. Thanks Fred for telling us that we were likely entering a recession in Feb 2009.
Perhaps it’s a buy signal. As soon as the data releases and economists catch up to what everyone else knows, it’s time to buy.
Yet, the Fed has been a reliable predictor of business cycles, and fulfiller of smoothing-out business cycles
For example, the Fed began lowering the Discount Rate in August ’07 and the Fed Funds Rate in September ’07 before the economy peaked in December ’07.
The Fed knew quantitative easing was needed and knew it had to wait, until recently, before raising the Fed Funds Rate.
The Fed has been ahead of the curve. Also, it predicts how much money creation or destruction is needed to spur, sustain, or slow growth.
Professor Hamilton,
Any thoughts about Jim Rogers’ forecast of a100% probability of a recession within twelve months due to what he sees as flat payroll tax receipts and the level of debt? His views were reported on MSN website on 3/4/2016. I could not find monthly data of payroll tax receipts. I could find only annual data, table 2.4 https://www.whitehouse.gov/omb/budget/Historicals that seems to forecast a modest percentage increase of about 3.3% for 2016.