The Bureau of Economic Analysis announced today that U.S. real GDP grew at a 0.7% annual rate in the fourth quarter. That’s a bad quarter to be sure, and real GDP is up only 1.8% from a year ago. That’s a weak year judged by the U.S. postwar average of 3.1%, but is not far from the 2.1% annual growth we’ve been averaging since 2009:Q3.
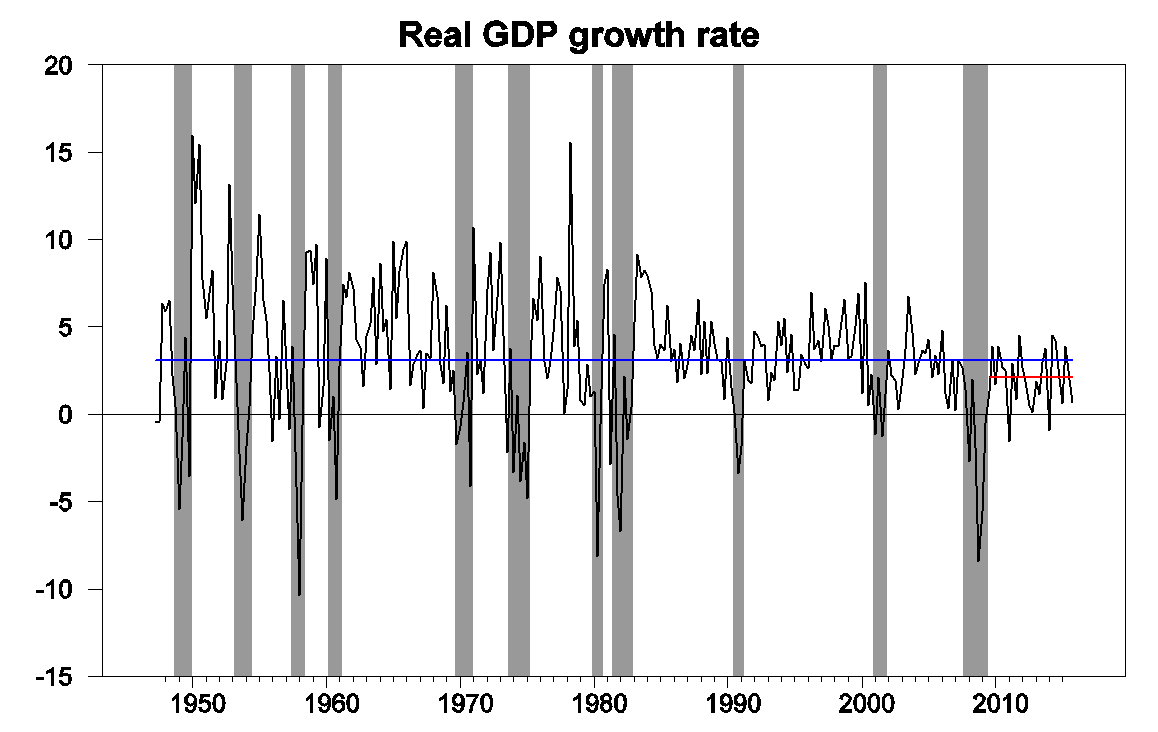
Real GDP growth at an annual rate, 1947:Q2-2015:Q4, with historical average (3.1%) in blue and post-Great-Recession average (2.1%) in red.
One concerning detail in today’s report was that nonresidential fixed investment fell during the quarter, pulled down in part by slashed capital spending in the oil patch. Inventory drawdown (often an erratic component) and net exports each subtracted almost half a percentage point from the annualized Q4 growth rate.
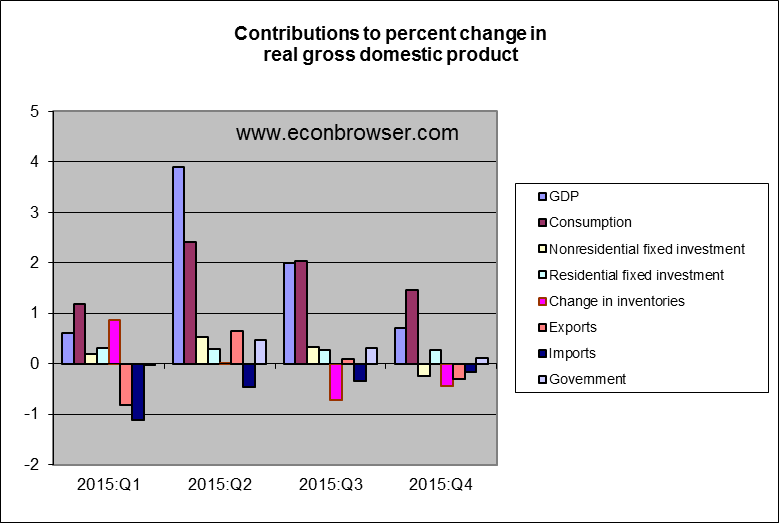
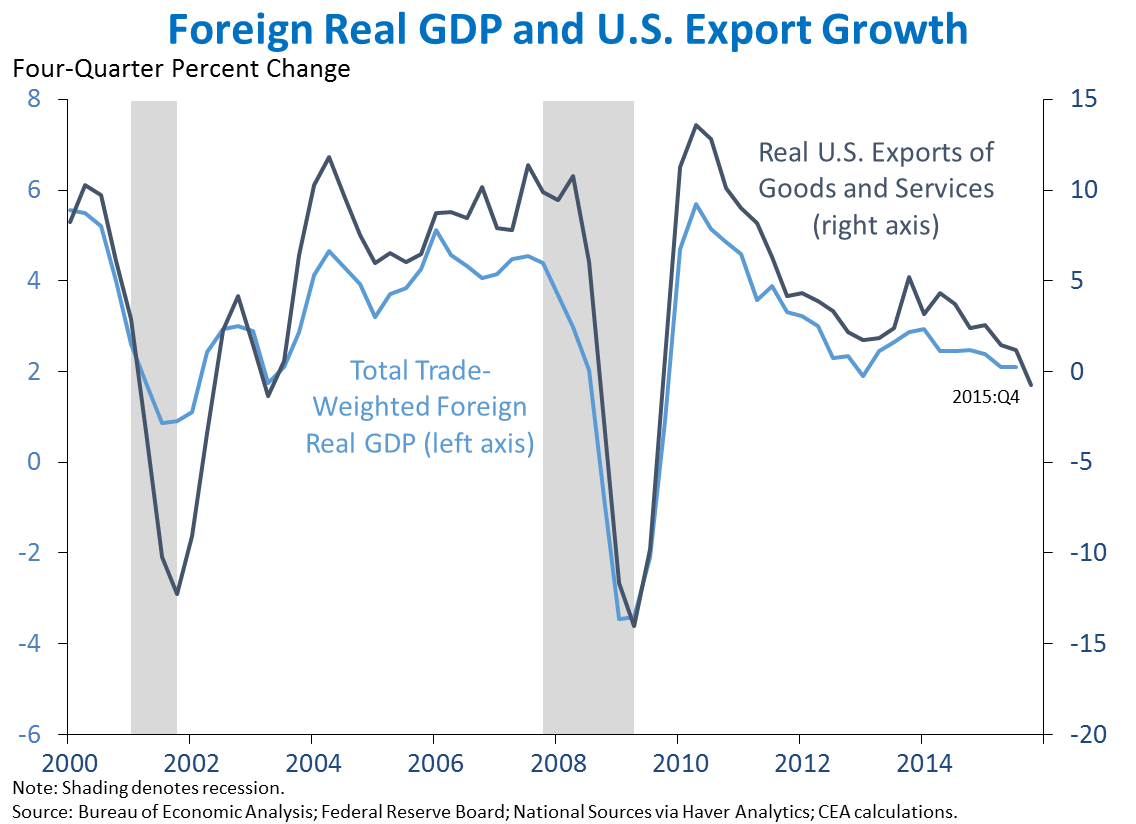
Weakness in the global economy and strong dollar were surely factors in the drop in net exports. The U.S. is not immune to developing concerns in Europe, China, Japan, and elsewhere.
Source: Jason Furman.
The Q4 GDP numbers produced a modest increase in the Econbrowser Recession Indicator Index up to 10%. The index uses today’s data release to form a picture of where the economy stood as of the end of 2015:Q3. That’s still way below the 67% threshold at which our algorithm would declare that the U.S. had entered a new recession.
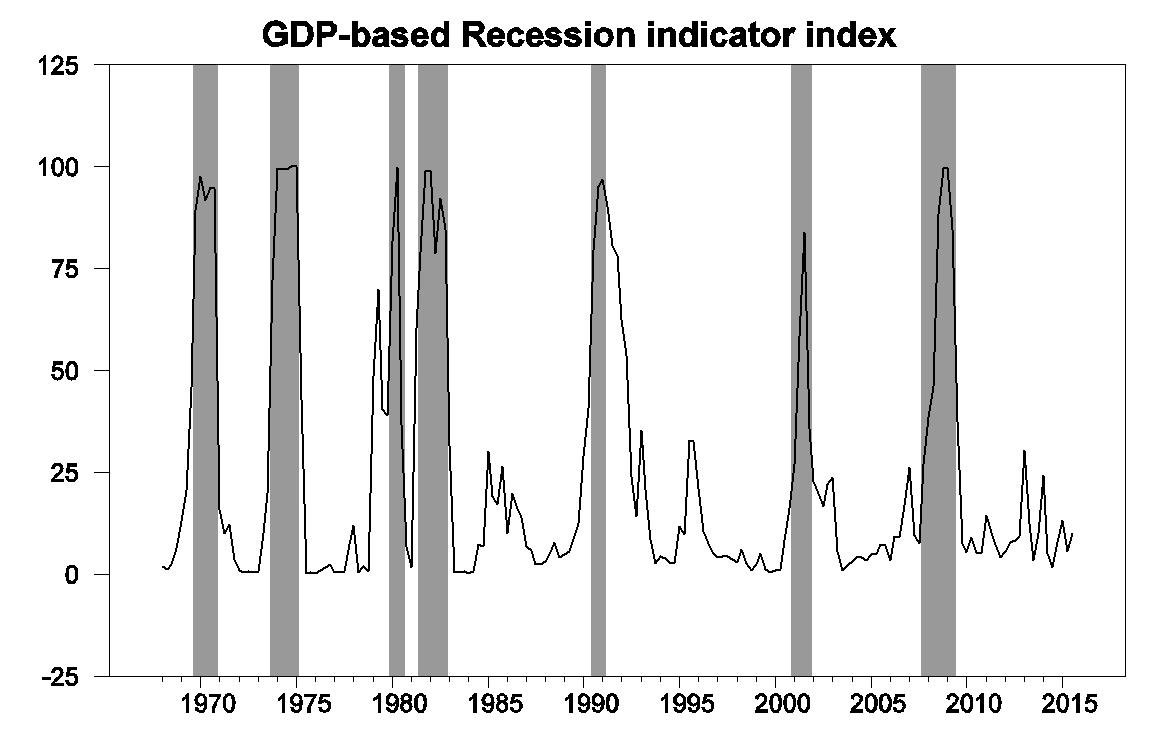
GDP-based recession indicator index. The plotted value for each date is based solely on information as it would have been publicly available and reported as of one quarter after the indicated date, with 2015:Q3 the last date shown on the graph. Shaded regions represent the NBER’s dates for recessions, which dates were not used in any way in constructing the index, and which were sometimes not reported until two years after the date.
With much talk of recession in the air these days, I was curious to look at some other indicators. UCLA Professor Ed Leamer suggested four useful rules of thumb. He noted that a recession is usually characterized by an increase in the unemployment rate of 0.8 percentage points over a 6-month period. Today’s unemployment rate is actually 0.3% lower than it was in June.
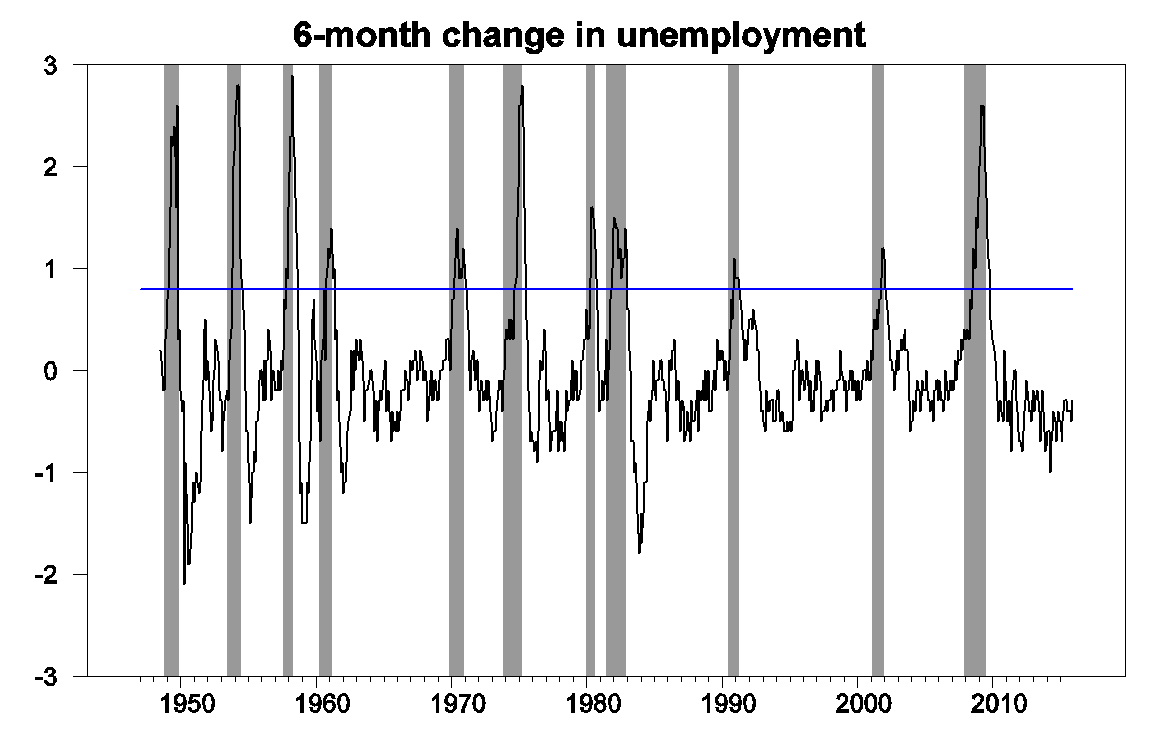
6-month change in civilian unemployment rate, from FRED, with NBER recessions as shaded regions and blue line at +0.8 threshold.
In a recession we’d likely see payrolls of nonfarm establishments fall by more than 0.5% over a 6-month period. They’re up 1% over the last 6 months.
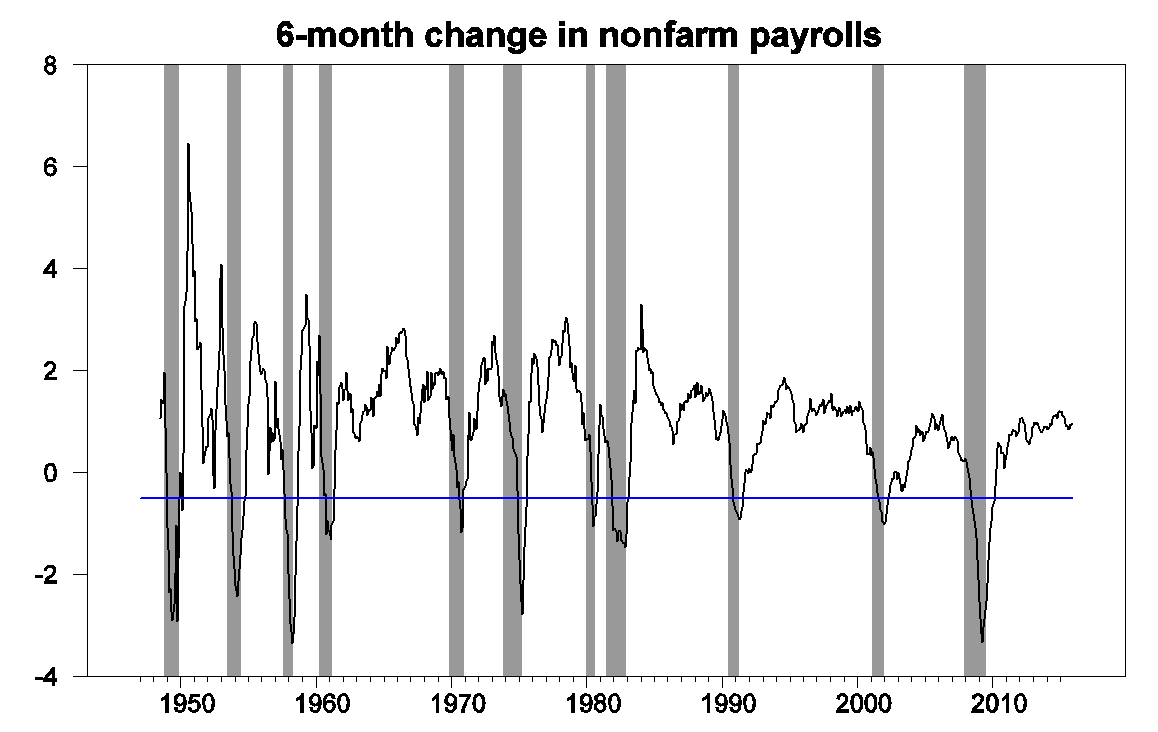
100 times the 6-month change in natural log of seasonally adjusted nonfarm payroll employment, from FRED, with NBER recessions as shaded regions and blue line at -0.5% threshold.
The separate BLS measure of employment based on their survey of households is up 0.8%.
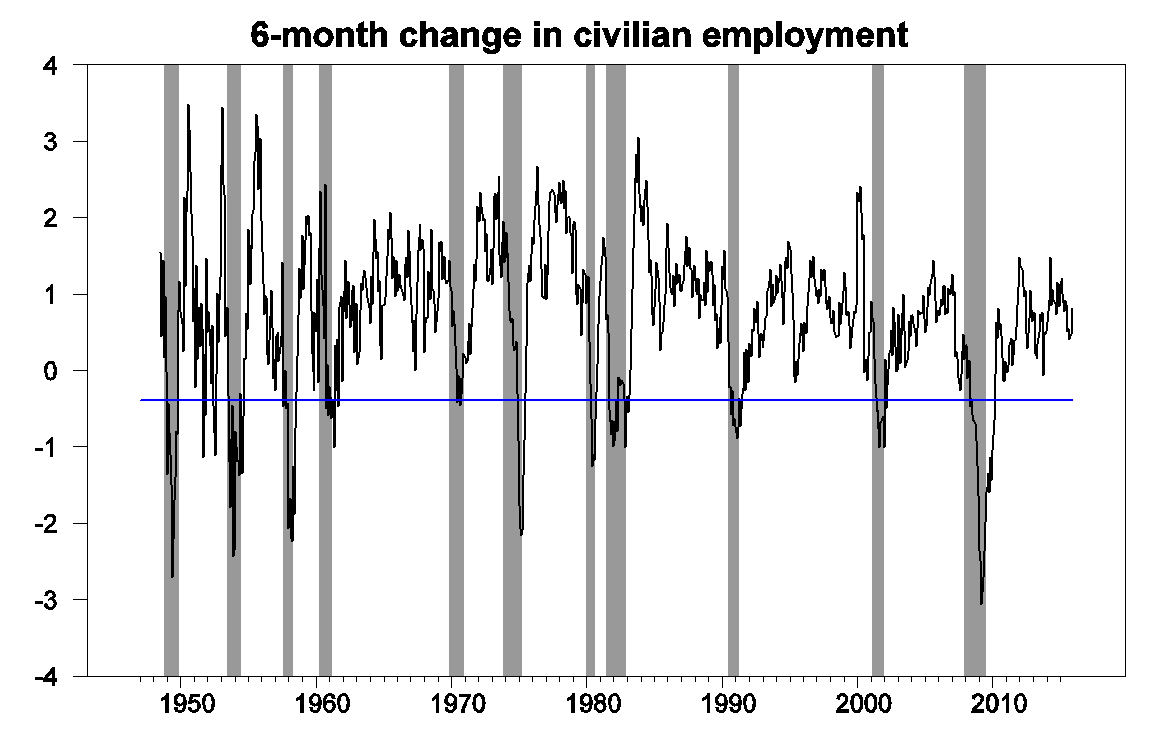
100 times the 6-month change in natural log of civilian employment,
from FRED, with NBER recessions as shaded regions and blue line at -0.4 threshold.
Leamer’s fourth suggested indicator, the Federal Reserve’s index of industrial production is down 0.6% over the last 6 months. But Leamer wanted to see a 6-month drop of more than 3% before calling it a recession.
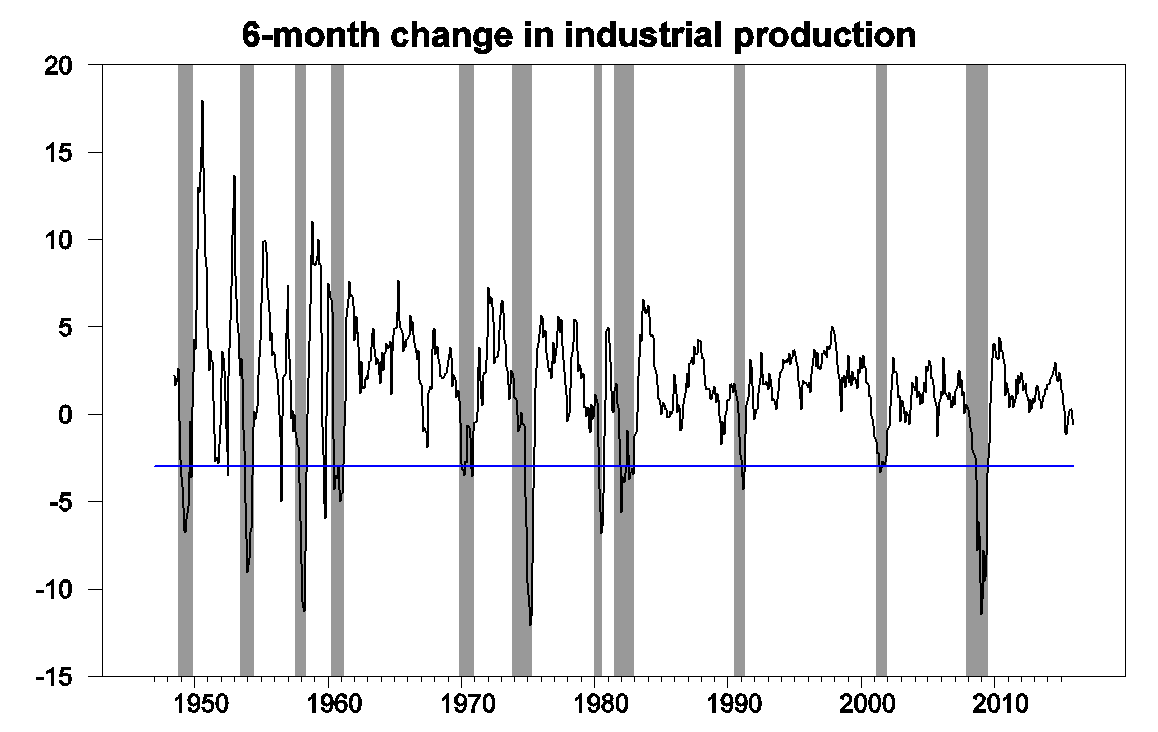
100 times the 6-month change in natural log of index of industrial production, from FRED, with NBER recessions as shaded regions and blue line at -3.0 threshold.
Though I am concerned that even the 12-month change in industrial production is down.

100 times the 12-month change in natural log of index of industrial production, from FRED, with NBER recessions as shaded regions and blue line at 0.0 threshold.
Another indicator of weakness in the manufacturing sector is the ISM Purchasing Manager’s Index, currently at 48.2. Any value below 50 indicates that more responders are indicating declines rather than improvements in key measures. But an analysis of this indicator by Travis Berge and Oscar Jorda concluded that you’d want to see a value below 44.5 before calling it a recession.
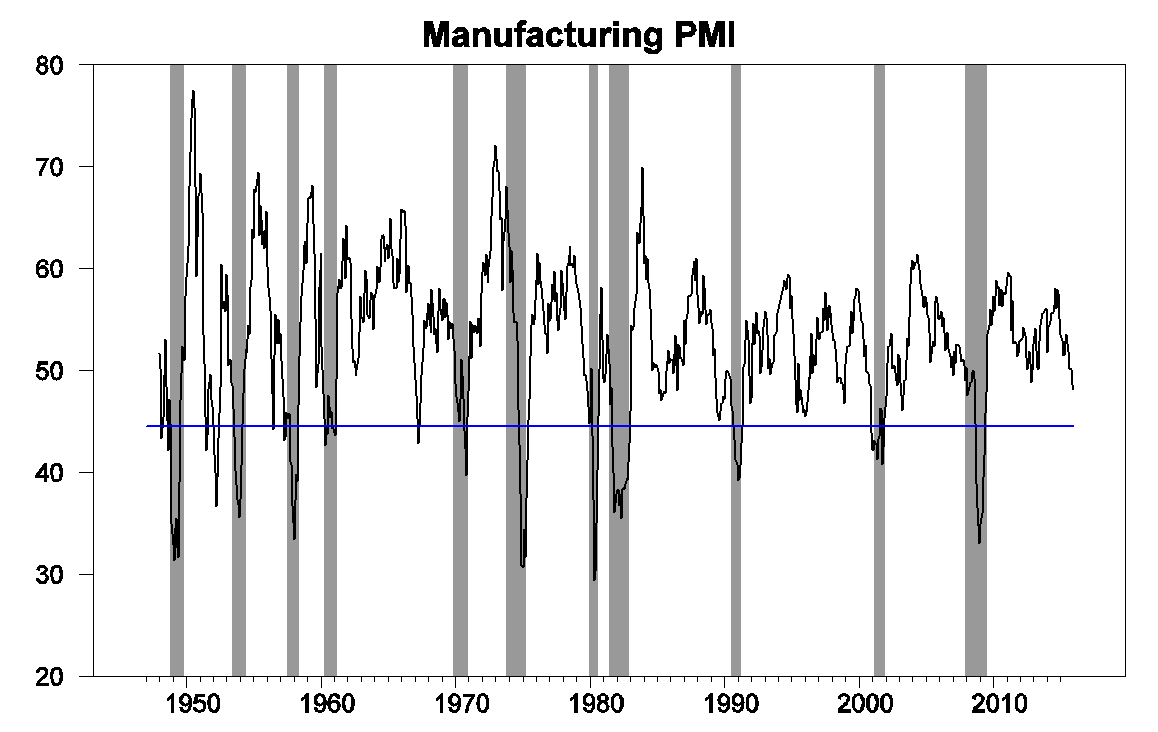
ISM Manufacturing PMI Composite Index, from FRED, with NBER recessions as shaded regions and blue line at 44.48 threshold.
And the non-manufacturing PMI is looking solid.
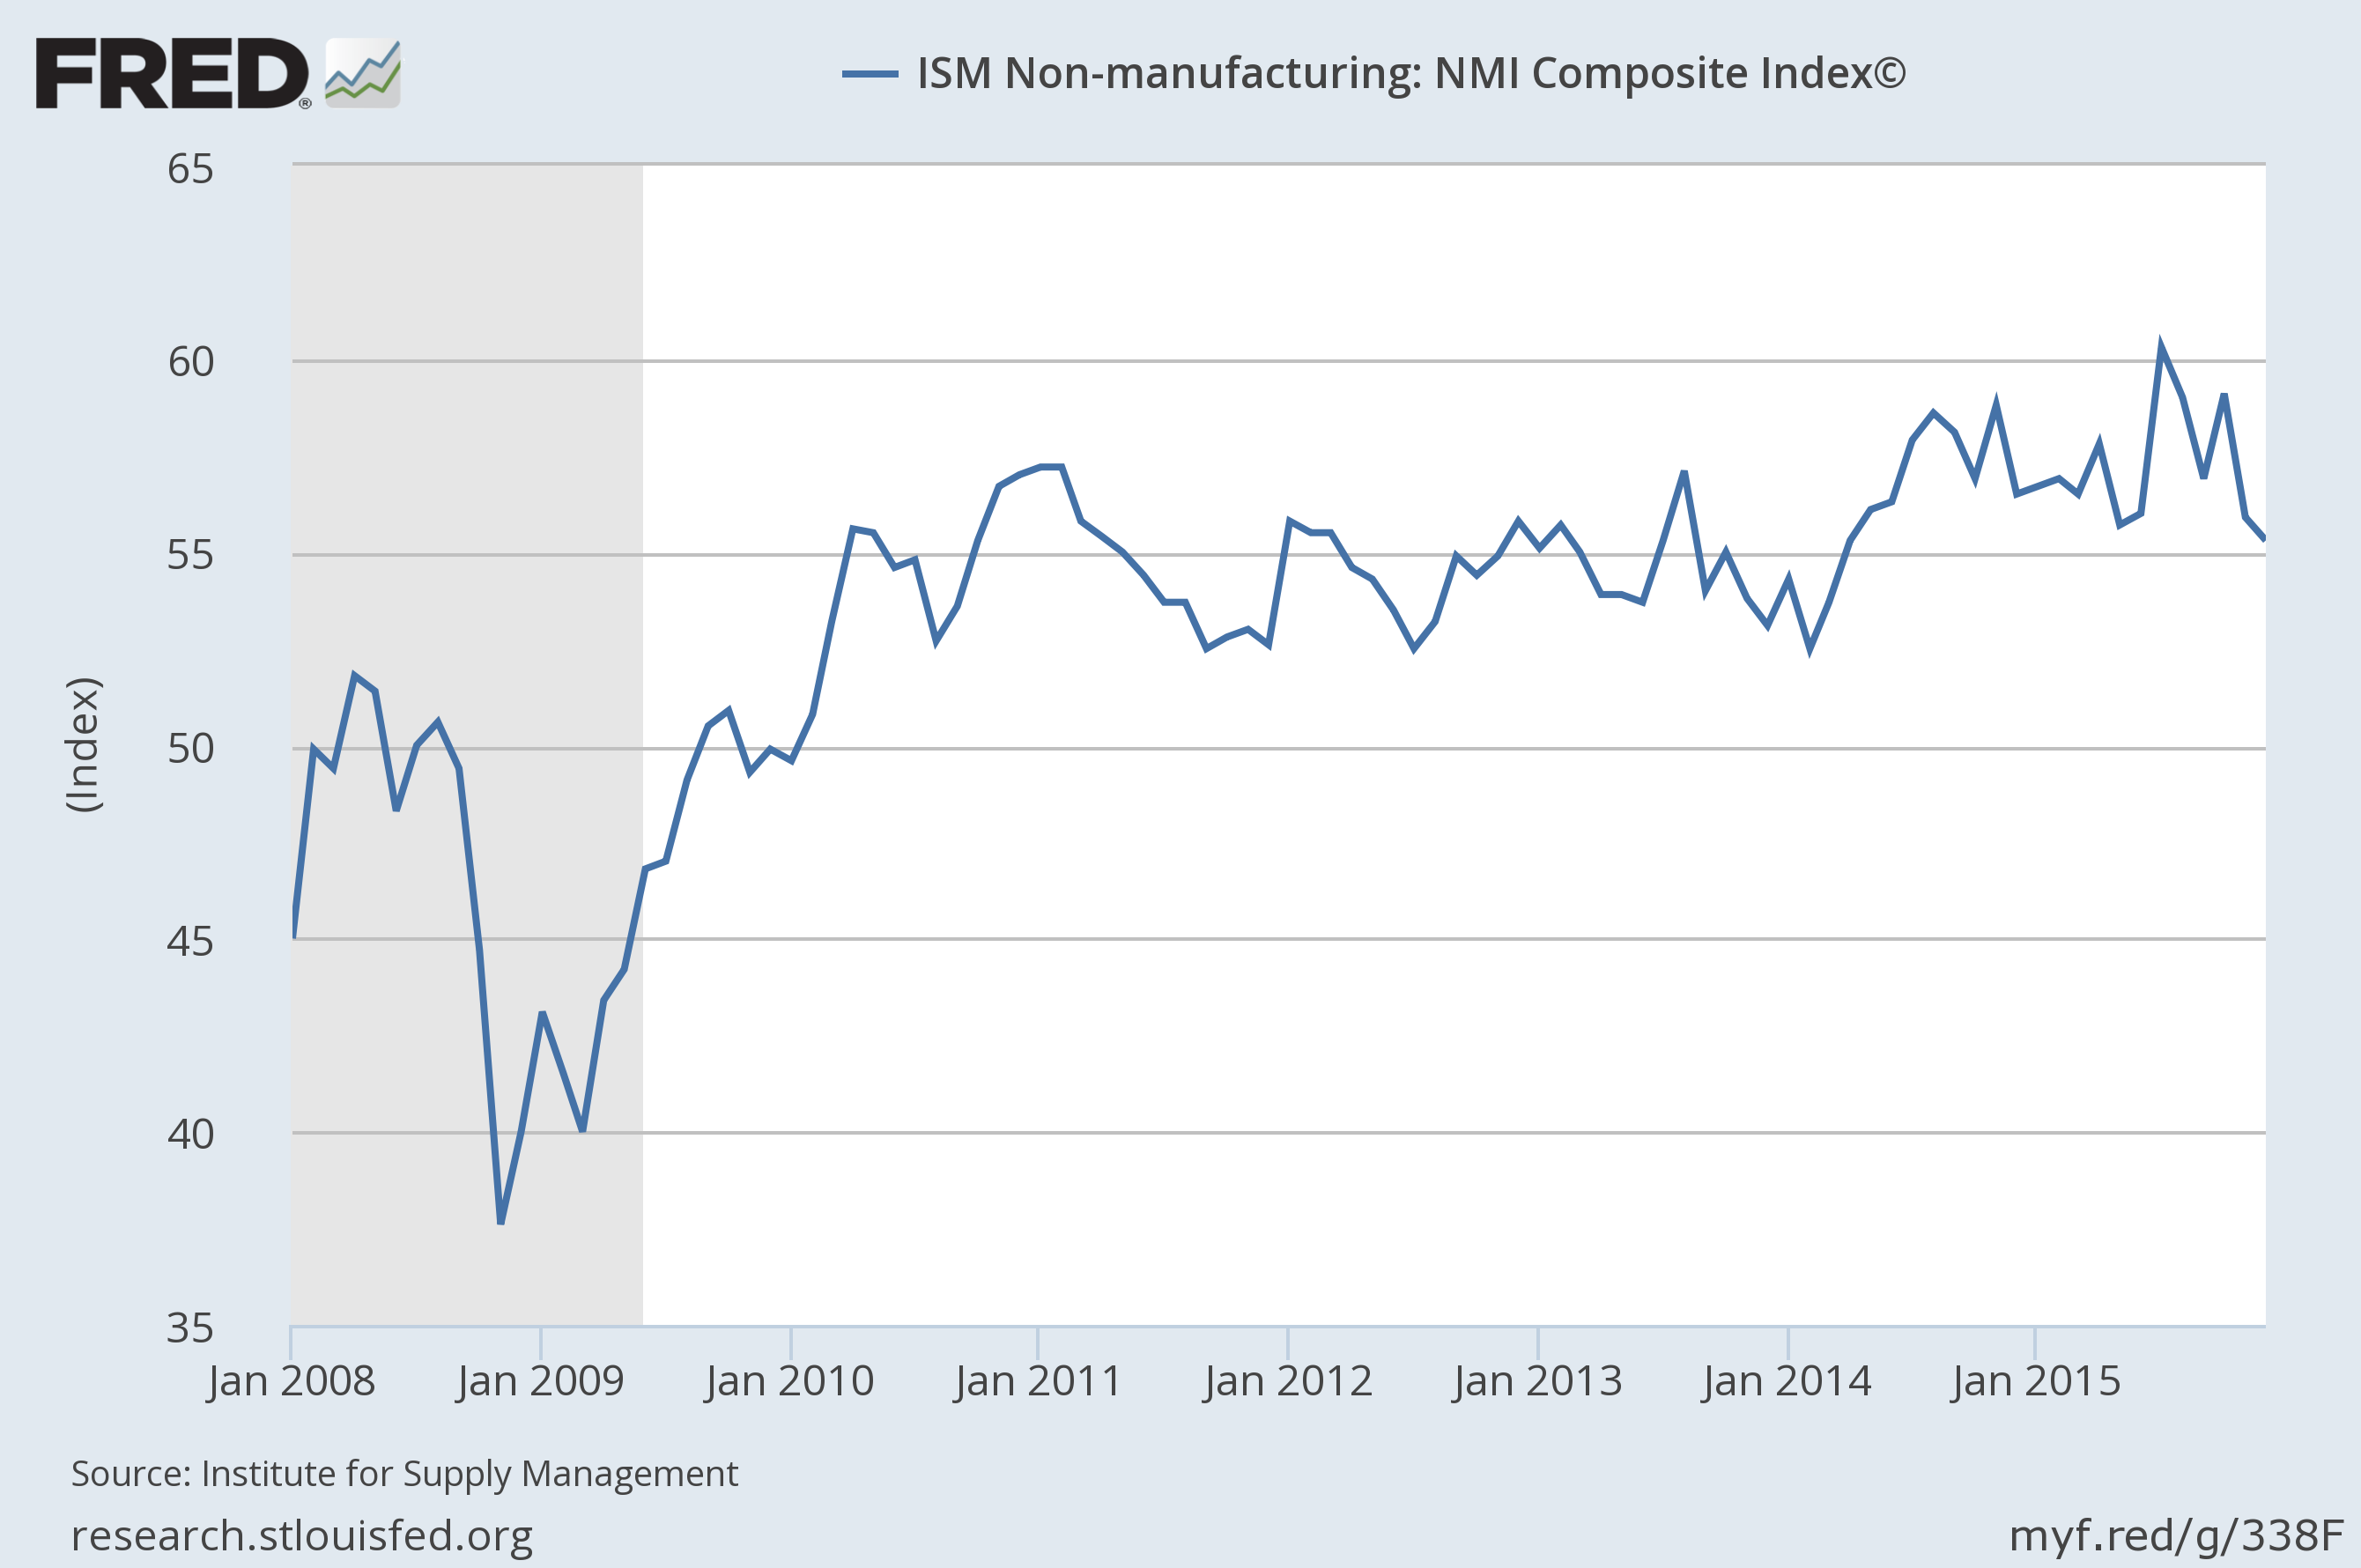
Source: FRED.
To summarize, the U.S. is unquestionably facing some headwinds from slow economic growth elsewhere in the world. But so far none of the indicators are consistent with the conclusion that we’ve already entered a recession.
And which of these indicators are leading and which are lagging? Downturns in production, shipping, and consumption and increases in inventory would tend to happen before the job cuts, and accelerate after. Destruction of demand will lead to further destruction of demand. Which way do you think that the “revisions” of the key indicators will go?
That’s right, there is no recession now. But there are strong signs of deceleration, while in rest of the world the signs are more worryingly. In any case, I think that the decisive factor is in financial “stability, or instability. That is the question”. Macro analysts must include financial sector if they will reach predictive result. It is a lot more difficult, but… As Larry Summers says , macro predictive model have a sadly record of wrong result. One reason: financial.
(Please take this one!) sorry
The conclusion of this post is certainly correct. We are not yet in recession. But the analysis itself is somewhat rickety. One must look carefully at the graphs at the precise leading edge of recessions. Leamer’s unemployment change is well nigh worthless. Usually, his 0.8 threshold is not touched until many months into recession. Far better is the percentage point increase off the cycle low. The unemployment rate has risen from cycle low to first month of recession 0.2 once, 0.3 once, and more all other recessions. Looked at this way, we are not in recession yet since unemployment is still on its low. The Leamer 6-month method is both arbitrary and far too delayed. Of course, establishment and household employment show no sign of recession as of December. The current 6-mo change in IP is clearly below where it was the leading month of some prior recessions. So Leamer’s threshold holds no water at all regarding IP. IP currently says the economy is in recession. In 2008, the manufacturing PMI had not even fallen below 50 when the recession began. It was a whopping 63.6 first month of 1975 recession! So on the basis of the PMI’s current 48.2, who knows what the case is today? I conclude that the precision of the methodology used here leaves something to be desired.
Yes an remember that those unemployment numbers from a historical perspective are not counted as they are now. We count – or rather estimate – on a much smaller scale. We should be looking at the daily tax revenue on employment that the Treasury keeps. If we were, you would see that we have been trending down the last 3 years after several years of zero growth, that following the last depression of 2009 where were negative as well. No employer pays taxes for phantom employees or theoretical or estimated employees.
If it was a normal recovery, the output gap would’ve closed in 2010 or 2011 and then normal growth could’ve been sustained. It seems, we added anti-growth policies to pro-growth policies, similar to putting one foot on the brake and the other foot on the accelerator, resulting in an expensive “recovery.”
UCLA Anderson Forecast: U.S. economy falls short of true recovery
June 05, 2013
“U.S. real GDP is now 15.4 percent below the normal 3 percent trend. To get back to that 3 percent trend, we would need 4 percent growth for 15 years, 5 percent growth for eight years, or 6 percent growth for five years, not the disappointing twos and threes we have been racking up recently, which are moving us farther from trend, not closer to it. It’s not a recovery. It’s not even normal growth. It’s bad.”
“If it was a normal recovery, the output gap would’ve closed in 2010 or 2011 and then normal growth could’ve been sustained. ”
what makes you think a “normal” recovery should have occurred. this was not a reagan recession, driven by the fed raising rates. the cause of the recession/depression is important in defining what the “normal” recovery should be like. you need to compare the recovery to similar historical events. last one with similar characteristics was the great depression-and we have recovered better than that event. you are trying to compare apples to oranges, and intentionally, to support a misleading conclusion.
Normally, a severe recession is followed by a strong recovery. And, normally, a mild recession doesn’t need a strong recovery to get back on track. I guess, you believe a weak “recovery” after a severe recession is normal.
A long-term chart of per capita real GDP growth:
http://www.advisorperspectives.com/dshort/charts/indicators/GDP-per-capita-overview.html?GDP-per-capita-since-1960-with-regression.gif
does the cause of the recession have anything to do with how the economy responds? and a long term chart should include the great depression.
“Normally, a severe recession is followed by a strong recovery.”
that is a fine statement, especially when referring to the typical fed induced recession resulting from increased interest rates to slow a overheating economy. were those the conditions prior to the great recession? was this recession caused by increasing interest rates to slow the economy? or were there other, even more important, factors at play? your application of “normal” under the circumstances of the great recession are inaccurate. two major financial events stand out in the last 100 years, the great depression and the great recession. your “normal” recession and recovery behavior apply to neither of those events.
In the Great Depression, monetary policy was constrained by the gold standard and fiscal policy was less developed, including “automatic stabilizers.” In the 1970s, a depression was avoided by creating inflationary growth. Monetary and fiscal policies had a positive impact on this recovery.
I cited some of the many factors before that weighed on this recovery. To a large extent, this is a policy-induced depression, not a long-wave bust, like the 1930s, 1970s, and when the last of the Baby-Boomers reach 65 in 2029.
“To a large extent, this is a policy-induced depression, ”
really? this was caused by a financial industry which generated an over leveraged debt situation on assets which lost value. this was not a policy induced depression-unless you consider the deregulation of the financial industry a policy failure, which i do. the recovery was to an extent a policy failure-we were unable to get congress to commit to an appropriate fiscal response to the loss in aggregate demand-remember monetary policy response was limited by the zero lower bound. you seem to want to recharacterize the problems of the great recession so that they can match a preconceived set of solutions. stick to the reality of the past decade-it needs no additional fabrications. the great recession has much more in common with the 1930’s than it did the 1970’s.
as i mentioned previously, the bush era was characterized by tax cuts for the wealthy and deregulation. the outcome was the great recession. you really want to repeat those policies?
Baffling, you still want to blame the effects, not the causes, regardless of all the evidence I’ve shown you before. So, why keep going around in circles?
cause: financial industry creates an over leveraged balance sheet, on both consumers and financial business alike, which collapsed once assets backing the financial tools lost value.
effect: collapse of the financial sector producing significant loss of aggregate demand. balance sheet imbalances keep expansion from occurring. hence a recession/depression. this was not a business cycle recession.
you have different cause/effects?
Nice try ignoring causes. If you spend all your money and go broke, for example, that doesn’t explain why you needed to spend all your money. I’ve shown you root causes before. You’ve dismissed them, because you want to blame your usual suspects – the rich, the banks, Corporate America, Wall Street, Bush and the Republicans, etc..
peak, apparently you do not understand what happened to the financial system leading up to and resulting in its collapse. or you are in denial. you do not believe an overleveraged financial and consumer sector was the cause of our troubles when asset values began to decline?
when was the last time unemployment was at 5% and the LFPR was were it is now? Is this time different?
It hasn’t been a normal “recovery.”
We had a sharp, sudden, and sustained downshift in economic growth, even with quantitative easings and deficit spending.
The economy is still on life support, while we continue to live beyond our means, adding trillions of dollars in federal debt.
What is the cumulative loss of the output gap? It’s a lot of lost income and tax revenue.
And, we’re in a weak position to deal with the next recession.
“We had a sharp, sudden, and sustained downshift in economic growth”
what was the root cause of such an event?
Actually, there are two events – The deep recession and the shallow recovery.
It would be cheaper to remove and reduce anti-growth policies (rather than adding more) than adding more pro-growth policies, to spur economic growth.
peak, we have been over this before. your anti-growth policy argument is an ideological remark with no basis in reality.
we have had record corporate profits. unfortunately, that money was not reintroduced back into the real economy. that is the problem. apparently decreased taxes on the higher earners does not produce growth in the real economy. and your response is to lower those taxes even more?
At what point can we declare Janet Yellen the worst Fed chair since Paul Volcker? This has been a very weak recovery. The Fed has been below even their mediocre 2% inflation target for seven years. And she says now is the time to raise interest rates. She has signaled that this is as good as it gets. Barely 2.2% growth is all we can expect before putting the boot on the neck of wage earners.
It is strange that so many people considered Yellen to be an inflation dove before her nomination, given that she was the one screaming the loudest in the 1990s to press Greenspan to increase interest rates. Fortunately Greenspan ignored her, providing the only brief period in the last three decades of real wage growth, perhaps the only meritorious act of his otherwise disastrous career. I’m surprised that people didn’t notice that Yellen was even more hawkish than Greenspan.
What I mean is in http://www.miguelnavascues.com/2016/01/acotando-riesgos.html, where I recommend you the first graph. The financial indicators are worsening notably since the fed rise the interest rate. In the present international context I think that they are more important that real indicators. I’m afraid that the FED will must interrupt its pace of increase with the risk of getting out of ammunition.
Professor Hamilton,
Using your EViews Markov GNP example as a guide (http://www.eviews.com/EViews8/ev8ecswitch_n.html) , a Markov switching model of quarterly GDP growth from 1967q2 to 2015 q4 seems to line-up well with your Econbrowser recession indicator. Can you help to enlighten amateurs like me? Thanks
AS: The main difference is that the series I’ve plotted above is based strictly on real-time data– only data as it was reported at the indicated date (not as it was eventually subsequently revised) was used to construct each and every point on the graph. There may also be some slight differences in how the initial date 0 probabilities are handled.
Thanks. Are there any “paint by the number” steps that would help one duplicate your forecast series? I read your basic description, but am not sure about how to try to duplicate your results (for fun). Or are the steps too complicated for most to follow or are the steps proprietary?
AS: To duplicate the entire series you would have to download a separate real-time database for the history of observations for every historical date. That’s not proprietary (the historical real-time series can be obtained from ALFRED) but it would be a pain. A simple thing though is you can take the current historical database through the just-announced 2015:Q4 numbers and calculate the smoothed probability that S_2015:Q3 = 2 and you should get 10.0%.
Thanks. Is this using Markov switching?
Using 1967q4 to 2015q4 data and computing: 100*dlog(rgdp), I find a 5% probability for 2015:Q3, using Markov switching; so I must not have all the input terms correct.
AS: No, you want to use data from 1947:Q1 through 2015:Q4 to estimate the value for 2015:Q3.
The 10% probability seems elusive. I find a 16% probability with a lower regime of -0.283 and an upper regime of 1.014. I used a random seed of 100,000. Seems very difficult to find the correct solution, even though the heavy lifting is done by the program and if I understand properly, your coding. Are user specifications needed on the input options page? I used no AR terms although an AR(1) seemed to “fix” the autocorrelation of the residuals, but created an inferior output estimate compared to recession bars.
AS: It sounds like you’re looking at the probability for 2015:Q4, which is indeed 16%. 10% is the probability for 2015:Q3. I never report the current quarter (in this case, 2015:Q4) because given data revisions and limitations of the algorithm the current-quarter inference hasn’t been that reliable historically. Every point on the graph displayed is a real-time one-quarter-lagged-smoothed inference.
As for the EVIEWS code, I have never used it so cannot speak to how its options work.
Thanks. Yes, I was looking at 2015 Q4. I see the 10% for 2015 Q3. Now I understand what you have been saying about a “real-time-quarter-one-quarter-lagged-smoothed” (sorry to be dense). Also, sorry I misunderstood about EViews. I thought I read that EViews based its Markov switching program upon your work, and I thought upon your code.
MMMMM??? I wonder if Mr Market is anticipating the upcoming Trump or Cruz presidency?
Hillary may have to out do Sanders:
“Sanders is resonating among angry voters by focusing on income inequality, and promising to deliver universal health care and free college education.
Meghan Metier, 22, of Iowa City said the Affordable Care Act – President Barack Obama’s signature healthcare reform – has allowed some of her friends to access Medicaid. But to keep it, she added, they have to be certain their income doesn’t exceed the poverty level, so they stay barely employed.”
http://mobile.reuters.com/article/idUSKCN0V80W6?feedType=RSS&feedName=topNews
We are not in a full recession – we are in a sector recession. This is really the best kind. The sectors under pressure will clean out the weak players and processes. The people and resources cleared from that batch can be used well by the other sectors. Much nicer then a full economy recession.
My latest in the UAE’s National: OPEC needs to cut production. My analysis of the situation.
http://www.thenational.ae/business/energy/steven-kopits-why-opec-needs-to-cut-its-production-levels#full
While you’re at it, why not editorialize that cats need to walk in orderly straight lines.
If you look at the year-over-year change in real final sales in expansion periods of the post-WW II period, it’s very clear that something is going wrong with the US economy, as the average increases of economic expansions is getting progressively weaker over time.
The last really robust recovery was in 1983-1989, when the average quarterly year-over-year increase in real final sales was +4.2%. Since then, the U.S. has posted recoveries averaging +3.5% real final sales gains in 1991-2000, and +2.6% in 2002-2007 and now +1.8% in the current expansion 2010-present.
The Austrians have a good explanation for the steadily decelerating growth; conventional modern economists, not so much.
Real Sales
Expansion Periods Real Final Sales
mean % change
1950-1953 6.23
1955-1957 3.66
1959-1960 4.89
1961-1969 4.77
1971-1973 4.40
1975-1979 3.96
1980-1981 1.50
1983-1989 4.18
1991-2000 3.48
2002-2007 2.59
2010-2015 1.83
Average 3.77
You need to take into account population growth, which slowed substantially, and increasingly larger trade deficits, which subtract from domestic growth.
We had an economic boom in 1982-00 with a steeper rise in living, labor (or workplace), and environmental standards and an expansion in 2001-07 on top of the boom and mild recession in 2001.
The U.S. not only leads the world in the Information and Biotech Revolutions, it leads the rest of the world combined (in both revenue and profit).
For example, U.S. annualized population growth from 1946-70 was 1.56%. From 1982-07, it was 1.05%.
U.S. annualized per capita real GDP growth from 1946-70 was 2.13%. From 1982-07, it was 2.30%.
However, U.S. trade deficits reach 6% of GDP in the mid-2000s.
We have been flirting with deflation since Janet Yellen became the FED Chair. This year the dollar rose to where the price of gold has been consistently below the 10 year average. This has driven down the price of oil in the US but all around the world we are seeing a significant fall in commodity prices. Nigeria is issuing warnings that their foreign reserves are falling to serious levels due to falling exports of commodities.
China is drawing down its foreign reserves and is suffering due to its export economy. We are seeing the fallacy of common monetary theory that a weak currency increases exports refuted real time in the real world.
Profits are also being squeezed. As Anarchus reports above, sales have fallen significantly as deflation continues but fixed prices and wages are not following the fall in sales. Falling profits will lead to increasing bankruptcies and unemployment.
Current measures of recession are woefully inadequate because they do not report the decline until months even years after the decline has started. The world economy is in trouble right now, but the economic prognosticators are still seeing good news. By the time the decline is seen it will be too late and many will be seriously hurt.
Conventional economics understates the significance of demographics.
For instance, in June 2002 the Board of Governors of the Federal Reserve System took deflation in Japan seriously enough to sponsor an International Finance Discussion Paper Number 729, “Preventing Deflation: Lessons from Japan’s Experience in the 1990s”.
It didn’t mention “demographics” a single time, and while the aging of the population comes up a couple of times, it’s predominantly viewed as an influence on Japanese government policy rather than as a critical variable driving demand: “Second, partially due to concerns about the effect of an aging population on future budgets, the authorities initially were extremely reluctant to undertake any measures that could have become embedded on a sustained basis in future budgets.”
You can read the whole thing here:
http://www.federalreserve.gov/pubs/ifdp/2002/729/ifdp729.pdf
Debt levels are far more important than trade deficits, because globally, trade deficits net to zero. To the extent trade is important to global growth, it’s the absolute value or gross trade that matters . . . . . ..
If I take an Austrian view, it’s not clear to me why the US would enter a recession now. As I think of business cycles, recessions occur because liquidity increases faster than the stock of fixed assets, thereby driving up the value of those assets, in turn prompting an expansion of fixed asset production and productive capacity. Because of the order-to-delivery lag in fixed assets, asset stocks continue to rise even after the order book should in principle have fulfilled market needs. Thus, much of the increase in fixed assets arrives after the peak of demand, thereby tanking asset prices and leading to a reduction in fixed asset productive capacity–hence a recession.
If I apply this metric to the US, I don’t really see fixed assets–beyond the stock market–much in excess of stable values. Unemployment is low (formally), but wage pressure is muted. Inflation is low. Housing stock growth is below normal and inventories are tight. Interest rates are low. Oil prices are low. The federal deficit is manageable. I don’t really see that this point which imbalance we are trying to correct.
By contrast, if I take a Keynesian view, the a recession could be like a cold, something which just comes on unexpectedly without any role in rebalancing the economy. I don’t really understand this view, as it suggests that the population has somehow lost the will to live and prosper. However, it would allow for the possibility of a recession with any objective cause, other than some woolly notion of a ‘lack of aggregate demand’, whatever that is.
I do think, however, the time has come to ponder whether China has become big enough to put the US into a recession. Is the US now a small open economy by comparison? In terms of incremental demand growth, very possibly. Clearly, China is now large enough to be able to move the DOW by 1,000 points and oil prices by something like $50 / barrel, if I believe Jim’s ICE model. If China has the capacity to move markets so materially, can we discount the possibility that China can move the global–and specifically, US–economy as well?
…without any objective cause…
Steven Kopits,
You are correct about Austrian economics if it is Rothbard economics. Mises is different. He looks at both inflation (a decrease in monetary value/increase in asset value) and deflation (an increase in monetary value/decrease in asset value) as both hampering the market and pulling down the economy.
Few understand inflation/deflation because they think in terms of prices changes. If you understand it is a change in the purchasing power of money you can more easily see that deflation causes fixed assets and earlier commodity/raw material purchases to be over valued over time while current sales are stated in current higher valued dollars. This causes a dislocation of cost versus revenue and lower profits.
It monetary policy is analyzed separate from assets it is meaningless. Sadly, this is the common method of analyzing monetary policy, Sudoku economics.
The US is not in a recession now, it’s on the edge of a recession now.
Real GDP growth in Q4 came in at +0.7%; and economic authorities such as Dr. Martin Feldstein want the FOMC to keep raising rates. And he said this, to MarketWatch, on January 27th:
“Feldstein: I’m not. We’ve had a weak [fourth] quarter, basically we had a very weak October. We don’t have December numbers yet. If you look at the various forecasts that you and I probably both look at, for the first quarter, there are numbers in the 2.5% range for real GDP, so I don’t see any serious problem.”
Well, I put more faith in the Atlanta Fed GDPNow model than the consensus forecast, and here’s where the Atlanta Fed is for 1Q 2016:
The initial GDPNow model forecast for real GDP growth (seasonally adjusted annual rate) in the first quarter of 2016 is 1.2 percent on February 1. The final model nowcast for fourth-quarter real GDP growth was 1.0 percent, 0.3 percentage points above the advance estimate of 0.7 percent released last Friday by the U.S. Bureau of Economic Analysis.
http://tinyurl.com/zb8p7rl
History and experience and theory all suggest that Fed rate hikes impact the real economy with an indeterminate time lag of something like 3-12 months.
The recession begins in August 2016. Not now.
In the US, the soft version of the Austrian view would be that ZIRP and yield-hog investors fueled a tight shale energy boom that continued far longer than economics justified. Billions of dollars of fresh capital (stocks and bonds) were raised by US energy companies with hugely negative cash flow in the spring of 2015 even as energy prices were down 50% year-over-year. THAT is gross malinvestment. Even as its business model – based in large part on continual equity offerings – Kinder Morgan (by then no longer an MLP at all) hit an all time high of $44+ dollars per share in the Spring of 2015 . . . . . . . . .
We’ve just seen the tip – the start – of the bad energy loans that are going to wreak havoc among the banks. That’s Austrian boom-bust credit cycle economics, pure and simple.
China has the same problem, only much larger. The amount of malinvesment – empty buildings, and EVEN empty cities – in China is far greater than anything in the US and they’re even more leveraged today than we are . . . . . . .
” The amount of malinvesment – empty buildings, and EVEN empty cities – in China is far greater than anything in the US and they’re even more leveraged today than we are . . . . . . .”
china also has longer term plans to move more and more rural folks into those urban environments. those “malinvestments” would certainly look bad from a us perspective. but they may not be quite the malinvestment you imagine in the long run. this assumes their urban growth plans continue into the future. i am not sure most people in the us fully understand the transition to urbanization which has, and will continue, to occur in china.
I am not about to present myself as an expert on China.
I do have three adopted daughters from China and have spent a fair amount of time in the country.
At this time, this statement is open to question: “the transition to urbanization which has, and will continue, to occur in china.”
In 1993, China had a population of roughly 1.2 billion and about 28% was urban – or approximately 350 million people. Today, maybe 55% of the 1.3 billion population live in urban areas, or maybe 700 million people. That’s one of the largest migrations of people in the history of the world – because China is huge and the transition happened quickly.
There are a lot of reasons to expect that either the transition to urbanization is close to peaking (China is getting old quickly, and old people don’t urbanize the way that young people do) or else continuing at a much much slower pace in the future – because they’re now 55% urban and increases are going to slow.
Btw, a better explanation for the surplus of investment in residential real estate in China is probably the lack of savings opportunities in the country – anecdotal evidence suggests that much of the empty building boom has been for investment condominiums owned by individuals.
This article reads like one of the official denials you see in the news, when an issue has clearly become sufficiently concerning that official reassurances are required. Far too often those denials turn out to have been wrong, sometimes because those in official positions cannot see the reality through their information filters, and sometimes because the denials are straight out propaganda lies. But you know, anyone paying attention 8 years ago read many similar essays like the above in 2008, until everyone finally conceded that indeed a recession had hit.
The only rigorously correct answer to “Is the U.S. in Recession Now?” is “we don’t know”. We don’t have all the data. The preliminary data that we do have is concerning, but it’s also not final. The inevitable updates and revisions could pull the last several quarters up or down by quite a bit for many of these series. What the NBER will eventually decide regarding our current “recession status” in six months or a few years is unknown at this point.
However, we can clearly see that the U.S. is certainly closer to recession now than it was a year ago. Several data series are in “only in recession” territory while others (sub-1% GDP) are close enough given the potential range of revisions. Given this weakness in the data, particularly the widespread weakness in manufacturing, policymakers ought to be on “Recession Watch”, and taking appropriate measures.
It’s a bit like a patient who goes to see the doctor. The patient clearly has a couple of “sectors in recession” — runny nose, cough, sniffles — but the patient isn’t running a fever yet or vomiting. “Am I sick?” the patient asks… A good doctor wouldn’t say “you’re not sick”… he would say “We can’t tell if you’re sick for a few more days, but just to be safe you should get extra rest and drink plenty of fluids to help ensure that your condition doesn’t get worse!”
It’s disappointing to see the “economic doctors” publishing denials rather than discussing appropriate measures for the current situation.
Of course, it would be even more disappointing to see them prescribing another round of “cures” that don’t actually fix the disease…
Employment started falling in December 2007, and this date was subsequently adopted as the beginning of the recession in the US. At this point, employment is not falling in the US.
It seems interesting that Personal Income (PI) and Personal Consumption Expenditures (PCE) seem to be both white noise series from 2009 to 2015. Any significance beyond the mentioned observation to the white noise for both?
German jobless rate hits record low in post -reunification era.
Not recessionary.
http://www.bloomberg.com/news/articles/2016-02-02/german-unemployment-rate-falls-to-record-low-as-job-market-booms
Steve Adams has it right. There are particular sectors in recession, especially goods exports, but the US economy is too insular to be tipped into recession by the current level of weakness in global demand. There would have to be a bigger dive in global markets. And it would be the first time in a very long time that the US was dragged into recession by weak exports.
But weak non-residential construction and drawing down of inventories definitely aren’t good signs. Businesses seem to be positioning more for the possibility of recession.