The Wisconsin Budget Project concludes “Costly Tax Credit has Done Little to Boost [manufacturing] Employment”.
From the study:
The Manufacturing and Agriculture Credit, which lawmakers passed in 2011, nearly wipes out income taxes for manufacturers and agricultural producers — at a very steep price.
…
Tax filers with incomes of $1 million and higher, who made up just 0.2% of filers, receive an estimated 78% of the 2016 tax cut that is distributed through the individual income tax.
Not only does the tax credit benefit primarily high income individuals, it has been pretty ineffective at boosting employment. The Wisconsin Budget Project does essentially a diffs-in-diffs test.
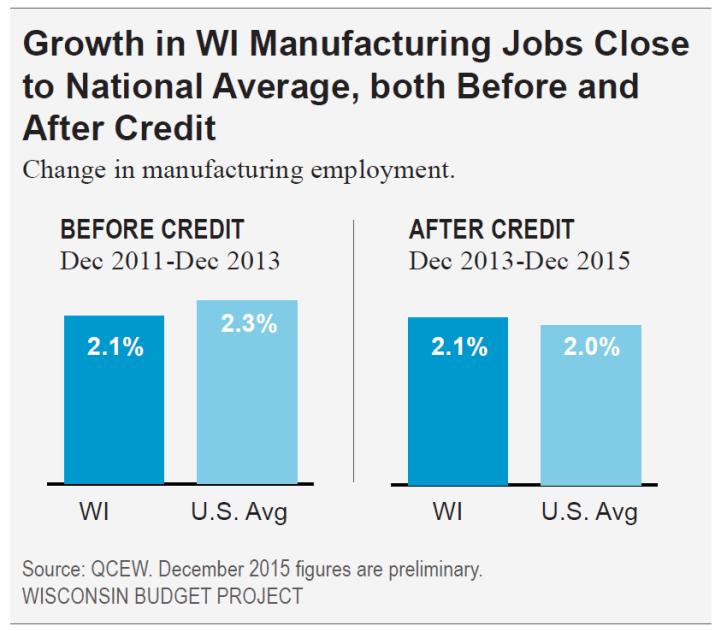
Source: Tamarine Cornelius, “The Big Giveaway Costly Tax Credit has Done Little to Boost Employment,” Wisconsin Budget Project, June 28, 2016. Note: Uses QCEW data through December 2015.
In other words, despite the generous terms of the tax credit, Wisconsin employment does not seem to have exhibited any different behavior from the national counterpart. (A similar conclusion holds for manufacturing vs. nonmanufacturing.)
A time series approach can yield additional insights. I check whether the relationship between national and Wisconsin manufacturing employment from 1990M04-2013M12 predicts well the 2014-16 evolution of manufacturing employment, using an error correction model.
(1) Δn_mfgWIt = –0.001 – 0.013n_mfgWIt-1 + 0.009 yUSt-1 + 0.759Δn_mfgUSt + 0.250Δn_mfgUSt-1 -0.015 Δn_mfgWIt-1 + 0.083 Δn_mfgWIt-2 + ut
Adj-R2 = 0.66, SER = 0.0026, N =285, DW = 2.03, Breusch-Godfrey Serial Correlation LM Test = 1.26 [p-value = 0.28]. Bold face denotes statistical significance at 10% msl, using HAC robust standard errors. n_mfg denotes log manufacturing employment.
The model fits the data fairly well, and implies a long run elasticity of Wisconsin manufacturing employment to national of about 0.67.
Using this model, I dynamically simulate out-of-sample using actually realized values of national manufacturing employment (i.e., I conduct an ex post simulation). The results are illustrated in Figure 1.
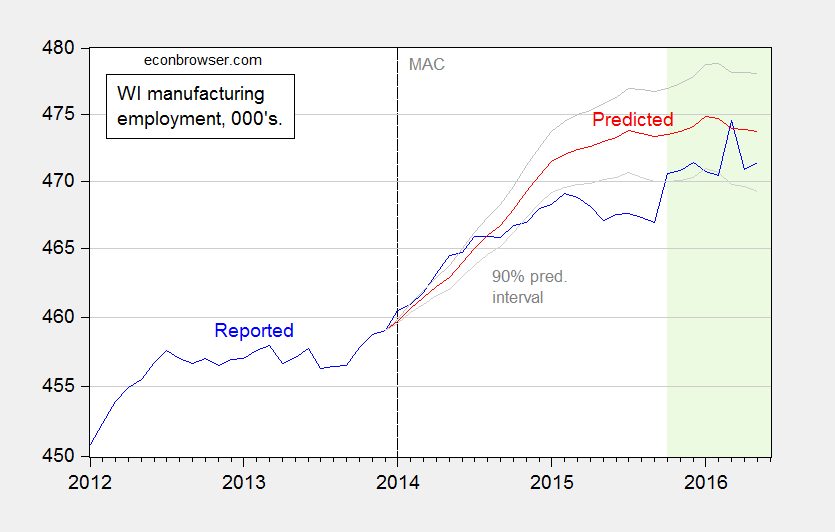
Figure 1: Reported manufacturing employment in Wisconsin (blue), predicted from model (1) (red), and 90% prediction interval (gray lines). Dashed line at implementation of the Manufacturing and Agriculture Credit (MAC); Light green shading indicates CES employment data that has not yet been benchmarked. Source: BLS and author’s calculations.
For a large portion of the time when the tax credit is increasingly in effect (it was phased in gradually), Wisconsin manufacturing employment was below what is predicted (and statistically significantly so). It’s of interest to note that when Wisconsin employment rises to within the 90% prediction interval, it is data that has not been benchmarked to incorporated the most recent Quarterly Census of Employment and Wages (QCEW) data. These data are likely to be measurably revised at the next benchmark date.
Regardless, employment in Wisconsin does not seem to have responded in the manner predicted by the proponents of the tax credit.
Update, 7/10 7:15am Pacific: Here is WMC’s “critique” of the Wisconsin Budget Project report.
I wish Menzie much success in journal submissions. Maybe that way he can land a job offer at a more prestigious institution, leave Wisconson-Madison, and post about something other than the economy of a flyover state.
rtd: I can write about Washington State, and how the economy under a Democratic Governor and legislature seems to outperform Wisconsin, if you like.
When you’ve finished writing about Washington State, you can write about California. Now with a Democratic Governor and legislature they were able to turn a huge deficit into a surplus.
Importing lots of Bill Gates-types helps.
How about some writing on Democrat mayors and city councils?
Writing about an economy (or maybe even Wisconsin’s) I would like. However, we know through one helluva dataset of blog posts and comments (such as the very comment I am replying to), the marginal likelihood of such analyses being void of blatant partisanship and subjectiveness is vanishingly small. So, in response to your comment: no, I would not like. Thanks for considering my desires & best of luck on those journal articles!
I don’t know why you think I need to publish more. I’ve got plenty published, so that’s not really a concern. Plus those publications have mumerous citations.
Wait. Where exactly did I say “more”?
It’s implied if you write “I wish Menzie much success in journal submissions.” The logical implication is that I have not had success thus far. Otherwise, you would have inserted “continued” before “success”.
Haha, geez, that approach worked even sooner than I imagined.
How you assume what’s implied, correlated, relevant, etc… is part of my point.
Also, “success” is highly subjective…. a concept you’re well versed in.
Seriously, if you think you’ve just illustrated some sort of deep concept, I feel sorry for you.
Where did I say “deep concept”? Where was that implied?
Thanks, again.
Given how improbable the actual employment appears if your error-correction model estimates represent reality, it seems one of the following must be true. Either:
1] Some important change you have not considered happened at around the same time the tax credit went into effect (or perhaps more suddenly, late in 2014).
2] Your model is much worse than its in-sample prediction indicates.
3] The tax credit actually caused a substantial slowdown in employment growth.
The first two possibilities rather undermine your point. Are you prepared to argue that the third is plausible?
For what it’s worth, my money is on #2, since it holds for the great majority of econometric models.
Michael: Thanks for the comments. Nice to have some reasonable econometric insights.
1. There’s always the possibility of omitted variables that shift in a systematic way at just the same time as the new administration comes in. I tried to account for weather formally, as well as agricultural prices (in another post), and aircraft (non-econometrically). If you have some thoughts on another possible Variable X, I would welcome them.
2. Sure, we have known for a long time about data-mining, and the impact on R-squared. But the regression results are fairly straightforwardly obtained here — try it yourself! No exotic manufactured variables, no fancy econometrics, just a simple parsimonious ECM.
3. I don’t think it’s the tax credit per se that caused the slowdown. I think it’s probably tax credits (i.e. tax expenditures) that constrain government spending elsewhere that leads to the slowdown. Also, economic policy uncertainty at the state level (going back to point 1 — unfortunately we do not have a Wisconsin level counterpart to the Baker, Bloom and Davis variable).
Menzie’s assertion that these incentives have not worked is in line with analyses done in other states.
In Michigan:
http://www.michigancapitolconfidential.com/22558
http://www.michigancapitolconfidential.com/19300
The problem is that the government is not very adept at predicting market trends or winners. It just tends to get mesmerized by flashy PR.
The one exception seems to be the Michigan Technology Tri-Corridor which has brought together academia, industry, and the state government to focus on the development and application of new technologies in many areas. This has been particularly successful in the automotive and medical industries which are bedrock industries for the state.
Wisconsin needs to identify what industries could be leveraged from a similar arrangement. Scatter gun approaches are not effective.