The Philadelphia Fed’s indices indicate economic contraction in June and July. Leading indices indicate further contraction, by a percentage larger than any other state.
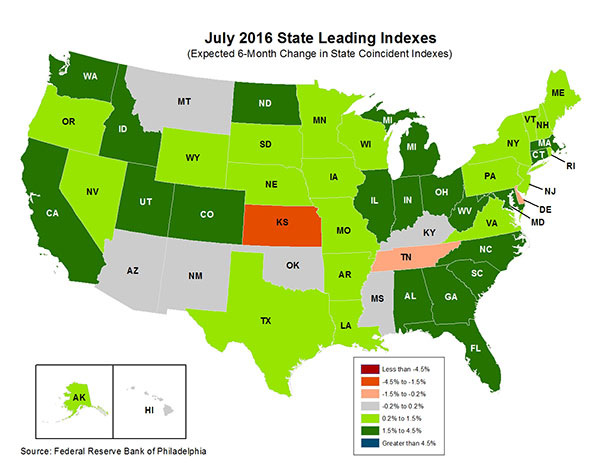
Source: Philadelphia Fed.
A time series plot reveals the full extent of the ongoing and forecasted contraction. For comparison, the index for Kansas’s neighbor Missouri is also included.
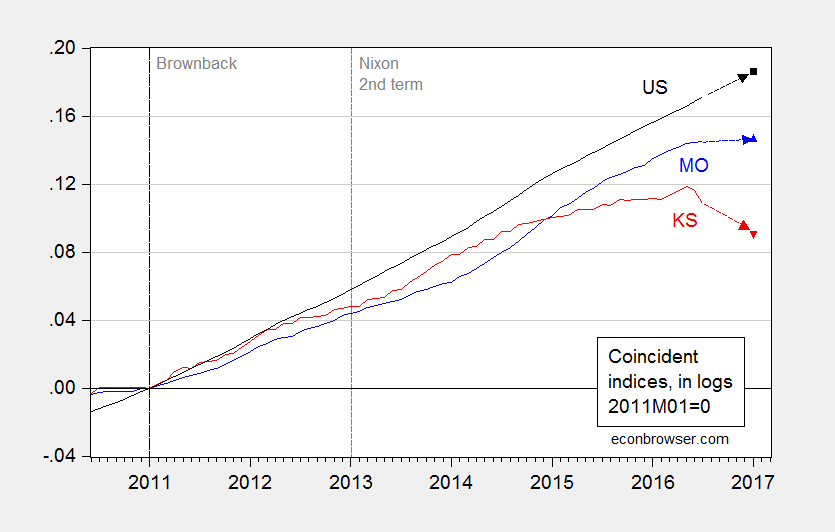
Figure 1: Log coincident index for Missouri (blue), Kansas (red), and US (black), all normalized to 2011M01=0. 2017M01 values are implied levels from leading indices. Source: Philadelphia Fed leading, coincident, and author’s calculations.
Some observers have argued that the Philadelphia Fed’s coincident index severely mismeasures Kansas output (for contradicting information, see this Philadelphia Fed document). As of 2016Q1, cumulative Kansas GDP growth from 2011Q1 is 2.1% lower than Missouri; the corresponding figure for the coincident indices is 2.6% (2016Q1 is the latest date for which we have both state level GDP and coincident index data.)
Addition, 8:30PM Pacific: To see how dramatically the Kansas outlook has deteriorated, consult Figure 2, which displays the June and July vintages of the indices. As of June, sideways trending was forecasted. Output fell in July, and forecasted growth fell even more dramatically.
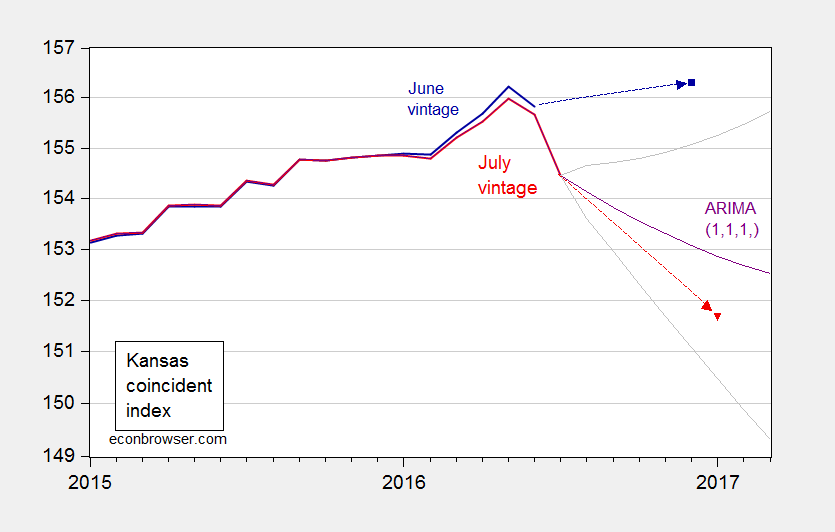
Figure 2: Kansas coincident index, June vintage (dark blue) and July vintage (red); December 2016 and January 2017 values are implied by leading indices. Purple line is forecast from ARIMA(1,1,1) estimated on log index over 1996M01-2016M07 period; gray lines for 90% prediction interval; all on log scale. Source: Philadelphia Fed and author’s calculations.
The Philadelphia Fed forecast is slightly worse than what is forecasted from a simple ARIMA(1,1,1).
Update, 9/15 5:25pm Pacific:
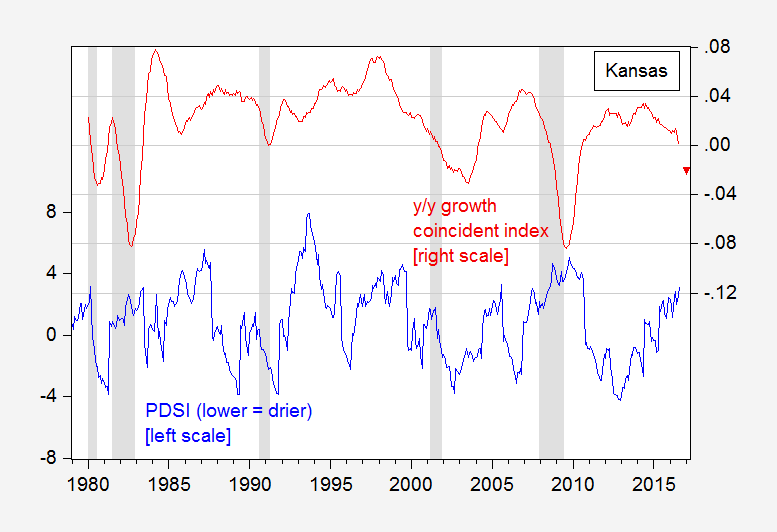
Figure 3: Palmer Drought Severity Index for Kansas (blue line, left scale), year-on-year growth of Kansas coincident index, calculated as 12 month change in logs (red, right scale). January 2017 observation is implied from leading index. NBER defined recession dates shaded gray. Source: NOAA, Philadelphia Fed (July release), NBER, and author’s calculations.
I’ve struggled to understand the relationship between the coincident indices and trends in employment. Kansas does have a negative change 1.3% in workforce since April and a drop of 1.5% in employment. Michigan has a 1.4% drop in workforce since April and a drop of 1.0% in employment… not quite as bad.
While both have negative demographic and employment trends, Kansas is showing a sharply negative change in coincident indices while Michigan is sharply positive. I’m speculating that this is due to a relatively minor role that manufacturing plays in Kansas and the major role in Michigan where the automotive industry is booming.
Can we expect the positions to be reversed when the next economic downturn occurs and Kansas is relatively insulated from the product demand downturn while Michigan tends to be a leading indicator of recessions because of the quick fall in automotive sales as people defer large purchase?
Bruce Hall: There is no reason why establishment employment and the coincident indices need match; see the description at the Philadelphia Fed coincident index website:
You are right that MI experiences larger cyclical movements due to its larger manufacturing share, but I would hasten to note that Kansas’s share is not altogether small; manufacturing value added accounts for 17.1% of private output as of 2016Q1, 18.5% the quarter Brownback took office.
Menzie, sorry for the near duplicate comments. I received an error message from your site saying the message wasn’t processed.
Bruce Hall: No problem, have removed earlier comment, so no duplication now.
Obviously Kansas’ poor performance is due to the continuing wet weather.
2slugbaits: Clearly. See Figure 3 added.
“the continuing wet weather”
As in, the governor is still a drip.