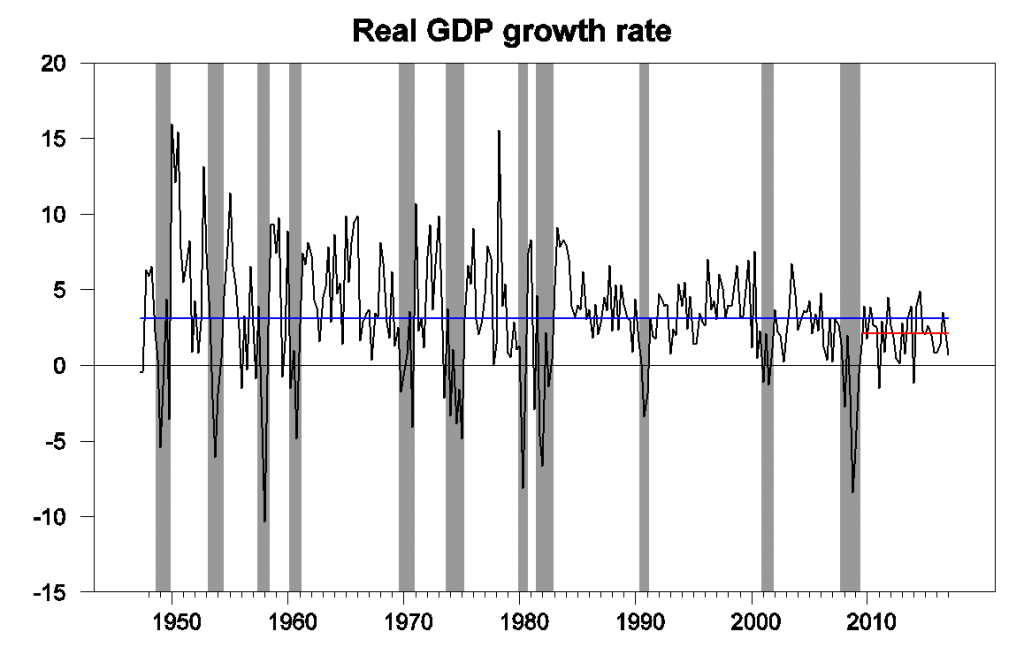
The Bureau of Economic Analysis announced today that U.S. real GDP grew at a 0.7% annual rate in the first quarter, weak even by the post-recession average annual growth rate of 2.1% and far below the U.S. historical average of 3.1%.

Real GDP growth at an annual rate, 1947:Q2-2017:Q1, with the 1947-2016 historical average (3.1%) in blue and post-Great-Recession average (2.1%) in red.
Nonetheless, this is consistent with another pattern we’ve seen in the recent data– the first-quarter numbers are often unusually weak. Since 2010, first-quarter real GDP growth averaged 1% at an annual rate, compared with 2.4% for the other three quarters. We get a smoother impression using year-over-year growth, which for 2017:Q1 came to 1.9%, close to the recent average.

Top panel: quarter-to-quarter real GDP growth, quoted at an annual rate, 2009:Q4 to 2017:Q1. Bottom panel: year-over-year real GDP growth.
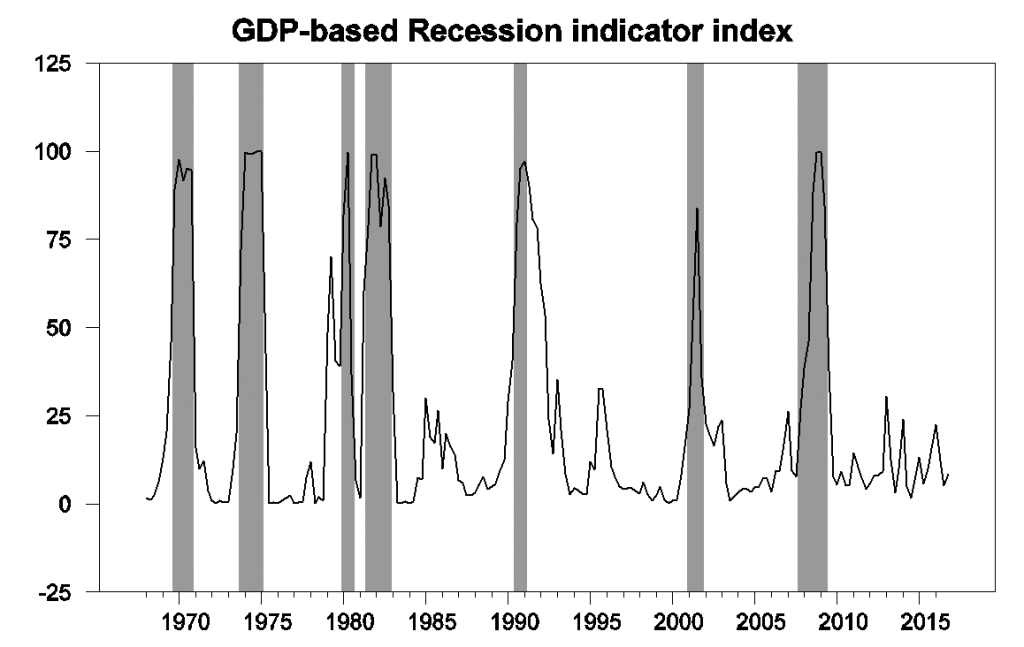
The new data caused only a slight bump up to 8.4% in our Econbrowser Recession Indicator Index. The index uses today’s release to form a picture of where the economy stood as of the end of 2016:Q4.

GDP-based recession indicator index. The plotted value for each date is based solely on information as it would have been publicly available and reported as of one quarter after the indicated date, with 2016:Q4 the last date shown on the graph. Shaded regions represent the NBER’s dates for recessions, which dates were not used in any way in constructing the index, and which were sometimes not reported until two years after the date.
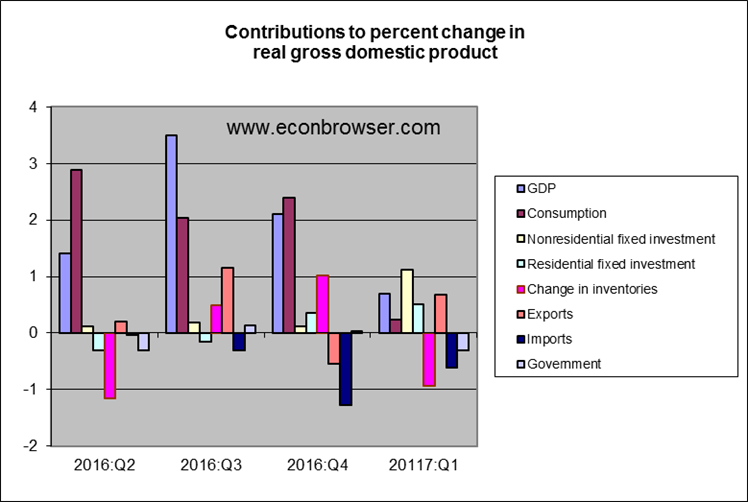
But a look at the individual components of GDP suggests that more is going on than the usual seasonal sluggishness. Consumption growth was very weak, and inventories were a significant drag. The latter component is particularly volatile and subject to revision.
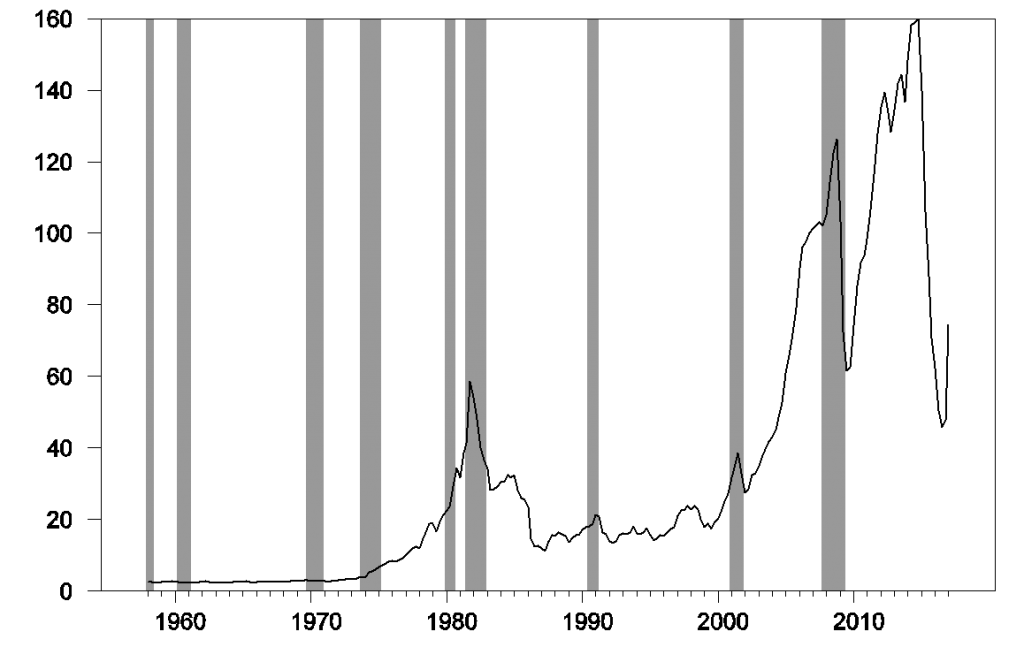
Residential fixed investment finally made the kind of positive contribution I’d been expecting. But an even bigger boost came from nonresidential fixed investment. One factor here is that oil-related investment is making a comeback with the price of oil back in the neighborhood of $50.

Nominal expenditures on private fixed nonresidential structures investment in mining exploration, shafts, and wells, in billions of dollars seasonally adjusted at an annual rate. Data surce: BEA Table 5.3.5..
Overall, this is consistent with the impression that while soft data such as sentiment surveys suggested that U.S. growth might be accelerating, support from hard data just doesn’t seem to be there so far. Even so, I do not see a reason to be overly alarmed by the first-quarter report.

Q1 per capita real GDP declines:
https://www.advisorperspectives.com/dshort/updates/2017/04/28/q1-real-gdp-per-capita-0-05-versus-the-0-7-headline-real-gdp
PCE was abysmal. Much worse than anything for the last six years.
I am not convinced this thing doesn’t roll over here.
Forgetting real GDP – distorted by sequential annualization and inventories – and looking at real final sales, year-over-year, it’s been a steady 2% for the past 7 quarters:
https://tinyurl.com/ln9dmhm
Add in the 1.7% PCE and you get nominal growth of 3.7%. When – WHEN? – has the FOMC ever raised rates when the nominal economy was growing at 3.7%. It makes NO SENSE.
Hey Fed, Core PCE Inflation is 1.7%
Dead flat for past 3 quarters. https://fred.stlouisfed.org/series/BPCCRO1Q156NBEA
Since 2008, Core PCE inflation has exceeded 2% exactly once in 1Q2012 when it hit 2.1% and then fell for the next 5 quarters. So NAIRU is nonsense as we all know.
NAIRU can’t be nonsense! It’s in ALL the textbooks!!
“Hey Fed, Core PCE Inflation is 1.7%. Dead flat for past 3 quarters.”
Time for the Fed to raise interest rates! Time to put the boot on the neck of working class people to avoid the horror of full employment and make sure they never get a raise. May we never again repeat long national nightmare of the of the 90s.
The Fed’s job is to preempt inflation, because of lags in the adjustment process. Monetary policy is still highly accommodative and there’s some inflation. You don’t give the Fed enough credit (pun intended). The introduction of QEs weren’t enough to get the economy back on track. Obviously, the Fed has been unable to do it alone. Expansionary fiscal policy, deregulation, and tax cuts are needed.
I wonder if the seasonal pattern to the NSA core CPI is impacting this.
In a low inflation world firms tend to raise prices once a year –typically at the start of their calendar or fiscal year. Consequently, over half on the NSA core CPI now occurs in the first quarter. There is another bulge in the third quarter because of tuition, new cars and home owners rent.. I have talked to BEA about whether this impacts the NSA core PCE deflator and they did not take my question seriously.
If you double the first quarter NSA core CPI it gives you an amazingly accurate estimate of the December to December core CPI.
But I have to wonder if this is impacting the GDP seasonal adjustments.
The usually reliable Dr. Hamilton is wrong on this one.
Instead of looking at sequential real GDP at SAAR – which allows for weird annualization distortions and inventory effects, it’s much better to look at Real Final Sales, year-over-year.
See here:
https://tinyurl.com/kvovoo5
The last seven quarters of real final sales have grown steadily at a 2% rate, and 1Q at +2.07% was right in line. GDP is a bad measure of economy activity.
GDP is a bad measure of living standards. As stated in the article, real GDP year-over-year was 1.9% in Q1.
JDH Any theories as to why we don’t see the same 1st Qtr slump in the GDI data?
Real PCE surged over April-December 2016. Probably more than expected. That is why payrolls jumped and the U-6 fell since October.
Professor Hamilton,
Any comments about GDP per capita since the end of the recession and for the latest quarter? If my calculations are correct, it looks like 1st. Q 2017 shows a zero percent change in GDP per capita from previous quarter.
Regarding GDP per capita, the annualized change looks to be about 0.1%. Still looks anemic.
The index uses today’s release to form a picture of where the economy stood as of the end of 2017:Q4. ”
I think you meant 2016:Q4 or 2017:Q1 here, as 2017:Q4 is still 8 months away…
Thanks! Fixed now.
no worries says McBride and so do I.