Jason Furman points us out to his favorite Table 8-2 in the Economic Report of the President, 2018, released yesterday, with particular reference to the productivity assumption.
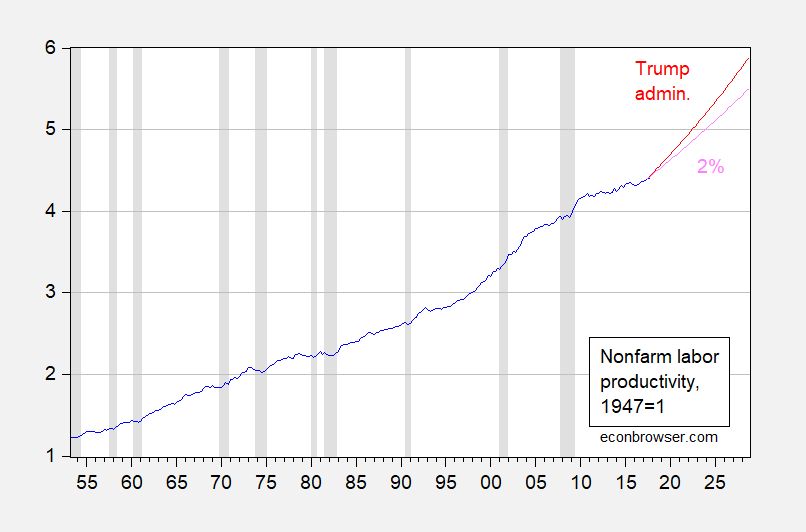
Figure 1: Nonfarm real output per hour, 1947Q1=1 (blue), Trump Administration forecast of 2.6% (red), historical average (1953Q2-2017Q3) growth rate of 2% (pink). NBER defined recession dates shaded gray. Source: BLS via FRED, NBER, CEA and author’s calculations.
Note that this is the officially reported series, rather than the average of GDO and GDI used by CEA. The differences are small, however, in estimated trends, so I think this graph is representative.
The 2.6% growth rate forecast is just at the upper end of the 66% confidence interval for an ARIMA(0,1,0) or ARIMA(0,1,2) model, estimated over the 1953Q2-2017Q3 period. The 2.6% growth rate forecast is definitely outside of the 66% interval if the Great Moderation period (1986Q1-2017Q3) period is used.
Here is Table 8-2 from the ERP.
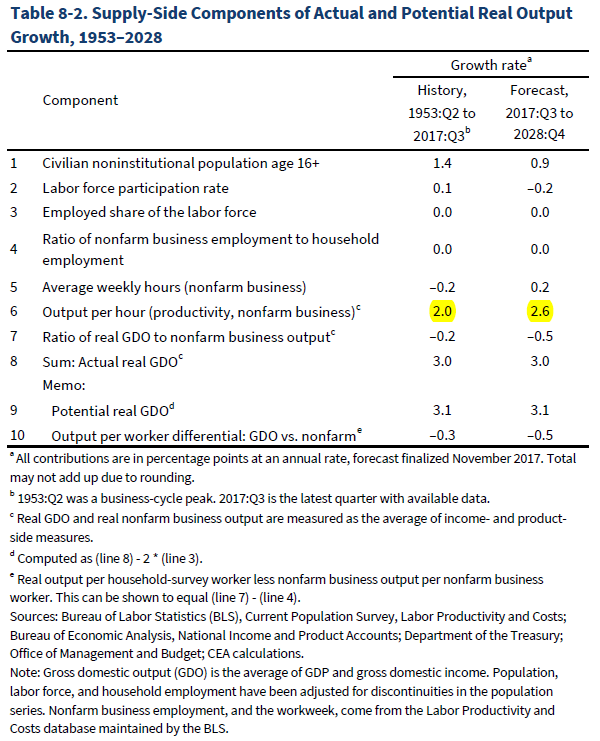
Source: Economic Report of the President, 2018.
For the sake of completeness, here is a closeup of the data, graphed on a log scale, and with the ARIMA(0,1,0) of log nonfarm productivity included.
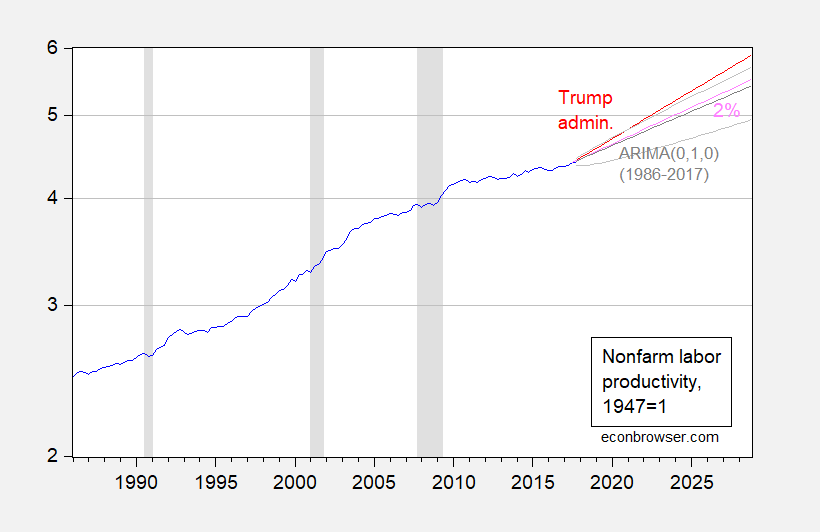
Figure 2: Nonfarm real output per hour, 1947Q1=1 (blue), Trump Administration forecast of 2.6% (red), historical average (1953Q2-2017Q3) growth rate of 2% (pink), ARIMA(0,1,0) forecast estimated over 1986Q1-2017q3 period (dark gray) +/- 1 standard error (light gray). NBER defined recession dates shaded gray. Source: BLS via FRED, NBER, CEA and author’s calculations.
Are any reasons given on why Productivity will rise as forecast?
It is the John Cochrane weeds in the garden theory of regulation. You know – solid microfoundations. NOT!
It is the John Cochrane weeds in the garden theory of regulation. You know – solid microfoundations. NOT!
Alex Herr’s question:
“Am I reading that correctly that they are expecting a decrease in labor force participation? Is that retirement of boomers or lower rate among ‘working age’ adults?”
Jason’s answer:
“They are expecting an increase in the AGE-ADJUSTED LFPR. If all LFPR’s stayed the same for each age group but the shares of the population shifted older based on demography, that number would be -.4”
I’m up to Chapter 2 on the ERP. Trying my damnedest not to give comments until after I read the entire thing. It’s arduous reading, especially when Hassett is cherry-picking white papers with ridiculous arguments, and chosen from time frames that are not analogous to the current situation. It’s one thing reading a 400+ page book you enjoy, like Varoufakis or Jean Tirole, but reading this Hassett gutter tripe siphons off energy and, uh, I would say “soul-destroying” but that’s a tad melodramatic.
“Hassett is cherry-picking white papers with ridiculous arguments”.
He does this routinely. I wish other economists who call him more often on this. Hassett reminds me of an internet troll.
Can anyone else tell me if they also have a problem with Hassett’s meaning and/or grammar of this sentence at the bottom of page 104??
Although more teens are enrolled in school, evidence suggests this group, relative to 10 years earlier, spends more time on unproductive activities, neither at work nor in school.” ???
Maybe Hassett should spend more time taking high school grammar. Speaking of unproductive activities – he worked really hard on this right wing spin.
Productivity took a nosedive between 2007-17 and especially in the manufacturing sector. https://www.bls.gov/lpc/prodybar.htm
It’s pretty obvious that without manufacturing growth, productivity growth in the U.S. will not be significant. It certainly won’t happen in the service sectors. So the question is: will Trump’s tax changes and other policies lead to a revival of U.S. manufacturing or will we just muddle along? Unless something dramatic happens, 2.0% improvement over the next decade will be a stretch.
pgl Bruce Hall said: without manufacturing growth, productivity growth in the U.S. will not be significant. It certainly won’t happen in the service sectors.
This sounds like an opening for your EconoSpeak post on Baumol’s cost disease.
2slug When you look at past total productivity, it’s been closely tied to manufacturing. Where do you see productivity increasing without manufacturing productivity improvements? I suppose that could happen when AI allow a dozen or so people to “manage” thousands of robots and the labor participation rate is, what, 5%?
I’ve see so-called productivity in the healthcare (service) field where doctors spend the same amount of time with patients, but most of it on data entry for record keeping rather than advising patients or examining them. That give a productivity boost to the administrative side, but not much real medical improvement. Services can become more efficient as the work is performed by the customer rather than the service provider (online form filling, etc). But I’m not sure that leads to much economic growth overall. It certainly affords the opportunity for lowering costs and prices.
Regardless, what has salary increases in areas without productivity improvements because someone else is productive have to do with increasing total productivity? I can only guess you are trying to be humorous in your inimitable way. Or are you trying to say that salaries and prices will go up because someone somewhere is more productive and therefore real output increases? I have to admit, I’m not following your comment at all. Maybe I’m just too tired as it is almost midnight.
Measured productivity fell during a massive recession? Excuse me here but this is no surprise given how it is measured. DUH!
Bruce Hall I think you were just tired. I wasn’t even disagreeing with you. My only point was that lower productivity is something that happens to all economically wealthy economies as demand shifts to service oriented output rather than goods oriented output. You might find these two links interesting:
https://growthecon.com/blog/What-You-Spend/
http://econospeak.blogspot.com/2018/02/baumol-cost-disease-and-relative-prices.html
The last one is pgl’s.
2slug Thanks for the clarification. I read your first reply several times and kept wondering what I was missing. Yeah, I was tired. Had been up for 18 hours.
Looking at this chart and excluding the last 10 years, most people would turn to the median figure which was 2.2% long-term productivity. But no an adept cherry picker like Hassett so 2.6% it is!!
You know again, Hassett can choose any source of numbers he likes. It might be better though, if it didn’t look like a middle school essay.
Kevin Hassett—–
“We measure the peak-to-trough-to-peak average rate of growth within each business cycle, starting with the first post–World War II cycle and continuing through the current one, which began in December 2007. This method disentangles cyclical changes in output from long-term, secular trends in economic growth.”
Who in their right F’ing mind thinks that the “trough” of “W” Bush’s and Henry Paulson’s swaps and derivatives mess of 2007–2009 was December of 2007?? REALLY!?!?!?!! “W” Bush hands off a F’ing DISASTER ZONE to President Obama in January 2009 and Hassett thinks the “trough” was December of 2007?? What F’ing alternative reality world is Hassett living in?? Because I was there. The “trough” was not F’ing December 2007. Does this DUMB SOB Kevin Hassett know what happened to the unemployment rate, between say, February 2008 to March of 2009??
Moses Herzog,
You ask:
“Who in their right F’ing mind thinks that the “trough” of “W” Bush’s and Henry Paulson’s swaps and derivatives mess of 2007–2009 was December of 2007?? REALLY!?!?!?!!”
But I think you possibly misread Hassett. He says “We measure the peak-to-trough-to-peak average rate of growth within each business cycle, starting with the first post–World War II cycle and continuing through the current one, which began in December 2007”. The most recent peak-to-trough-to-peak began with the peak of 2007Q4 to the trough of 2009Q2 to the peak of 20??Q? and most economists do accept the recent peak as occurring in 2007Q4.
@rtd
As much as it pains me (for my own vanity’s sake) to admit, it appears, rtd, you are right, and I stand corrected.
However, it still strikes me as odd in more ways than one. It appears a convenient way to blanket over “W” Bush’s record, where the vast majority of damage was done (to productivity, output, and or otherwise ad nauseam economic metrics under the sun). The peak in employment was in fact around May 2007, with official unemployment at 4.4% versus 5% in December 2007. Now I think they say they have to wait 2 quarters of numbers before they can “verify” it as “the start” of a recession. However, with the beauty of hindsight, I think we can now call a spade a spade looking back, and say it started around May 2007. And I’m not even counting housing prices or mortgage bonds which would shade in 2006. I’m willing to say 2006 is debatable. But where did the house fire start—-at the bad/exposed electrical cord behind the wall, or when we saw the wall flames??
Moses Herzog,
You claim “peak in employment was in fact around May 2007” but the peak in nonfarm payrolls was Jan2008 in the establishment survey and the peak for civilian employment from the household survey was Nov2007. It should also be noted that real personal income less transfers peaked in Dec2007 and industrial production peaked in Jan2008.
You say “Now I think they say they have to wait 2 quarters of numbers before they can “verify” it as “the start” of a recession. However, with the beauty of hindsight, I think we can now call a spade a spade looking back, and say it started around May 2007.” But you seem to be confused with the common, yet erroneous, line of thought that consecutive quarters of negative gdp growth constitutes a recession. The business cycle dating committee is quite explicit that they do not necessarily follow this line of reasoning. Additionally, their dating of Dec2007 being a peak was made a year later in Dec2008.
You ask “where did the house fire start—-at the bad/exposed electrical cord behind the wall, or when we saw the wall flames??” but a business cycle peak isn’t necessarily about a recession’s impetus (the bad cord) but more so the actual impact (visual flames) on an economy. On this point I’ll gladly defer to someone like Menzie to correct me if my interpretation is incorrect.
Moreover, business cycle dating isn’t Hassett’s doing.
However, the dating committee is said to be open to amending dates – maybe you’ll be vindicated.
@rtd
We’ll have to agree to disagree as far as the timing of the recession. As far as what I read, the BLS unemployment and the nonfarm payroll are comparable stats. i.e. One does not supersede the other. As to your other points, please don’t correct me on things you assumed I said, but didn’t say. It’s bad enough commenters here have to defend things PeakIgnorance makes up as he goes along, I don’t think we need another one. As far as my electrical cord fire analogy, that was largely a rhetorical question—meant to encourage thought.
Lastly, I doubt if Menzie has time to confirm or deny every argument between commenters. However if Menzie wants to “play referee”, surely he is welcome. I’m sure as the host of this blog he was “very excited” by your invitation. God knows if he wastes time responding to PeakIgnorance and CoRev, he is not too snobbish to consider himself “above it”.
Moses Herzog,
Just realize that when Menzie references recession dates (e.g. on his graphical representations), he is likely referring to the same trough/peaks as Hassett.
Also, I didn’t mean to imply you said something that you didn’t…sorry to upset you but. It only seemed that your comment “I think they say they have to wait 2 quarters of numbers before they can “verify” it as “the start” of a recession” was confused with a commonly, yet erroneous, line of thought. Moreover, it seemed to imply the dating committee only waited 2 quarters to date the business cycle whereas we know that they did not for the Dec2007 peak. Please correct me if I continue to misunderstand/attribute your feelings. As for your electrical cord fire analogy, I thought it wasn’t very well thought out as it relates to the issue at hand.
It is odd so maybe we can ask Stephen Moore to clarify how these guys measures these things!
Paul Krugman gave several explanations for the slowdown in productivity growth:
*Low investment and savings rate.
*High taxation of savings.
*Excessive government regulations.
*Low rate of public investment in infrastructures.
*Decline of R&D investment.
*Sociological explanations.
*Decline in quality of education.
So, the Trump Administration is on the right track to boost productivity growth. The children of the Baby-Boomers entering prime-age will also boost productivity. And, the addition of more workers through entitlement reforms will boost GDP growth.
Raising the minimum wage, in itself, will boost productivity growth.
BLS data shows over the 10 year period 2008-17, the U.S. averaged 78,000 job gains per month.
To keep up with population growth, perhaps 125,000 jobs per month is needed.
So, there’s still substantial labor slack in the economy.
The WSJ accounts for population growth and retirements:
https://www.google.com/amp/s/www.wsj.com/amp/articles/BL-REB-35429%3fresponsive=y
WSJ April 7, 2016
“While estimates vary somewhat, a plurality of economists think the magic number is between 140,000 and 159,000. As it happens, a pace of about 145,000 jobs per month is both the average and the median estimate.
Estimating the pace of break-even job growth is a challenge. First, one must account for population growth. New jobs must be created to account for the growing population of people who graduate high school or college each year and enter the labor force. Second, one must account for the retirements of the baby boomers.
Then they must also account for the number of workers without jobs, but who might be expected to return to the labor force in the future—that could include people who have left the market to raise children or go to college, or those who have been discouraged by the weak economy in recent years.
Some estimates are even lower than those of the economists in the Wall Street Journal’s survey, which is a monthly panel of academic, business and financial economists. For example, researchers at the Federal Reserve Bank of Chicago estimated in 2013 that only 80,000 jobs per month were needed to hold the jobless rate steady. Fed Chairwoman Janet Yellen said in December that “under 100,000 jobs per month” are needed to absorb new entrants into the labor force.“
If the pace of job growth should’ve averaged 100,000 per month over the past 10 years to reach full employment, we still need 2.6 million jobs above the 100,000 a month job pace in future years.
Amateur numbers. Try doing this in terms of the current employment to population ratio as compared to where it should be. Oh wait – an elementary concept that goes right over our failed banker’s comprehension! Pardon the interruption.
It’s where it’s been thanks to the Obama-Reid-Pelosi policies.
Do you have a point besides name calling?
“It’s where it’s been thanks to the Obama-Reid-Pelosi policies.” WTF? You cannot even articulate what the alleged “policies” were and then you ask this stupid question?
‘Do you have a point besides name calling?’
Oh I see – you were asking yourself that question. And the answer is no. You never have a point. Pardon the interruption.
Krugman argued this?
“*High taxation of savings.
*Excessive government regulations.”
Where? I see no links to what he actually wrote. Peaky – you have lied to us many times before but to be so transparently dishonest? C’mon man!
Rather than cut & paste and declaring you wrote an economics article, take some macroeconomics and labor economics classes.
http://people.stern.nyu.edu/nroubini/NOTES/CHAP4.HTM
I asked you for the alleged Krugman piece and you linked to Roubini’s lecture notes?
Are you really THIS stupid? Apparently. And yea – you clearly lied. Case closed.
I provided the link that supports my statement, not yours. Being too dumb to find it is not my problem. Obviously, you need assistance:
“Several explanations of the slowdown have been suggested but none has been found to be fully satisfactory (see Krugman “The Age of Diminished Expectations” Chapter 1 for a detailed discussion):”
Apparently, Krugman cited those explanations. If not, don’t blame me. If you still can’t find the Krugman section, look around the middle of link.
“Perhaps the most striking facts in economics concern the large cross-country differences in output and income per person. People in the US are, on average, 3 times richer than those in Mexico, fifteen times richer than people in India, and (when I last looked) about fifteen percent richer than the Japanese. These differences in levels are matched by large differences in growth rates. ”
US output per capita is also higher than it is in China. But China is growing at a faster rate/
I wonder if PeakyBooBoy noticed the reported US growth rate was only 2.1% not the 2.6% claim in the ERP.
Robert Solow wrote the seminal article on economic growth 60 years ago. Now PeakyBooBoy claims he gets this stuff even though he cannot answer Menzie when asked which alleged text he used. Likely it was written in crayons as PeakyBooBoy clearly does not grasp what most of us call the convergence thesis.
So let me get us Peaky’s crayons and explain this VERY SLOWLY for him. If two nations with similar technology and the same national savings rate have different output per person, the lower income nation will have a faster growth rate.
Oh gee – this explains why China is going faster than we are. But this all goes over PeakyBooBoy’s head.
BTW I have published in the Journal of Labor Research. Something about the role of compensation being paid in wages and fringe benefits and the effect of wage floors in the presence of monopsony power. Sorry PeakyBooBoy but it involved theory and math and was not written in crayons so you would never grasp the argument.
You’ve shown nothing, but a shallow and narrow view of economics, along with a lot of cutting & pasting.
Even if you could get into the grad econ program I graduated from, you’d be crying within the first week.
bottom trader, that is funny. you couldn’t even get admitted into a legitimate economics program today. your parents bought you a degree years ago, and that boat has now sailed…
Something else PeakyBooBoy missed:
‘By 1985, much of the difference had disappeared. It’s obvious from the numbers that the biggest difference between Japan and the US over the 1970-85 period is in the rate of growth of the capital stock. From the basic growth accounting equation, labeled (*), we find that for the US the output growth rate of 2.66 percent per year can be divided into 0.93 percent due to capital and 1.26 percent due to employment growth. That leaves 0.47 percent for productivity growth. For Japan the numbers are 2.48 for capital, 1.08 for labor, and 1.13 for productivity. The largest difference between the two countries is in the rate of capital formation: Japan’s capital stock has grown much faster than the US’s, raising its capital-labor ratio K/N from 36.4 in 1970 to 88.0 in 1985.’
Again getting out PeakyBooBoy’s crayons, the Reagan 1981 tax cuts Peaky adores reduced the US national savings rate and slowed US growth by reducing the rate of capital accumulation.
Hey Peaky – thanks for this link as it makes an important point I often make – one that you routinely argue against. OK, it is time for YOU to read his text!
You don’t even understand all your cutting & pasting.
You’re a mess.
All the name calling won’t make up for it.
And, stop lying about me.
This is really funny from the person who lied about what Krugman allegedly said.
@ PeakIgnorance
I’d be fascinated to see the link/video or anything where Paul Krugman mentions “excessive government regulations” as a reason for the slowdown in productivity growth. Would you be so kind as to share where Paul Krugman wrote and or said this?? ANYWHERE???
I asked him the same question. He says he has answered it but the answer was a book Krugman wrote about economic policy in the 1990’s. Earth to PeakyBooBoy – it is 2018! Damn!
I asked PeakyBooBoy where he got the idea that Krugman said regulation caused the recent slowdown in economic growth and all he can do is this?
“Several explanations of the slowdown have been suggested but none has been found to be fully satisfactory (see Krugman “The Age of Diminished Expectations” Chapter 1 for a detailed discussion):”
Notice the full title:
“The Age of Diminished Expectations: U.S. Economic Policy in the 1990s”
https://www.amazon.com/Age-Diminished-Expectations-Third-Economic/dp/0262611341
Case closed!
Care to share your eviews workfiles?