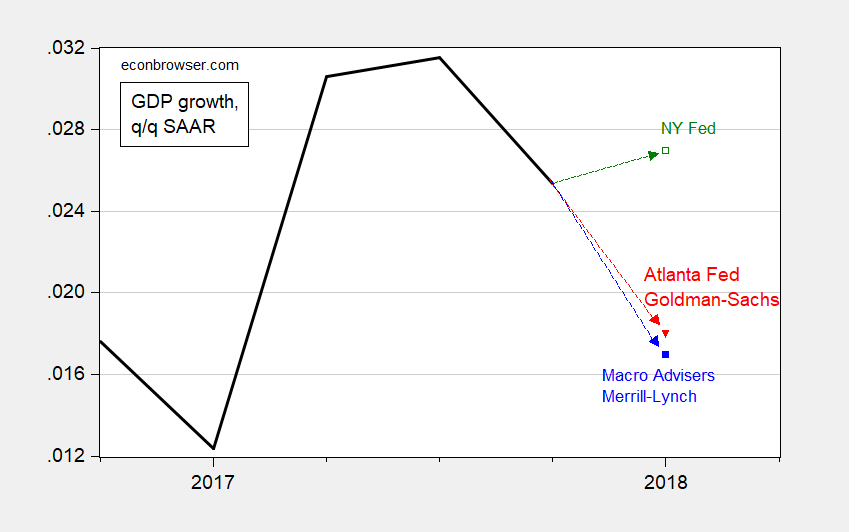
Figure 1: Real GDP growth, actual (bold black), forecast of NY Fed Nowcast 3/16 (green), Atlanta Fed GDPNow 3/16 (red), Goldman-Sachs 3/19 (red), Macroeconomic Advisers 3/16 (blue), Merrill Lynch 3/19 (blue), q/q SAAR. Source: CR, Macro Advisers, Goldman-Sachs.
GDP growth in Q1 has been lower in the past years, few consistent with residual seasonality.
Last month, non-farm payrolls increased 313,000 and increased 239,000 in January – over 550,000 jobs the first two months! It seems, that should add to GDP growth.
0.9% is a huge gap in a quarterly forecast, is it not?? Any guesses how NYFRB gets a 0.9% higher number?? Some will say this is nothing, but for the last 10 years of GDP I would argue 0.9% difference in a single quarter is gargantuan. Any thoughts from the blog host or some of the brighter commenters would be much appreciated.
It is true that the NY FED forecast is an outlier. Could it be? Trump landed a job there for his favorite cheerleader – PeakyBoo!
Now we do not have to pay taxes for him to live off of our dole!
Moses –
The respective Fed pages are below. They build up the components of GDP and adjust them with incoming news.
Those forecasting tools are not really that good yet, so take them with a grain of salt. But obviously, a higher forecast is better than a lower forecast.
To Peak’s point, intuitively, with big employment gains, we might expect a good quarter for GDP growth. If not, the culprit is mostly likely to be changes in net exports (imports) and changes in inventory, which can be quite volatile.
https://www.newyorkfed.org/research/policy/nowcast
https://www.frbatlanta.org/cqer/research/gdpnow.aspx
@ Kopits
I said I would appreciate thoughts from the brighter commenters. #NotWelcome
Maybe that was a little harsh towards you Kopits, the links were useful.
Am I nuts, or at least on those two specific links the Atlanta Fed is much more user friendly?? OK, I am nuts, but anyone can answer the 2nd question.
Ok, so I am going to put this here since Kopits was kind enough to point me in the right direction. Apparently there are 3 ways to do a GDPnowcast. It appears the Atlanta Fed uses the “tracking method” of GDPnowcast. Now can we assume that since the numbers are similar GS, Macro, and Merrill also use the same method of GDPnowcast, and that NYFRB uses something other than the “tracking method”?? I’m gonna take a page out of Menzie’s philosophy and see if I can at least figure out the methods used on the other three my own damned self—although private outfits such as GS may not be as transparent about how they get their numbers.
NYFRB are being quite vague about this crap (in my opinion). So far this is the best breakdown I can find on the NYFRB site (again not near as user friendly as the Atlanta Fed site. I think if you skip to the very last sentence of this copy/paste from the NYFRB site, you’ll understand my use of the term “vague”:
“The New York Fed Staff Nowcast and the Atlanta Fed’s GDPNow are both based on statistical filtering techniques applied to a dynamic factor model. These techniques are very common in big data analytics since they effectively summarize the information contained in large data sets through a small number of common factors. The general framework for macroeconomic nowcasting has been developed in the academic literature over the past ten years, as explained in our methodology section. The New York Fed Staff Nowcast is a straightforward application of the most advanced techniques developed in this literature. GDPNow adapts these techniques to mimic the methods used by the U.S. Bureau of Economic Analysis to estimate real GDP growth, as GDPNow’s own FAQs make clear.
Because GDPNow and the New York Fed Staff Nowcast are different models, they can generate different forecasts of real GDP growth. Our policy is not to comment on or interpret any differences between the forecasts of these two models.”
If you scroll down to page 3 of this .pdf, it appears to break down a lot of the mathematics (and uses the actual real life numbers) involved.
https://www.newyorkfed.org/medialibrary/media/research/policy/nowcast/nowcast_2018_0316.pdf?la=en
If I am not misinterpreting this, it seems NYFRB also uses the “tracking method” of GDPnowcasting, which kind of surprises me based on the 0.9% difference, which in my opinion is a large difference.
It is also worthy of note that the Minneapolis Fed often uses a “Medium Data” Or “Data Rich” method of GDPnowcasting (one of three major methods of GDPnowcasting) on its website or more specifically “Mixed Frequency Vector Autoregression” or “MF-VAR” (which I guess is a subset of the “Medium Data” method)
Damn man, this novice seems to have the answer I was straining and struggling for. Anyone ever heard of this guy?? And what is really annoying is he put it up about 2 years ago. This hack and rank amateur seems like the type of guy who would spend his time filling out NCAA basketball tournament brackets. I mean really where do they find these people?? https://econbrowser.com/archives/2016/05/dueling-nowcasts
I presume that link will provide a better and more thorough answer than anymore hunting and pecking on the keyboard I will do today. That’s all the news from Lake Wobegon.
A conservative estimate is there remains substantial slack in the labor market. Over the 10 year period 2008-17, we added an average of 78,000 jobs per month. However, we needed up to 159,000 jobs per month to keep up with population growth, subtracting retirements, and adding discouraged workers (or those expected to re-enter the workforce, if the “recovery” wasn’t so weak). The conservative estimate, based on 100,000 jobs per month over the 10 year period, means we needed 2.6 million more jobs through 2017. So, at least, an additional 2.6 million jobs, above the 100,000 per month, is needed in 2018 and beyond to reach full employment.
Trend line analysis. You must have gotten your degree from the Kudlow school of “economics”!
There is slack, but it is principally in the workforce participation rate.
On the other hand, CBO thinks this actually deteriorates.
https://3.bp.blogspot.com/-u_S3WBtKJQM/WqvsTtcK0II/AAAAAAAAuN8/QudCKYPJLtIG3b0gFXkO9t3g0hEJVQjngCLcBGAs/s1600/LFPRProjections.PNG
BS_Trader Over the 10 year period 2008-17, we added an average of 78,000 jobs per month.
So you’re including the job losses that include the depths of the Great Recession??? How dumb is that? If you include the number of jobs since the NBER recovery date, the average is closer to 165k. If you just look at the job growth since the economy was stabilized and no longer shed any jobs (Oct 2010), the average monthly job growth over the last 89 months has been around 200k. You need to quit embarrassing the school that you claim gave you a PhD Lite.
A conservative estimate is there remains substantial slack in the labor market.
Really? A substantial amount of slack? Hardly. There may well be some amount of slack, but no serious person thinks there’s a substantial amount of slack in the labor market. But of course you know much more than the economists at the Fed.
Let me recommend a more serious analysis of the recovery: http://www.nber.org/papers/w23543
It’s a recent (June 2017) paper by a couple of folks with fairly strong econometric chops…James Stock and Mark Watson. Perhaps you’ve heard of them. Anyway, they found that after correcting for trend and cyclical effects the recovery wasn’t nearly as disappointing as commonly believed; but to the extent that there was disappointment, it is almost entirely explained by a fall in total factor productivity (TPF) and the non-demographic labor force participation rate. But they point out that the fall in TPF had started long before the onset of the Great Recession. They further found that the fall in the non-demographic labor force participation “is not plausibly just a consequence of the increase in unemployment in the 2007-2009 recession.” In fact, decomposing the time series suggests that the downward trend in the non-demographic portion of the labor force participation rate actually started before the Great Recession. The difference between this NBER paper and your blathering is the difference between rigorous analysis and pure BS.
Be easy on PeakyBoo – he admitted yesterday that he has been massively evading sales taxes in California.
2slugbaits, your ignorance matches Pgl’s.
What’s dumb is believing population growth stopped or reversed when there were job losses.
Maybe you believe there’s no population growth. So, no jobs need to be created each month.
What??? Who said population growth stopped or reversed?
Hey Peaky – be careful now that you have publicly admitted you massively evaded sales taxes in California. Jerry Brown is really good at tracking criminals down.
And, I got my estimates from:
“Economists in the Wall Street Journal’s survey, which is a monthly panel of academic, business and financial economists.”
If you’re referring to the number of jobs needed each month to keep up with population growth and retirements, then your 159k number is wildly off the mark. That was a widely believed number needed to bring the economy back to full employment along a steady growth path. In other words, you could (very roughly) think of it as a long run average during the recovery phase. And the economy actually achieved that. But the number needed to offset retirements and population growth is estimated at between 50k-100k by the SF Federal Reserve and the Chicago Federal Reserve once the economy achieves full employment. So you’ve just completely misunderstood the data.
BTW, you might want to try and reconcile your comments here today with your earlier comments on why Wisconsin cannot achieve higher employment numbers. In those comments you were essentially arguing that the economy was already at full employment, thereby making it more difficult to add the marginal job. Here you seem to be arguing exactly the opposite; i.e., that there’s gobs and oodles of idle labor.
So others can check to see how you are assuredly misrepresenting things as usual:
http://projects.wsj.com/econforecast/#ind=gdp&r=20
“There may well be some amount of slack, but no serious person thinks there’s a substantial amount of slack in the labor market.”
The employment to population ratio is currently 60.4%. When I suggest it should be 62%, a lot of people literally scream at me that this is too high of a goal. Then again there are those Bernie Bros who thought Gerald Friedman’s “paper” was wonderful who go off on a tangent telling us that this ratio should be something like 67%! Who knew that Peaky Boo was a Bernie Bro!
Hello? The employment-population ratio only reflects the weak job growth in 2008-17, including job creation didn’t keep up with population growth.
So you are saying we should have the same employment to population ratio that we had in 2000?
I’ll let the DEMOGRAPHICS crowd scream at you. They seem to think 60.4% is way too high.
Me? I think they are only half right as in my 62%.
Way to ignore all reality PeakyDumb!
“The nowcast of first-quarter real private fixed-investment growth increased from 2.4 percent to 3.3 percent after this morning’s new residential construction release from the U.S. Census Bureau and this morning’s industrial production and capacity utilization release from the Federal Reserve Board of Governors. This increase was more than offset by the modest downward revisions to the nowcasts of the contributions of real consumer spending, real net exports, and real inventory investment to first-quarter real GDP growth.”
Could this be Kudlow’s inventory boom prediction coming true?! Oh wait – Kudlow said the entire economy will grow by 5% per year for several years. So maybe not. Net exports are falling despite the dollar depreciation. Barry Eichengreen has some very good thoughts on this lately (see Mark Thoma’s blog for a link or go to Angybear where they put up a comment I made noting Barry’s post).
Odd that the good folks at the Atlanta FED did not have a nowcast of government purchases.
Hiring incompetent people for important jobs could also affect the value of the dollar. Incompetent people read as Kudlow etc. How do you discount in market terms the possibility of a man with no formal economics training, and a record of horrible forecasting as the head of the NEC for 7 years?? I’ve always thought Lawrence Summers was/is a morally bankrupt bastard after learning of his infamous conversation with Brooksley Born—but even that SOB wasn’t horrid on the whole at making economic forecasts. I’m going to read that Alphaville link Eichengreen gave on his site of “the 17 reasons” just to exercise the brain. But I think it will be a waste of time in the sense I think Eichengreen hit the nail on the head. https://www.project-syndicate.org/commentary/what-explains-dollar-weakness-by-barry-eichengreen-2018-03
Keep in mind before the link jump, you have to register with Alpha to read the article, but here is the Alphaville link:
https://ftalphaville.ft.com/2018/02/21/2198930/17-reasons-for-a-weak-dollar/
I should say, although you could argue this reason for a weak dollar is tied at the hip to Trump, that reason #8 given on the Alphaville link is a very very important reason for the dollar’s devaluation, and even, arguably, more important than the negative perceptions created by Trump’s horrid “leadership”.
Alphaville’s reason #8 being:
US “tax reform” means ramping up fiscal deficits, which tends to lead to a weaker dollar (see Reagan tax cuts in 1985 and Bush tax cuts in 2001 – although in both the dollar did not fall until some months later)
@ Menzie
Menzie, scroll about 1/4 of the way down the page, look at this map on “Bank Shareholder Liability in 1926” and see if you notice anything funny about the state abbreviations. I think you’ll recognize this is on the NYFRB blog:
http://libertystreeteconomics.newyorkfed.org/2018/02/does-more-skin-in-the-game-mitigate-bank-risk-taking.html