Why do reported growth rates differ for the same variable? Refer to the last three years of GDP data to see…
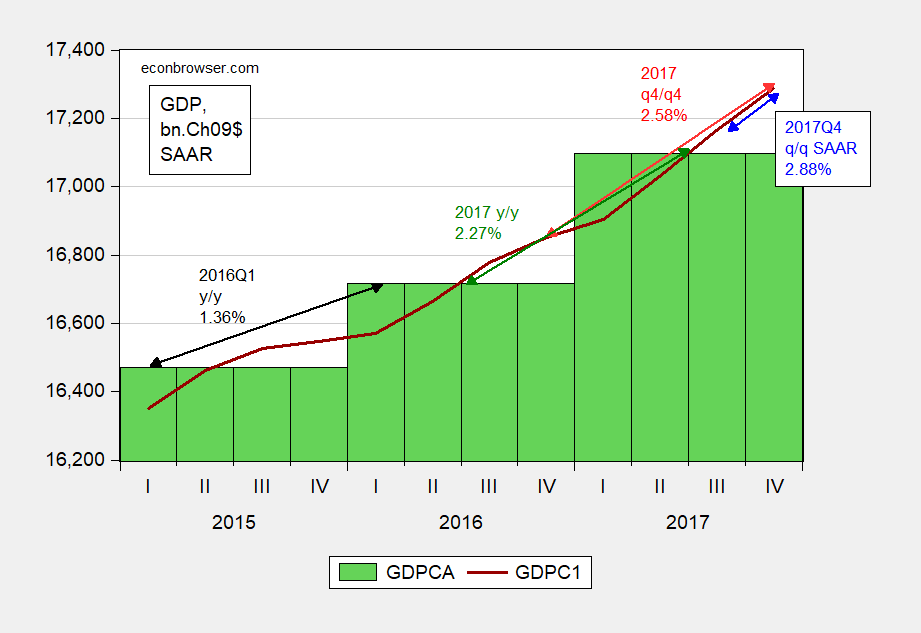
Figure 1: Quarterly GDP, SAAR, FRED series GDPC1 (dark red line), annual, FRED series GDPCA (green bars), in billions of Chained 2009$. 2017 q4/q4 growth rate (red arrow); annual 2017 y/y growth rate (green arrow); 2017Q4 q/q SAAR growth rate (blue arrow); 2016Q1 y/y SAAR growth rate (black arrow). Source: BEA, 2017Q4 3rd release via FRED, and author’s calculations.
So, there are several ways to calculate the growth rate over the course of the year. They will almost invariably differ, perhaps substantially, when GDP is either growing very rapidly or shrinking very rapidly. And there is no “right” way. If one wants to calculate the most recent growth experience, one might stress q/q. If one wants to look at a longer horizon, then one might want to use the quarterly y/y. If one thinks quarterly series are very noisy, one might want to look at annual y/y.
Note: SAAR denotes Seasonally Adjusted at Annual Rates.
Additional Note: One could average the q/q annualized growth rates over the four quarters of 2017 to try to get 2017 q4/q4 growth rate. This calculation leads to an approximation, which gets worse the more variable growth rates are (unless growth rates are calculated as log-differences — which is part of the reason economists like to express variables in logs and log differences…).
@ Menzie
I have kind of a “philosophical” question for you. This is getting back to the chain-index discussion. And if this comes across as being hypercritical or judgmental of economists, that is not what I mean. More of a curiosity about human beings in general. Irving Fisher came up with his “Ideal Fisher” method in 1922. It was only really used or “adapted” into official stats in 1996. That is 74 years later, correct?? Isn’t that kind of weird when you think about it??—especially if we consider economists are a pretty cerebral lot overall. Why the delay there??
Moses Herzog: There’s more computation with the Fisher ideal indices, and with Paasche and Laspeyres indices, can refer to a bundle in a specific year. With relatively small changes in relative prices, the issues with fixed base year were minimal…which stopped being the case with the advent of rapid decreases in (quality adjusted) computer equiptment prices.
Thank you Menzie
I saw a paper that argued using t-3 as a weight was slightly better than using t-2 as a weight. Curious if you had any thoughts on that. I mean if we’re using all these weird ways to get a number ahead of time (such as Atlanta Fed’s GDPNow) wouldn’t the idea be to get the most accurate number as possible??
Still referring to Chain Index method here obviously.
Good discussion. We should have a rule here – when someone is putting forth numbers like growth in 2017 was 2.6%, the specific definition should be required as well as a reliable source. I tend to rely on http://www.bea.gov. I forget but who was it that thought http://www.usgovernment.com gave reliable data?
Drinking Monster drink and popping aspirin while I wait for a relative to come back from cataract surgery. I really f’ing hate living in a dry house.
If anyone knows or is aware of a FREE link or FREE pdf download version of the Vavares, Prakken, Guirl paper on Chain-Indexes and the particulars thereof, that would be, like, super awesomely cool if you could put that in this comment thread someplace. Allow me to pre-emptively say thank you to anyone who can do that.
We down under and in almost every other country always use SAAR. the OECD and the IMF use it or variations of it.
Simply get rid of annualised rates they are useless IMHO
Warning: off-topic of post
I thought this was a terrific post by “EconoFact”. They are discussing how US legislators are “forgetting” (forgetting, or being bribed not to recall??) the economic crisis of 2007–’08, which was caused largely by financial derivatives/swaps and banks taking exorbitant amounts of debt instruments on their balance sheets, with little equity to cover the bets.
http://econofact.org/is-financial-regulation-doing-the-right-amount-to-prevent-cascading-crises
If you look at this nice but extremely simple graphic they made,
http://econofact.org/wp-content/uploads/2018/04/LONGBergstresserWEB.png
it shows the banks that currently qualify as “SIFI” institutions, and those (a much smaller number of banks, above the $250 billion red demarcation line) that would be considered “SIFI” under the proposed new law. This is very worrisome and troubling for a long laundry list of reasons. One of which is we recently had a very sharp-minded Jewish lady heading the Fed, who just was fired by Trump, who is possibly the very first Fed Reserve Chairperson to take the Federal Reserve’s duties as a regulator (and by extension the Fed Chairman is accountable for) in a serious manner. An accountability to the American taxpayer the very cerebral Miss Yellen exhibited her seriousness towards, in her final action as Fed Chair:
https://www.bloomberg.com/news/articles/2018-02-02/wells-fargo-banned-from-growing-in-fed-crackdown-after-scandals
Will Trump’s choice, William Powell, be as diligent in his duties as a bank regulator?? DOUBTFUL
The dumb blonde anchor in the Bloomberg link speaks like she’s most worried about people who own stock shares in a bank that creates fictional accounts with excessive charges on people who never opened the account. Let’s all hope that B____ never has the same experience those Wells Fargo depositors had.