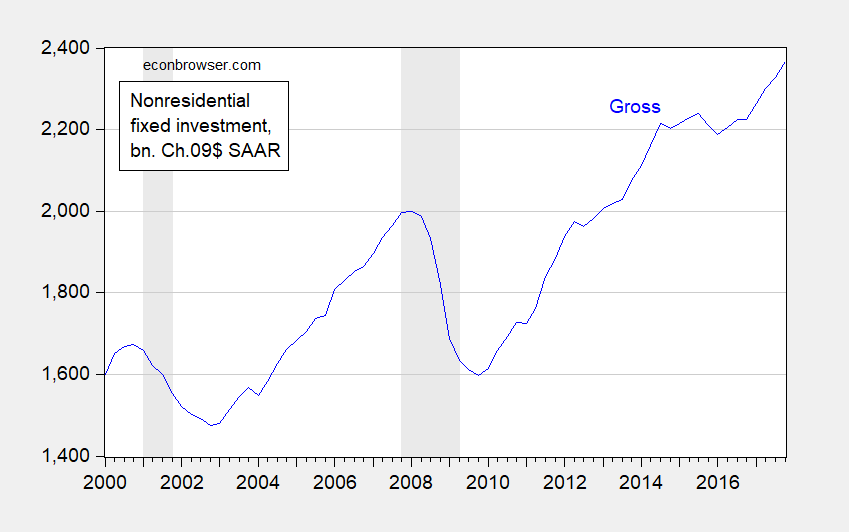
Deregulatory moves, both actual and anticipated, have been hailed as spurring business fixed investment [1] Is there content to this assertion? A glance at nonresidential fixed investment seems to be supportive.

Figure 1: Private nonresidential fixed investment, in billions of Ch.2009$, SAAR (blue). NBER defined recession dates shaded gray. Source: BEA, 2017Q4 3rd release.
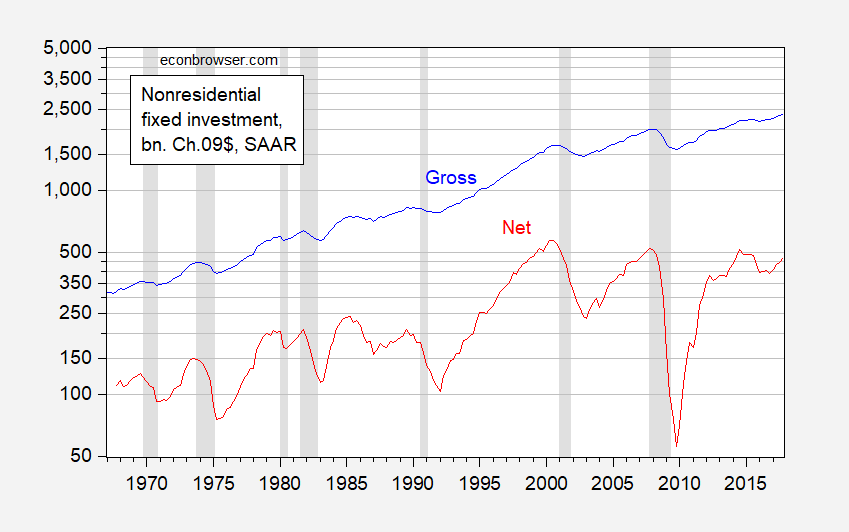
However, the standard investment series reported in the NIPA tables pertain to gross investment spending, i.e., not taking into account depreciation. As capital expenditures have skewed more toward information and communication technology (ICT) equipment and software, the pace of capital depreciation has accelerated. As a consequence, the net and gross series have deviated more profoundly over time. Plotting net investment and gross investment (on a log scale) provides a fairly surprising picture.

Figure 2: Private gross nonresidential fixed investment (blue), and private net nonresidential fixed investment (red), both in billions of Ch.2009$, SAAR, both on a log scale. NBER defined recession dates shaded gray. Net figures calculated by subtracting depreciation from gross. Quarterly figures linearly interpolated from end-of-year annual data. 2017 depreciation values extrapolated from 2016Q4 rates. Source: BEA, 2017Q4 3rd release, annual fixed asset tables, and author’s calculations.
The figure makes clear, despite the recent acceleration in investment, net investment has not re-attained levels achieved in 2014Q3 (let alone on the eve of the last recession).
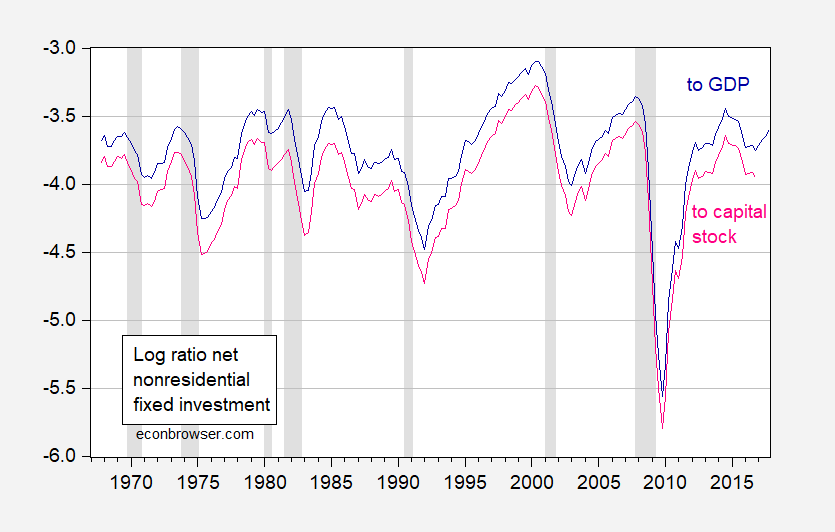
Moreover, because GDP has grown over time, the (log) ratio of investment to GDP has declined. The same is true for log(I/K). [Note: I don’t show I/K or I/GDP because all series expressed in Chained dollars, and ratios of such are not meaningful.)

Figure 3: Log ratio of private net nonresidential fixed investment to GDP (dark blue), and to private nonresidential capital stock (pink). NBER defined recession dates shaded gray. Net figures calculated by subtracting depreciation from gross. Quarterly figures linearly interpolated from end-of-year annual data. 2017 depreciation values extrapolated from 2016Q4 rates. Source: BEA, 2017Q4 3rd release, annual fixed asset tables, and author’s calculations.
Investment is low at a time when real interest rates remain quite low, stock market valuations (and hence Tobin’s q) remain high, corporate profits large. And, interestingly, over the past year, with economic policy uncertainty as measured by Baker, Bloom and Davis, at elevated levels, investment has accelerated relative to 2016. (Discussion of whether uncertainty affected investment in this post.)
So, too soon to declare an investment boom. It may be that Kudlow’s prediction for a post tax-cut boom will come to pass, but there’s a long way to go to have a resurgence in net terms.
Menzie
Your statement that the current uncertainty is at elevated level is not true if you look at the Daily EPU 7-day moving average.
By that calculation the current value of less than 100 is substantially less than 14 separate years of computation.
Slightly larger than 15 separate years of computation and approximately the same as 1 year.
By this yearly standard the current daily EPU is not elevated but very much middle of the road.
Howeve, looking at the Monthly EPU, your description of elevated level is true except for what you did not describe.
Looking at your chart (fig. 1) in topic “Comovement in Economic Policy Uncertainty” the Monthly Uncertainty value has been essentially flat in years 2016, 2017, tp present 2018.
By looking at PolicyUncertainty Monthly chart it is clear that the average value of 2014 and 2015 was less. And 2010, 2011, 2012 and 2013 the average value was the same to slightly higher than current value. From 2009 to the beginning of the computations shows present value as elevated.
So the current Monthly EPU is at an elevated level, but it has been at this elevated level 7 out of the past 9 years. The elevated value is better described as normal for about the last decade.
Perspective, Menzie
Ed
The boys in the White House NEC are going to all chip in to get Larry Bud Kudlow a cheeseburger for lunch. Plus, if Larry Bud Kudlow is a good boy, he gets his breathing hole enlarged. But Kudlow says the post tax-cut boom is “real”, just like this arctic wasteland:
https://www.youtube.com/watch?v=XxXfay3hVDY
You read certain authors of books again and again, watch the same talk show hosts nearly everyday for years, or read a bloggers posts over multiple years, and you get to feel you “know” them (even though you don’t). Menzie quoting Newsmax website. That’s a new one. (teasing)
“As capital expenditures have skewed more toward information and communication technology (ICT) equipment and software, the pace of capital depreciation has accelerated.”
An excellent point. So what we have is a depreciation boom!
pgl: Because nominal ratios wouldn’t take into account the very rapid pace of price reduction in capital goods, especially associated with ICT (the original impetus for switching from implicit price deflators with base years to chained indices).
Thanks Menzie. I had tried to post the following earlier:
“www.bea.gov provides us with:
Table 1.7.5. Relation of Gross Domestic Product, Gross National Product, Net National Product, National Income, and Personal Income
GNP – depreciation = NNP. One can look at the ratio of depreciation/NNP over time. Back in 1998, this ratio was only 16.8%. In 2017, it was 18.3%. Of course by comparing the ratio of nominal amounts, I have ignored any relative price changes which could be important.”
Good thing for me that my computer balked!
“’t show I/K or I/GDP because all series expressed in Chained dollars, and ratios of such are not meaningful”.
Why not show the ratios in terms of nominal dollars?
@ pgi
If I remember correctly, Menzie said something about the chains making the numbers “more off” (farther away from reality) over time. This is common economics orthodoxy (or math reality, however you wanna view it). My higher level math is not the greatest, so Menzie may want to correct me on this.
@ pgi
I read this post LATE last night, but I just noticed again, Menzie addresses this question very directly in his post, where he links to another post that explains this very well. He links to another post by Whelan. I haven’t got around to reading Whelan’s post yet—-but Menzie putting that Whelan link up shows you what a great teacher Menzie is. My guess is, if you read that, you’d be just about ready to do your Phd dissertation on this individual topic.
Now that you have the net series divided it my private sector employment to get the capital stock per employee.
Next, compare the change in this series lagged one year to the change in productivity.
Menzie
Question. Is apparent change, i.e. leveling off, of net investment affected by the recent years of tax changes which have accelerated depreciation? In attempt to make my inquiry clearer, I will ask it differently. The fact that business has been able to book more depreciation per year recently than relative to historical amounts due to tax changes (made since the great recession), could this account for the apparent leveling of net investment?
Ed
The dominant reason depreciation is greater is the shorter life span of high technology equipment, not changes in the tax code.
We have had accelerated depreciation since the 1960s.
Thanks for stating that. Had Ed spent 3 seconds on Google, he could have found this document from BEA on how they estimate economic (not tax) depreciation:
https://www.bea.gov/national/pdf/BEA_depreciation_rates.pdf
“…the shorter life span of high technology equipment….” Except for the IRS: https://www.msn.com/en-us/news/us/irs-it-struggles-spotlighted-by-recent-meltdown/vp-AAw2kVp
But the government isn’t alone in that respect. I’ve seen how the automotive “Big 3” in Michigan just hates to invest in new computer systems and top level IT people. It’s always seen as a cost rather than an asset.
To my point about us having a depreciation boom. Depreciation is a cost which Team Trump in their utter ignorance is bragging about increasing!
Bruce Hall The IRS is not the only entity to experience IT problems, but it turns out that fixing those IT problems is orders of magnitude more complicated than anyone in the private sector ever imagined. It’s the same problem that with air traffic control IT systems as well as the DoD IT systems. There are two huge problems. The naïve approach pushed by Congress and big firms like Oracle and SAP was to replace organic IT systems with commercial ERPs. Sounded simple enough. Except that it turns out that many of the business rules that apply to government do not apply to the private sector…and those unique business rules are not arbitrary. Most of them are enshrined in law and have a solid rationale behind them. So that means you have to do a lot of custom coding within the ERP. Very expensive and very tricky. The other problem is that most of the organic legacy systems were written in some early versions of COBOL or FORTRAN (back when it was spelled FORTRAN rather than Fortran!). Good luck finding COBOL and FORTRAN programmers today. So it has been a real challenge understanding what’s going on deep inside the guts of those programs. The folks who knew have all retired.
The IRS, air traffic controllers and DoD have all tried the ERP approach. In the case of the IRS and air traffic controllers the ERP solution was a disaster and could not be deployed. They spent billions on ERP solutions that didn’t cut it. And the Army, Navy and Air Force all switched to ERPs with little success. The Army spent billions developing a commercial ERP that was so bad they ended up paying the IT integrator almost a billion dollars just to get out of the contract. The ERP solution completely failed to pass the government’s own financial integrity requirements that it imposes on private sector companies under Dodd-Frank. Now the DoD departments are just limping along with half bastardized ERP systems that provide less than 70% of the functionality covered by the old legacy systems. And they crash…a LOT. And they are very slow because of the security requirements since the government doesn’t “own” the data. And all this at more than twice the annual cost. It’s hard to overstate just how much of a disaster the ERP approach has been for the government. But the US government cannot say they weren’t warned. The Australian government tried going down the ERP approach and warned us that it would take at least a decade to develop before deploying. The Aussies were right.
Menzie doesn’t ban the bums that pollute the comments, but, then there are your comments. So, I still come by and read now and then. Thank you for sharing.
As a businessman, I have explained before that lower taxes discourage investment and encourage profit taking. When taxes are high, the best way to avoid taxes is to spend earnings on increased capital equipment and new hires to grow the business. When taxes are low, it’s a great time to take profits out of the business and pay it to owners. Lower taxes are a much easier way to increase returns to owners than the hard work and risk involved in growing a business.
Good news from the Senate – Senator Grassley grows a spine:
https://talkingpointsmemo.com/dc/grassley-move-forward-mueller-proection-bill
He says he could care less what McConnell thinks and his committee will send forward a bipartisan bill to protect Mueller.
That’s just grandstanding by Grassley. He knows with the investigation proceeding the wind is going to shift directions, and Grassley is shifting his weight because his footing is no longer so secure. It’s not “growing a spine”. It’s putting saliva on your index finger, holding that finger up and sensing which way the wind is blowing.
Under Trump, there’s a resurgence in the Capacity Utilization Rate, although still historically low:
https://fred.stlouisfed.org/series/TCU
There may be excess caution, to invest, because this is the second longest economic expansion in U.S. history at 106 months (the Bush expansion from 1991-2001 at 120 months is the longest).
“Under Trump, there’s a resurgence in the Capacity Utilization Rate”.
It is only 78% now. It was near 80% under Obama in 2014. But nice try there KellyAnne!
Then, it fell to 75 under Obama in 2016 – but nice try Rachel Maddow.
“Nice try there KellyAnne!”
That is the funniest one you have told on this blog and that gets a 5-star rating from the judges.
Me and Rachel Maddow take a bow!
Wow! This is so typical of Pgl’s attempt to make a meaningless point: “It is only 78% now. It was near 80% under Obama in 2014. ” In pgl-world 78% is far from almost 80%.
Splitting hairs or just so important?!? to make a meaningless point.
“the Bush expansion from 1991-2001 at 120 months is the longest”.
Let’s see – Bush41 gave us that recession in 1990 and Bush43 followed his father’s lead in 2001. Of course the resident of the White House for 8 years in between was Bill Clinton!
Peaky – this kind of incompetent spinning is going to get you fired from the Trump press corp.
Economists name trough to peak expansions after Presidents, like the Kennedy expansion and the Bush 41 expansion.
Of course the rest of us know that the high growth years occurred when Clinton was in the White House. But if you to pretend Barbara Bush was the First Lady when we had a special prosecutor looking into the President’s hanky panky, so be it.
Peaky tells more lies than Trump:
“Economists name trough to peak expansions after Presidents”
Here is the official source on dating business cycles:
http://www.nber.org/cycles.html
Note the economists do not name these things after Presidents. Another day – another stupid Peaky lie.
Pgl and her eis another reference on how some label economic periods. Presimetrics. https://www.amazon.com/Presimetrics-Facts-Presidents-Measure-Issues-ebook/dp/B0041IXRWA/ref=sr_1_1?s=books&ie=UTF8&qid=1524222712&sr=1-1&keywords=presimetrics
I’m sure you remember Mike’s testing of his analyses over at AB, unless that was another period when you had been banned for bad behavior.
PeakTrader So does that mean we should talk about the Ford expansion? Hmmmm….never thought of it that way.
It’s also worth noting that an increase in the depreciation rate has a big effect within the Solow style growth model because it affects the slope of the breakeven line.
It depends on how the model is specified. One could so this in net national income terms if one insists.
BTW this issue became a hotly debated topic between critiques of Piketty v. his main defender on this score Brad DeLong. James Hamilton tried to shed some light through all the heat:
https://econbrowser.com/archives/2014/06/educating-brad-delong
I’ve always felt that Piketty had the Harrod and Domar models in mind rather than the Solow-Swan model. In fact, if you follow his references he links to Harrod’s and Domar’s papers. He also cites them on pages 230-231 when talking about his fundamental law.
That’s a great comment and “back and forth” between pgi and 2slugbaits , thanks for sharing that link.
I have Piketty’s book, let us say a “hardcopy” version I acquired very cheaply through “creative means”, and am extremely ashamed to say I’ve probably only read about 5 pages or something. I’m sure the book has some errors—but I still think the book must be educational in many ways.
I like Brad Delong, and I like his blog as well. However I think when we become so married to an ideology, that we lose intellectual rigor, it serves absolutely no one. What Delong drifts off to sometimes is the Ivory tower version of FOX news. I am saying this as a Democrat. I think (someone can correct me if I’m wrong) Chinn and Hamilton are also leftward leaning on their politics (I’m not as familiar with Hamilton’s writings). So when Hamilton goes after Delong it says something. If Delong wants to scream to the world he is on the ideological left that’s fine and there is no sin in that. However, less conjugal visits to the Economic concepts in peer review prison might be in order for Delong.
You may be thinking about this lecture:
https://www.mruniversity.com/courses/development-economics/solow-model-2-%E2%80%93-comparative-statics/contributions/solow-model-problem
Of course the lecture assumes a fixed gross savings/GDP ratio.
Yes. That’s the basic Solow model I had in mind. Fixed savings/GDP ratio, exogenous saving, blah, blah, blah.
The stagnation of real net investment is pretty spectacular–thanks for the figure! There seem to be two views. One is that its just the result of slow growth of demand and the accelerator effect. Even left or progressive economists like Dean Baker have taken that view. The other is that there has been a sea-change or structural shift in the investment function, perhaps driven by financialization. That’s more a left-Keynesian view (which I share) but orthodox researchers like Kamin and Gruber have offered support. What are your thoughts?
The issue of falling prices for IT equipment has an interesting impact on the industrial production data.
They reweight the industrial production data every year by its nominal weights. But if you get a situation
where information tech grows some 10% while overall industrial production expands 2.5% but info tech
prices fall 15%, its weight in industrial production will fall. So you have a situation where the fastest growing sector in
industrial production has a falling weight in the index.
I can understand why they weight by the nominal values, but does this mean that the growth and size of
industrial production is understated? I’ve never been able to reach a satisfactory answer to this question.