From the recent CBO Budget and Economic Outlook, the projected current account and implied cyclically adjusted budget balance.
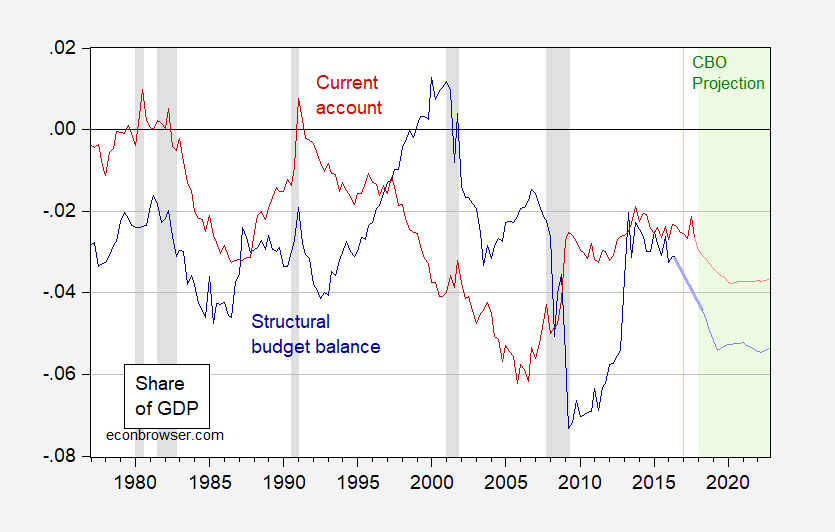
Figure 1: Structural/cyclically adjusted Federal budget balance (dark blue), and current account balance (dark red), both as a share of GDP. NBER defined recession dates shaded gray. CBO projection period shaded gray. Projection of structural budget balance estimated by author using June 2017 estimate, adding in legislative changes reported in CBO (2018). Source: BEA 2017Q4 3rd release, CBO (2018), and author’s calculations.
So, the twin deficits re-appear, as many of us had predicted. Interest rates rise as fiscal policy collides with tighter monetary policy. Today, the IMF released its forecasts in the semi-annual World Economic Outlook, the CBO forecast for the current account deficit is slightly larger than the IMF: 755 vs. 727 in 2019.
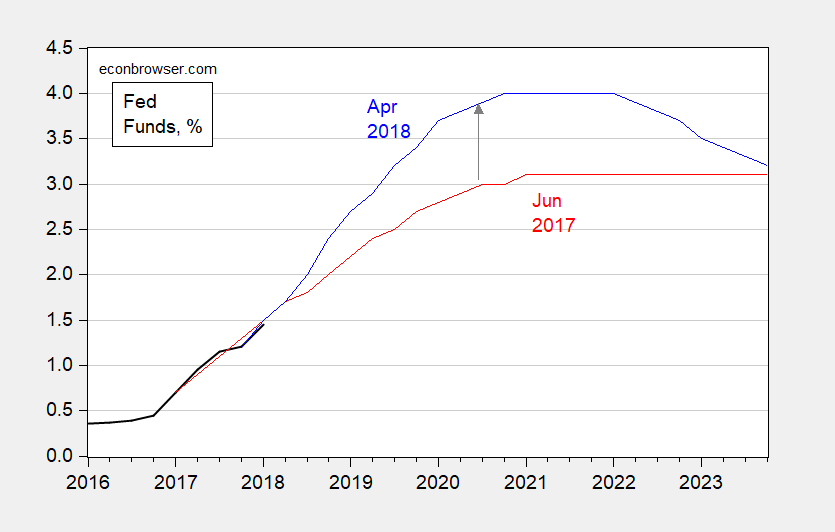
Figure 2: Fed funds actual (black), CBO June 2017 projection (red), CBO April 2018 projection (blue). Source: Federal Reserve via FRED, CBO (2018), CBO (2017).
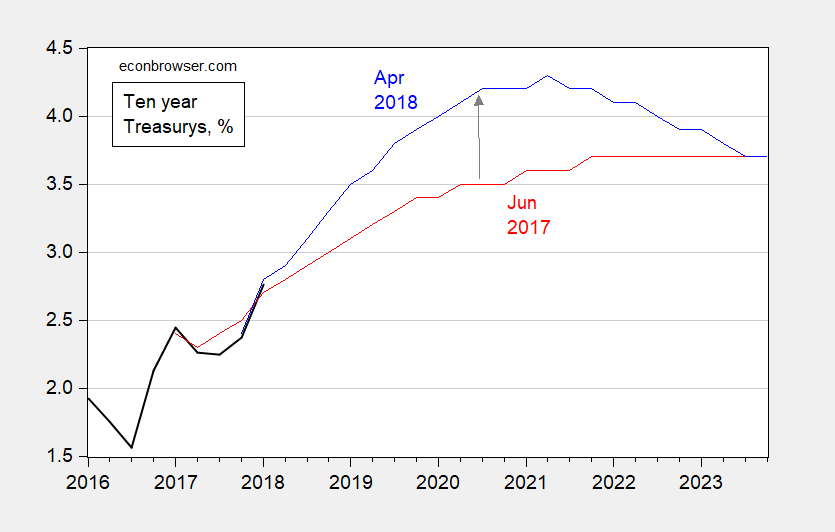
Figure 3: Ten year constant maturity Treasury yields actual (black), CBO June 2017 projection (red), CBO April 2018 projection (blue). Source: Federal Reserve via FRED, CBO (2018), CBO (2017).
In the standard story, the dollar would appreciate. Figure 4 displays the projected trade weight dollar normalized to 2017Q1=0 (in logs), so the dollar is weaker.
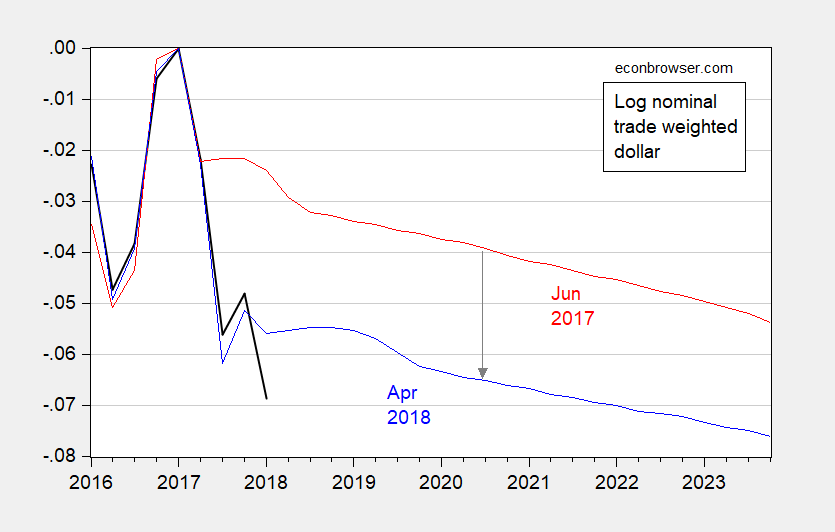
Figure 4: Log nominal trade weighted dollar (black), CBO June 2017 projection (red), CBO April 2018 projection (blue), all normalized to 2017Q1=0. Source: Federal Reserve via FRED, CBO (2018), CBO (2017).
However, most of the change is due to the surprising weakness of the currency over the course of 2017; normalizing to 2018Q1=0, the CBO projects an appreciation — albeit modest — due to the policy mix.
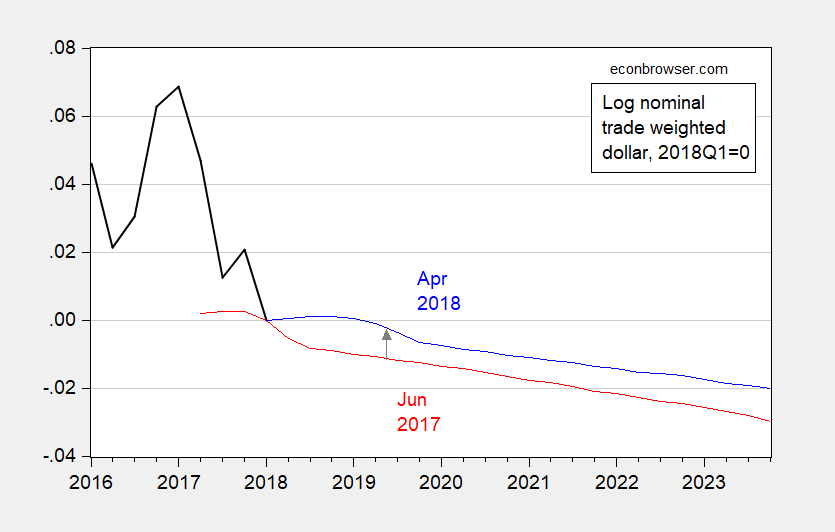
Figure 5: Log nominal trade weighted dollar (black), CBO June 2017 projection (red), CBO April 2018 projection (blue), all normalized to 2018Q1=0. Source: Federal Reserve via FRED, CBO (2018), CBO (2017).
(Table B2, page 115 of CBO (2018) indicates a 1.7% appreciation relative to baseline due to the tax legislation).
Interestingly, Goldman Sachs‘s assessment of the twin deficits (March 13) is that capital mobility might be much lower (actually that foreign investors and central banks will be less willing to finance our current account deficit; should that be the case, more domestic crowding out of investment will occur, and less of net exports).
Maybe it is the German blood in me, but I find myself really liking the “cleanliness” of the link between the budget deficit and the current account balance. I mean I know they are not “in lock step” with one another, but the link seems logical and psychologically “reassuring” somehow.
I haven’t read all of the GS paper yet (if these donuts and coffee work, I will have it read in the am hours here). But looking at the lines criss-crossing each other, it had me wondering “If they are connected, why do the lines end up crossing??” I think the crossing must be (somewhat) connected to the fact that current accounts “reaction” to the budget deficit rising is “latent”. So, it’s kind of like throwing a tennis ball tethered to another tennis ball, they’re not going to hit the ground at the same time, yeah?? Here it would be like if you threw a blue colored tennis ball, and a 10 foot string tied it to a red tennis ball, yeah?? I mean the relationship isn’t the same, but that is kind of one way you could think about it. Maybe the tax policy (revenues) would be like “wind” as you threw the blue ball would affect how closely the red ball follows the blue ball?? “kind of”??
The weirdest part of the graph would be the cross or the “X” around 1997 yes?? I am curious what the main dictating factor was for that “crossing” of the lines.
According to GS, the answer to my question above, about “divergence” (the lines either crossing or moving in opposite directions), is productivity and asset price shocks. This would possibly cause the two lines to move in opposite directions. It seems to work out time wise with the pertaining events of the time. I don’t trust GS on everything, but I think we can strongly believe them on this topic. Might be fun to look up some of these research papers they list also. Cross your fingers.
Republicans do like their structural deficits
I believe, if you check, that we have the largest current account deficit, ex-oil net oil imports, since at least the mid-’70s.
That Kansas moment is fast approaching.
One way to look at it is that equilibrium is when both interest rates and exchange rates are stable.
If the currency is strongit implies that domestic interest rates or too high.
If the currency is weak it implies that domestic interest rates are too low.
The market clearing rate is the domestic interest rate that attracts sufficient
foreign capital inflows to finance the deficit with a stable currency.
Republicans regret tax vote
“I’d say, ‘Hell no. Hell no — double hell no,’ ” retiring Sen. Bob Corker (R-Tenn.), a leading budget hawk, told The Hill when asked about making the individual tax breaks permanent. Corker supported the bill, but last week — citing the deficit — said it could “be one of the worst votes I’ve made.”
I might have more sympathy had the outcome not been so patently predictable.
http://thehill.com/homenews/senate/383663-senate-gop-wary-of-new-tax-cut-sequel
Steven Kopits I suspect that at the time of the vote Sen. Corker hadn’t yet decided on retiring, so he still felt he had to be a team player and he wanted to avoid a primary fight.
He was conflicted as I recall, Slugs. But he caved. This is a truly terrible time for mainstream Republicans. It’s not clear which ideology will come to dominate, that is, is the Republican Party going to be conservative or fascist? Not clear that the Republican brand survives. You could take all those retiring Republicans and form the American Conservative Party just like that, actually.
is the Republican Party going to be conservative or fascist?
I’m guessing that you have Hungary’s recent experience in mind. The quick shift from conservatism to neo-fascism in some of the European countries is alarming. The US is not exceptional and not immune.
I saw that transition in Hungary, yes, and it stems from 2001 — before Orban’s current government took power in 2005. I don’t know that it was quick, but it did occur. I think the election of Trump reflects the same sentiment.
The question is whether this is structural or cyclical. If it’s cyclical, the ship rights itself and we return to more traditional left-right constellations. If it’s structural, then the world has changed somehow and the independent, conservative-leaning suburbanites — and I would count myself among them — really have no political home. I would put Bob Corker in this camp, with the difference that he’s a player on the team and lacks the luxury of talking about issues in abstract terms.
My dates are a bit off. The rightward tilt of Hungarian politics stems from the Gyurcsanyi government, around 2004. Orban took power for the second time in 2010.
Steven Kopits It’s not just Hungary. What I find so disturbing is how the neo-fascist movement has spread so fast to other countries; e.g., Poland, France, Germany and Austria. Even Belgium and the Netherlands aren’t immune. I was watching DW.com out of Berlin earlier and they were reporting on the surge in anti-Semitism in Germany. The opposition Golden Dawn party in Greece is unabashedly neo-Nazi. The other day French President Macron delivered a warning to the EU Parliament about the rise of fascist and neo-Nazi parties all across Europe.
@ 2slugbaits
For awhile now, I’ve thought of you as one of the more intelligent commenters on this site. I expect Kopits to play dumb and clueless, I expect better from you.
https://www.washingtonpost.com/business/economy/last-minute-real-estate-perk-in-tax-reform-prompts-blowback-for-corker/2017/12/18/6be3a9ba-e406-11e7-ab50-621fe0588340_story.html
BTW, I know there were subsequent stories saying “Corker didn’t know, had mo part in this being put in the bill”. He was one of a small handful of holdouts on the bill before that last minute change was inserted into the bill. Now if Kopits is dumb enough to buy that, that fits his usual method. You, I think, can decipher better than that.
Above comment, obviously “mo part”, should be “no part”.
All
Lets look at the numbers and I am basically referring to the numbers from the linked Hill article. CBO estimated the “federal debt will hit $33 trillion in 2028, or about 96 percent of the gross domestic product.” The CBO also estimated “that last year’s tax bill will wind up costing $1.9 trillion”. So here it is presented without the tax bill on an all other things being equal basis. (For perspective this is total debt, the debt held by the public will be around 80%, if anyone cares.)
CBO estimated the “federal debt will hit $31.1 trillion in 2028, or about 93 percent of the gross domestic product.”
Do you really think the political gnashing of teeth and the rending of garments would be any different for 93%? I will answer for you, its a big fat no. This is an election year and the political crap is out in force. This year it is the dems who are party out of power, so they are the budget hawks. It will switch when they again become the party in power, and pass excessive spending bills, and the repubs will be screaming about the growing debt. This seesaw will continue. I have little hope the only element for fundamental change, the electorate, will force responsibility on the appropriators.
One other thing of note, I wrote “on an all other things being equal basis”, and that will not be. Imagine the debt load, which is mostly driven by the mandatory side of spending if the economy grew at the 2016 real GDP growth rate of 1.84% compared to a 2017 real growth rate of 2.59 % or more importantly the 2018 rate which will either confirm or deny the impact of regulation and tax reduction and reform. I predict confirm. The debt load would be substantially worse.
Ed
“One other thing of note, I wrote “on an all other things being equal basis”, and that will not be. Imagine the debt load, which is mostly driven by the mandatory side of spending if the economy grew at the 2016 real GDP growth rate of 1.84% compared to a 2017 real growth rate of 2.59 % or more importantly the 2018 rate which will either confirm or deny the impact of regulation and tax reduction and reform. I predict confirm.”
It is time to fact check the latest ramblings from Ed:
https://www.bea.gov/iTable/index_nipa.cfm
Table 1.1.1. Percent Change From Preceding Period in Real Gross Domestic Product
Real GDP did not grow by 2.59% or more. Try 2.3%. In 2016, it was 1.5% but then we had 2.9% in 2015, which of course contradicts the usual Trump tweet.
p
It just may be your nitpicking self is calculating different, but when I looked a table 1.1.1 the numbers add up to the ones I got from OMB. You know, add up the quarters and divide by 4. I assume you calculate different, possibly fiscal year? You are welcome to show your calculations, but meanwhile I will just assume you are just being your usual stupid self, who would have been smarter to shut up as suggested.
Ed
@ Ed Hanson
The best way to solve these things is providing a specific link, so anyone can see the exact numbers you’re referring to. Or you could handle it like you just did, with zero class.
It’s fascinating how some commenters on this site (you and “rtd” immediately come to mind) expect Menzie to verify his data to the umpteenth ad nauseam degree (which Menzie does to humor you, because of his extremely high personal sense of ethics) but when someone asks you where you got your numbers, you say “well I got it ‘here’, at table such and such” with no referencing link.
Where did you learn proper sourcing and citation of materials, “Trump’s For-Profit Private School for Douches and White Trash”?? “Duuur, yeah, I got it from over here” is not the way you are supposed to site things.
Get a clue Ed. The National Income Product Accounts are published by the Bureau of Economic Analysis (BEA). Their website is free online and quite easy to do appropriate research on. But do your own sources and your own calculations if you must. If you need help – Stephen Moore will assist you.
The difference between 93% and 96% is the result of a set of legislative votes. There is more to policy than cosmetics. A decision was made to cut taxes in a country in which revenue as a share of GDP is low by developed country standards, in which the fiscal deficit is now relatively high by current developed country standards, and in which demographics are on track to add to deficits.
You are essentially claiming that the Republicans and Democrats are indistiguishable in their fiscal performance – a sort of fiscal version of the moral equivalence argument. That’s what defenders of bad behavior tend to do. They claim that everybody is just as bad as their guy. The fact is, Democrats have added far less to structural deficits than have Republicans since Carter. The behavior of the two parties is in no way equivalent. The story you have told is not true. It’s a story that Republican apologists have been telling for decades, so it probably feels safe to tell it, but Democrats are more fiscally responsible than Republicans, and have been for a generation.
“A decision was made to cut taxes in a country in which revenue as a share of GDP is low by developed country standards”.
There are a few conservatives who would be in favor of raising state and local taxes but not Federal income taxes. After all – they claim, our tax code is already taking too much from the rich. Better to bleed the average Joe and poor people than those who shop on Rodeo Drive!
mack
Lets start with the obvious, the difference between 96% and 93% is three percent. The reason either number is so high is the result of a set of legislative votes.
Your words. It is not the result of a single vote.
Actually, I am not claiming that repubs and dems are indistinguishable, the dems are remarkable worse (see my post to “slug and all” under topic “Trump v. Treasury”, currently at the end of comments). But repubs fail at being better they should. The appropriators dominate both parties and they simply refuse to limit spending to revenues.
But I am afraid the story I tell is true, and if you could pull yourself out of your partisan ways, you could look at the numbers and see it my way. And, in case you find it confusing, I am not expecting to go repub, just be more realistic about your dems.
Ed
“Lets start with the obvious, the difference between 96% and 93% is three percent.”
And the kids in your preK class are snickering that you finally figured this out. The rest of your comment really made them laugh.
Ed
US spent $7T thumping sand in desert wars the past 15 years…. how do you suggest entitlements is the issue when the first world devotes half the %GDP to war as the US?
US War is totally discretionary.
Trump and Abe will be talking trade policy in these meetings. What could go wrong?
http://money.cnn.com/2018/04/17/news/economy/abe-trump-us-japan-trade/index.html
Our imports from Japan exceeded $136 billion in 2017 with our exports being less than half of that. We purchased almost $40 billion of Japanese made cars. I wonder how much GM and Ford are lobbying this White House for tariffs.
Some people have a simple interpretation, which party caused structural budget deficits. Carter was a fiscal conservative. Reagan created a V-shaped recovery, cut taxes, increased defense spending, which won the Cold War, and didn’t get the promised domestic spending cuts from Democrats. Bush 41 and Clinton both raised taxes when a strong economic expansion was underway, and the GOP Congress wanted less spending and limited government. Bush 43 cut taxes in 2001 and 2008 in response to recessions, expanded Medicare, and won two wars with nation building, along with the war on terror. The Democrats in Congress created a giant social program in the housing market, which caused the financial crisis and recession. Obama-Pelosi-Reid went on a giant spending spree in 2009-11, till they had “spending fatigue,” which resulted in a weak “recovery” from the severe recession and high national debt. Trump and the GOP Congress stimulus plan is in response to ongoing weak growth. The Republicans want low taxes, defense spending, recognize entitlements are a big problem, and want less government. Democrats want big social programs, higher taxes, are diversed on defense spending, and want big government.
PeakTrader I see your masters in Moscow are working overtime at putting out fake stories. You’re wrong on so many counts that it’s ridiculous.
1. Reagan did not create a V-shaped recovery. The Fed created the recession and the Fed ended it.
2. Increased defense spending under Reagan played next to zero role in ending the Cold War. The Pope did more than Reagan. And you still can’t tell me which weapon systems were developed under Reagan that weren’t already under development during the Ford and Carter years.
3. Clinton and Bush 41 did raise taxes, which helped bring the deficit under control and avoided interest rate hikes. But Clinton and the GOP Congress also cut taxes in 1997 at precisely the wrong time. And that likely contributed to the 2001 recession because it forced the Fed to hike rates.
4. Bush did not cut taxes in 2001 as a response to the mild recession. In fact, Bush 43 specifically and emphatically denied that he cut taxes for the purpose of stimulating the economy. He was pushing his tax cuts long before the economy slid into recession.
5. I am not aware of Bush 43 winning two wars; however, I do recall that he lost two wars.
6. The financial crisis was not caused by Freddie and Fannie. It was caused by you and your criminal friends in the sleazy bank mortgage business and lax oversight by Bush appointed regulators. You might want to try reading Menzie’s book and the lost decades (plural).
7. Obama did not go on a giant spending spree. The stimulus had about $350M in new spending. That was pathetically weak given the seriousness of the Great Recession.
8. The Republicans do want lower taxes for the rich. You’re right there. And they do want increased defense spending, albeit only hardware spending. I don’t sense the same enthusiasm for O&M spending. The Republicans certainly believe entitlements are a problem, but that’s mainly because it means those programs threaten tax cuts for the rich. The Republicans only want less government in the form of a smaller IRS and less regulation that protects the weak. In pretty much every other aspect of life the Republicans want more intrusive government…excepting the right to kill people with AR-15s.
9. I agree that Democrats want more spending on social programs. I also agree that they want higher taxes to pay for that spending. Unlike the Republicans they do not want large deficits that burden future generations.
Hope that clears up your faulty history.
2slugbaits, your assumptions are wrong as usual. Monetary policy is asymmetric – it’s easier to tighten the money supply to cause a recession than easing the money supply to cause an expansion. In Reagan’s case, appropriate expansionary fiscal policy, along with optimism, sparked an expansion, with accommodative monetary policy assistance playing a role.
Reagan had a strategy to end the Cold War – the military build-up, playing poker with “Star Wars,” using the ignorant mainstream media that Reagan is a warmonger, working with allies, including the Saudis, to degrade the Soviet Union’s economy, etc..
Raising taxes when an expansion is underway is counter-cyclical and cutting taxes in an expansion is pro-cyclical.
Bush 43 wanted a permanent tax cut and the timing resulted in a mild recession.
Bush won the wars quickly and decisively – overthrowing the Taliban and Saddam – the occupation and nation building were costly.
Lenders throughout the country took advantage of the naive and poor housing policies of Congress, which promoted “affordable” loans, i.e. loans that weren’t credit worthy. Freddie and Fannie backed those loans, along with “too-big-too-fail.” Also, Congress wanted to replace the Nasdaq bubble with a housing bubble. Lenders provided homes to people, who normally don’t qualify and many used their homes as ATMs.
There was more than one stimulus or spending bill in 2009-11, including on unemployment extensions and food stamps, and additions to the Omnibus bill.
Income taxes are very progressive and transfers are high – there’s a huge transfer of income from the rich to the poor now – tax revenue is too dependent on fewer people.
Hope that clears your ridiculous views.
CBO: Top 40% Paid 106.2% of Income Taxes; Bottom 40% Paid -9.1%, Got Average of $18,950 in ‘Transfers’
December 9, 2013
“The top 40 percent of households by before-tax income actually paid 106.2 percent of the nation’s net income taxes in 2010, according to a new study by the Congressional Budget Office.
At the same time, households in the bottom 40 percent took in an average of $18,950 in what the CBO called “government transfers” in 2010.
The households in the top 20 percent by income paid 92.9 percent of net income tax revenues taken in by the federal government in 2010, said CBO.”
Congressional Budget Office Historical Effective Federal Tax Rates: 1979 to 2006
April 7, 2009
Corporate Income Taxes 2006-Paid by Quintiles:
Lowest Quintile 0.6%
Second Quintile 1.4%
Middle Quintile 3.2%
Fourth Quintile 6.6%
Highest Quintile 87.2%
Top 5% 73.5%
All
There are some who claim to need of links and data from me that, as Menzie would say, a five second google to find. And the funny thing is that the same need of direct link and data is not asked for from one who is either obviously wrong or measuring differently with the same data (but won’t show the calculations) Despite the bias in those who ask, I generally will accommodate reasonable requests.
Was 2017 real GDP 2.6% or 2.3% as some have said (also without showing calculation or a direct link)
Source of data BEA table 1.1.1 “Percent Change From Preceding Period in Real Gross Domestic Product [Percent] Seasonally adjusted at annual rates” (this information can also be found at the OMB and CBO} direct link (or follow pgl link and do three additional clicks. Might be useful if my link fails but if so I won’t know that until this is posted):
https://www.bea.gov/iTable/iTable.cfm?reqid=19&step=2#reqid=19&step=3&isuri=1&1921=survey&1903=1
For 2017 you can read 4 quarters of real GDP growth 1st 1.2%; 2nd 3.1%; 3rd 3.2%; 4th 2.9%.
For the mathematical challenged the calculation of 2017 real growth is (1.2 + 3.1 + 3.2 + 2.9) / 4 = 10.4 / 4 = 2.6%
I will leave it to the rest to calculate 2016 but as a hint it will be 1.85%
I am more than happy to se and learn different calculation that becomes 2.3% but show your work.
Ed
Ed Hanson: Actually, you can’t take the average of growth rates calculated that way, and get the exactly right number. For 2017 q4/q4 growth rate, you need to calculate (Y[t]/Y[t-4])-1. This is 2.58% for 2017. For 2016, it’s 1.84%. (What you did is correct when one uses log-difference calculation as a growth rate).
Menzie
I see what you are saying. Not that I am distaining accuracy, s the error usually so minor for short terms such as a year? And could you direct me to how pgl gets 2.3%?
\Btw I did 2016 the same incorrect way, it just happened to get the same answer.
Ed
Menzie is comparing 2016QIV to 2017QIV annualized flows. That is different from comparing the entire 2016 figure to the entire 2017 figure. Another important wrinkle to quoting growth rates that I thought everyone knew. But then I have overestimated your comprehension of some very basic issues.
“There are some who claim to need of links and data from me that, as Menzie would say, a five second google to find.”
It took me 2 seconds to type in http://www.bea.gov. Moses is right about you.
By quarter, the annualized growth rates were 1.2%, 3.1%, 3.2%, and 2.9%. So yea the arithmetic average was 2.6%. But I thought everyone knew that this overstates the geometric average. Maybe Ed does not realize that one should use the geometric average. You know – this is an important issue in estimating the equity risk premium. For Ed’s education – I have provided a link to Aswath Damodaran’s excellent discussion:
https://papers.ssrn.com/sol3/papers.cfm?abstract_id=3140837
pgl,
my appeal to authority trumps yours. Menzie has kindly calculated 2017 growth at 2.58, not your ridiculous value.
Ed
Ed Hanson: To be clear, pgl has provided an exactly correct measure of y/y growth for annual data (in fact, it is the convention). His value is not ridiculous. I have to teach my undergraduates each year the difference between y/y for annual, y/y for quarterly, and q4/q4 growth rates, when looking at GDP. I’ll do a post on this.
Ed Hanson That’s not how BEA calculates the annual GDP growth rate. Remember, GDP is a flow and what BEA reports each month is the estimated instantaneous flow rate of goods and services produced at an annualized rate. When you go to the BEA sight and set the calculation for annual GDP growth rather than the default quarterly GDP rates, you will get 2.3%. How do they get that number? They take the average 2017 GDP quarterly dollar values and divide by the average 2016 quarterly dollar values, then subtract 1.00. You can easily recreate how BEA does this.
Very basic concepts indeed. I do wish Ed would learn the basics before lecturing the rest of us.
Menzie
I have calculating using your formula you kindly advised until I understood it. I can’t say how much I appreciate even a simple lesson such as the GDP Growth formula. It has been a long time since I used compound interest type formulas. Actual GDP numbers are much easier to find than grow rate numbers. It sure beats averaging quarter to quarter growth numbers. Easier with less rounding errors.
Ed