State level data for GDP in 2017Q4 were released today. This is an opportunity to update the progress of manufacturing value added (as opposed to employment) in Wisconsin after passage of the Manufacturing and Agriculture Credit (MAC).
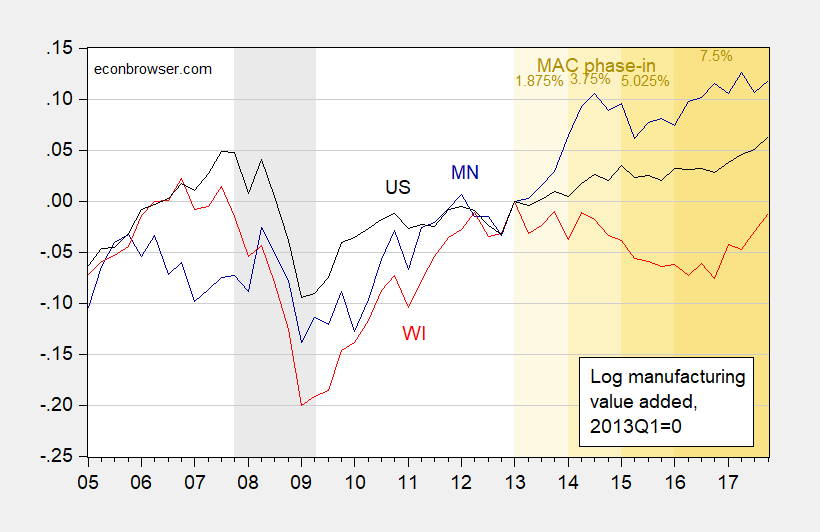
Figure 1: Log real manufacturing output in Minnesota (blue) and in Wisconsin (red), normalized to 2013Q1=0. NBER defined recession dates shaded gray. Orange shading indicates phase in of Wisconsin Manufacturing and Agriculture Credit (MAC), with darkness of color indicating size of credit, in indicated percentages. Source: BEA, accessed 5/4/2018, NBER, and author’s calculations.
Obviously, different things are happening in 2013Q1 when MAC was implemented; however, the fact that Minnesota manufacturing surges while US manufacturing continues to grow as Wisconsin dives is suggestive. As of 2017Q4, Wisconsin manufacturing value added is 1.2% below 2013Q1 levels, and 3.4% below the global peak in 2006Q4. In contrast, nationwide-level manufacturing value added has exceeded the pre-recession peak 4.7%.
Yes, indeed. Things are looking bad for Wisconsin. People are leaving the state as fast as they can. http://www.chicagotribune.com/news/opinion/editorials/ct-edit-exodus-census-illinois-chicago-20180426-story.html . Oh, wait. I misread that. People are leaving Illinois as fast as they can and heading to Wisconsin.
“Census figures show that last year the top moving destinations for Illinois residents were Wisconsin, Indiana, Missouri, Florida, Texas and California. Tax records show similar results.” . And, strangely, they were not leaving for California.
Wisconsin’s unemployment rate is among the worst, oops… 8th best, in the nation at 2.9%. Minnesota is at 3.2% (tied for 12th) so it’s doing okay, too. Manufacturing employment has grown by 2.8% over the last year. But things are too good. https://www.inc.com/walter-simson/when-wisconsins-sizzling-economy-creates-a-crippling-labor-shortage-this-team-attacks.html . Why can’t Wisconsin be like … Illinois? Then there would be enough workers for manufacturing to expand.
Damn that Walker!
Meant to say “strangely they we leave to California”.
Strange because Californians are leaving in droves.
Praise Glod!!!! Housing prices are plunging and maybe my son can afford to buy.
And yet, Bruce, the state population has, according to figures released by Ca. Dept.i of Finance, gained 309,000 residents since last year and has moved past UK as the world’s 5th largest economy.
2,000,000 jobs created since 2009?
There are people leaving, but “in droves” would be questionable. The trend has long been toward higher paying jobs that demand more education/skills with a loss of lower paying jobs that require less education/skills/training.
Just about every place I go, there are”We’re hiring!” Signs all over.
RE prices are still increasing.
This is a few years old but may help explain the divergence between Wisconsin and Minnesota… and it’s not about Walker. http://www.startribune.com/minnesota-and-wisconsin-how-did-two-peas-in-a-pod-grow-apart/295426901/
Related article: http://www.startribune.com/minnesota-and-wisconsin-comparisons/295050821/
The largest companies in Minnesota are:
1. Cargill – International food, agricultural, financial and industrial company
2. 3M – A science-based company that provides products and solutions to customers in numerous industries
3. Medtronic – Products for cardiac and vascular diseases, surgical solutions, diabetes, neurological conditions and spinal procedures
The largest companies in Wisconsin are:
1. Johnson Controls (Milwaukee) – automotive components, and electronics and HVAC for buildings
2. Kohls – retailing
3. Menards – retailing
I’m seeing a qualitative difference.
Bruce Hall Please note that Menzie’s chart showed logged manufacturing value added. At least four out of the six companies you listed are not manufacturing oriented companies, so your list of the largest companies might be interesting, but it’s irrelevant to what Menzie is talking about. Menzie was also referring to “value added”, not gross sales or number of employees.
Also note that up until around 2013 Wisconsin and the US followed the same path. The level for Wisconsin was usually lower, but Wisconsin’s turning points followed the rest of the country. And from about 2008 up until 2013 that was pretty much true for Wisconsin and Minnesota. The divergence does not show up until 2013. Divergence refers to changes in the directions of growth, not the levels of the growth path.
Ah, yes, “value added”. That does tell the whole story, eh? Perhaps all of the factors that I cited were extraneous to value added. But I think that you are smart enough to realize that divergence of fortunes between old line manufacturing that typifies Wisconsin versus the healthcare focused industries in Minnesota can go a long way in explaining the divergence… and that has little to do with the current politics. And, yes, I only showed the top three companies in each state to point out the qualitative differences in employers.
Michigan has benefited from the resurgence of the automotive industry… until now. But things aren’t going to keep going up. Is that a sudden change in policy or government? I think not. But it will show up as a “divergence” from a state that isn’t so dependent on manufacturing products that have global competitors gnawing at the marketplace or one so tightly bound by good economic times.
Wisconsin, by all other measures and when compared with its neighbor one inch to the south that is also locked into old line manufacturing is doing pretty well.
As for California’s population growth. I think we both know where that is coming from. http://www.latimes.com/local/california/la-me-census-latinos-20150708-story.html . Mexico’s loss is California’s gain. But I’m not sure that’s going to be a great thing for its economy, however we can do the California vs. Wisconsin comparison on a number of fronts.
http://fox40.com/2018/04/26/why-more-people-are-leaving-california-than-moving-here/
Bruce Hall Wisconsin, by all other measures and when compared with its neighbor one inch to the south that is also locked into old line manufacturing is doing pretty well.
Again, the post is about value added in manufacturing. And if you go to the BEA site and download the manufacturing data for Wisconsin and Illinois and recreate something that looks like Menzie’s chart, you will see that Wisconsin’s value added fell by 1.2% relative to 2013Q1 while Illinois’ value added increased by 2.5%. The overall pattern of the two states is fairly similar, but at the end of the day Illinois shows positive growth while Wisconsin shows negative growth. So even if what you say is true and both states are “locked into old line manufacturing” (and I don’t know if that’s true or not), the fact is that Illinois is doing a better job of working within that constraint.
Menzie
Haven’t we seen this chart before. And it is just as obvious now as it was earlier the stupidity of phasing tax subsidies. The chart clearly shows that manufacturing in general and at the margin waited until they could get the maximum subsidy to expand and create value added. The sharp rise of your chart after full subsidy clearly shows this is the case.
Ed
Three points. First, the chart does not show a “sharp rise” after the full subsidy kicks in. The chart shows a moderate rise that begins halfway through the point where the full subsidy kicks in. Second, even if what you said was true about delaying investment in manufacturing, it’s pretty clear that this strategy makes no sense because the lost benefit flow is lost forever and the discounted value cannot be recovered at a later date. And that doesn’t even include the substantial risk of higher interest rates if a company decides to wait for the full subsidy. And finally, since when do you approve of any subsidies? I thought you were the one who is always praising the free market. And you’ve always been critical of Big Ag subsidies in farm bills, which is kind of strange because “Agriculture” is literally the law’s middle name. Or are you trying to pretend that spending (bad) subsidies are somehow different than tax cut (good) subsidies? Good luck with that argument. It might be ideologically appealing for some, but it’s economic gibberish.
slug
Sorry slug that is a sharp rise. No need to theorize what makes sense or not, the chart and the timing of the rise speaks for itself. Business do not expand because of theory they do so when the opportunity exists. But there is more than just Wisconsin tax treatment going on. The timing of the rise also coincides with the expectations of a President Trump coming to office. You do not have to approve a policy to evaluate its results, unlike you I try to keep my biases from determining how the facts are seen, certainly I am nor always successful but certainly a better record than yours.
Got that monthly GDP data set for me yet?
Ed
From the Sacramento Bee, 5/5: “California’s exports of manufactured goods in March totaled $10.27 billion, up 3.6% from March 2017. Exports of non-manufactured goods–chiefly agricultural products and raw materials–jumped 21.3% to $2.11billion from $1.71 billion….On a straight dollar for dollar basis, not accounting for inflation, Golden State exporters had their second best year ever in 2017 with shipments valued at $171.93 billion….”
And this: “California now world’s fifth largest economy”. According to data released by U.S. Dept. of Commerce, in 2017, the state’s GSP was $2.747 trillion surpassing the UK’s $2.65 trillion.
Same headline from AP: “The data demonstrate the sheer immensity of California’s economy, home to nearly 40 million people: a thriving technology sector, in Silicon Valley, the world’s entertainment capital in Hollywood, and the nation’s salad bowl in the Central Valley agricultural heartland.
Oh, and re: where population growth is occurring: looking at the cities where growth is most noticeable, a number of them are in high-value areas, including quite a few in the greater Bay Area.
@ Bruce Hall
You say “ ‘Census figures show that last year the top moving destinations for Illinois residents were Wisconsin, Indiana, Missouri, Florida, Texas and California. Tax records show similar results.’ And, strangely, they were not leaving for California….. ”
You don’t even know what you are typing or copying and pasting half the time. I’m going to do something now I have never done, and will never do again. Steal a line from PeakIgnorance. “People are not as dumb as you suppose”. People can often tell by phrasing when something is a “typo”. That was not a “typo”. It was you projecting your own false views into an article which you hadn’t even read what you were pasting up.
“Not Trampis” doesn’t like me saying insults or name-calling on this blog, and I’ve also read some commenter in this blog saying “it’s not Trumpian” to participate in name-calling. And God knows in the year 2018 I don’t want to appear as not “Trumpian”. So Bruce Hall, allow me to write some beautiful sounding Latin to you: Mater tua peperit morionem
Mosie, get a life. I do copy and paste and give a link to the materials. And when I get ahead of myself, I can make a mistake.
You, on the other hand, simply make up crap or reference some YouTube nonsense and attempt to make snide remarks that come across as markedly juvenile. But keep trying. Someday you’ll say something approaching intelligent… as the saying goes, even a blind squirrel…. Meanwhile, it doesn’t appear you are too contagious.
Man, I love the conservatives’ recent obsession about people leaving liberal places in droves.
The one thing they all have in common is highlighting raw numbers without context. When normalized to population, here’s what you find:
Illinois net migration rate was -1.1% for 2016. This is one of the lowest (tied with ND and NY, and ahead of AK). But it’s only 1%.
When you dig deeper, it’s even more interesting. Illinois’ in migration rate was 1.6% and the out migration rate was 2.7%. For comparison, 2.4% of US residents changed states last year. So “People are leaving Illinois as fast as they can” just isn’t true. They’re leaving at a totally average rate. The difference is that fewer people are moving into Illinois.
The same thing applies for California, BTW. The net migration rate is -0.4%, consisting of 1.3% in migration and 1.7% out migration. So, fewer people are leaving California than average.
For comparison, the rates for WI are net = 0.1%, in = 2.1%, out = 2.0%.
F
They are not leaving liberal states, they are leaving high tax states that are likely to soon have even higher taxes. But if you like to think its liberal states, go ahead, it more often a correct designation than not. But remember there is little known correlation of the politics of those leaving.
Ed
Ed,
But you missed the entire point! They’re not leaving high tax states at any greater rates than normal. It’s a myth!
Fewer people left CA than WI!
You know which states have the highest out-migration rates? Not the high tax states.
Alaska: 5.7%
North Dakota: 5.0%
Wyoming: 4.7%
Hawaii: 4.5%
Vermont: 3.8%
South Dakota: 3.5%
New Hampshire: 3.5%
Colorado: 3.5%
Idaho: 3.4%
Rhode Island: 3.4%
You know which have the lowest:
Michigan 1.6%
Texas 1.6%
California 1.7%
Ohio 1.8%
Louisiana 2.0%
Pennsylvania 2.0%
Wisconsin 2.0%
F, if you’re a fan of “The Man Who Shot Liberty Valance,” you’ll understand why Ed is wholly into myth. (“This is the West, sir. When legend becomes fact, print the legend”)
I would add: recent population data from Ca. Dept. of Finance shows population increases in the very red counties of Placer and El Dorado. Likely because both are situated in the metro Sacramento area with close proximity of state government and a growing tech sector with plenty of jobs spilling out of the BayArea.
Conversely. with an exception here and there, the very, very red counties to the north and northeast are indeed losing population. One notable exception is Lassen County–a right wing hotbed–where 60+% of those employed are employed by either the local, state, or federal government. It never hurts to rely on a community college, a couple of prisons, and a national park for jobs.
F
Outmigration is not the statistic in discussion, it is net migration and usually the raw numbers. It tells a better story. The tale will be told by the next census. California is on the bubble to lose a seat in the House.
Ed
It’s only the story because you say it is. Give me a good rationale as to why it should be.
Two reasons why it’s not:
1. All the stories say “people fleeing xxx in droves”. Which statistic describes this best, net migration or outmigration? I think the key might be in the word fleeing.
2. Why would you not normalize to state population? Do you really expect that big states losing a lot of people is the same as small states losing a lot of people? Do you really think Wyoming losing its entire population is the same as California losing 2% of its population.
This last bit is a total lie. Why bother lying so blatantly? California is nowhere close to losing a seat in the house. It’s growth rate over the last decade is actually slightly larger than the US as a whole.
No one should listen to people who lie continuously and constantly. Every single thing you typed in response to me has been a baldfaced lie.
F
I agree. Should not have been mislead by bad data. I finally got over to the only reasonable source, the Census bureau and you are right California overall population growth this last decade has been just fine. Thank you for continuing the discussion until you got through to me.
Ed
F
Nothing I wrote to you was a lie, or at least not my lie. But I was wrong. I believe I linked to the sources of what I wrote. Funny thing is, I usually can see what is today’s fake news, because the motive and bias to publish it is obvious. But still can not figure out the motive behind the story of California population drop. And the strange thing, I generally used what is considered liberal sources for much of my posts, so as to get away from personal bias and anti-California sentiment. Oh well, live and learn.
Ed
I do appreciate your apology on this. It’s not easy to admit you’re wrong and it takes guts and you should be commended for it.
On the other hand, I’d take it a lot more seriously if you didn’t make the same kinds of mistakes on the very next post.
F
Her is one link I used about California population decrease. I consider MNNBC liberal source wich at times carry over to Marketwatch
https://www.marketwatch.com/story/with-no-letup-in-home-prices-the-california-exodus-surges-2018-05-03
Headline: “With no letup in home prices, the California exodus surges”
that is one of the many like news items I mistakenly relied on but did not lie about.
Ed