Using today’s state level GDP release, we can assess how highly ranked states like Kansas performed subsequently, as compared to poorly ranked states like California.
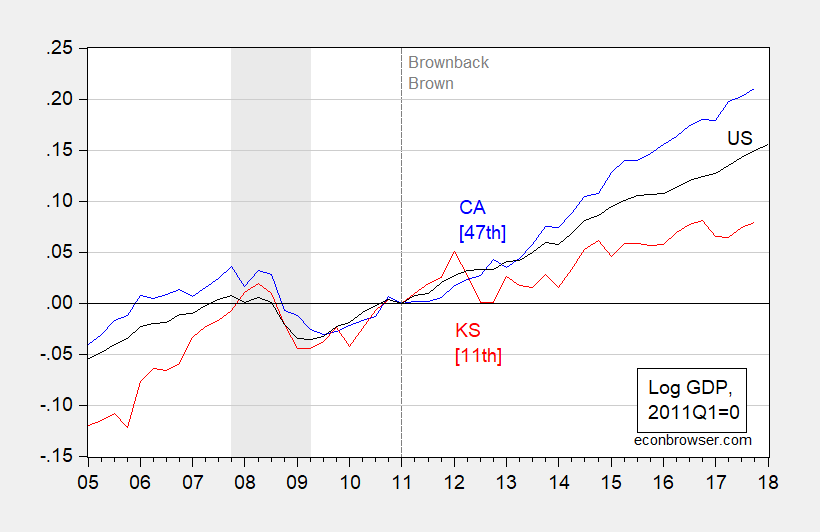
Figure 1: Log California real GDP (blue), Kansas (red), and US (black), normalized to 2011Q1=0. NBER defined recession dates shaded gray. [##] denote Rich States, Poor States 2013 Economic Outlook rankings for 2013 (based on 2012 data). Source: BEA, May 2018, NBER, ALEC, and author’s calculations.
Notice that California was ranked 47th in economic outlook by ALEC’s Rich States, Poor States, 2013, using data for 2012. Hence, this ranking should reflect policies enacted by the Brown administration. Kansas ranked 11th in that year, reflecting 2012 data and policies of the Brownback administration. If one wanted to take into account the tax plan implemented in 2013, one could use the 2014 ranking of 15th.
For a more systematic analysis of the correlation of ALEC RSPS rankings and subsequent growth, see this post.
By the way, no apparent recession in California in the GDP data, at least, contra Political Calculations. The Philadelphia Fed’s coincident indicator for California has risen 1% since December, so apparently growth has continued since 2017Q4. The Philadelphia Fed’s leading indicators indicate 1.37% growth over the next 6 months (non-annualized).
If I got a quarter for each time I dry-gagged hearing “Laffer curve” mentioned at university I’d be somewhere in the bottom rankings of the Forbes list by now.
Still, like the post and the links.
Off-topic post
I want to make it clear I’m not a Marxist as I put this up, because I can predict what some of you will say before you you say it. But this got a good write up at the New York Times and I think it’s worth watching for a number of reasons. The guy who directed it is the same guy that did the well-done James baldwin documentary in the last couple years. If you’re tight on money, you might check your local public library. Especially if you live in a large metro area, odds are better than 50% you can check out the DVD for FREE at your local public library. I should also add, that although I am not certain if this specific movie is available on “Kanopy”, many public libraries allow you to stream a certain collection of films on Kanopy. So you can check the hardcopy DVDs first and then also check “Kanopy” for other stuff. All you need is a library card and a internet connection for the “Kanopy”
https://www.youtube.com/watch?v=Dz-1BLjQlHo
Not that I believe this guy is going to expose all his cards. But it probably behooves Gundlach that if he talks on national TV that he sounds like he knows what he’s talking about. And when it comes to interest rates (and really other market topics as well) it’s pretty tough to beat Jeffrey Gundlach. I know Menzie is a MicroAdvisers fan (and for good reason), but I think I would go with Gundlach (if you could give him truth serum before the interview) over anyone when it comes to interest rates. Of course Gundlach “talks his book”, but overall I think, for a fund manager, he’s a straight-shooter.
https://www.youtube.com/watch?v=4QzJmbo9MGw
I don’t know Laffer is right up there with Marx ( or Hayek for that matter) as a forecaster. All three are believers in classical economics as well.
Speaking of Marx, for all of those anti-Keynesians who post here and who (unknowingly) parrot the Labor Theory of Value, today is the 200th birthday of Karl Marx. Maybe the Internet Research Agency will give PeakTrader the day off.
Nothing wrong with “internet research” (And I know you were referring to the real Russian agency there, I have a copy of “The Red Web” I haven’t finished yet). The problem is people of low IQ not doing their sourcing correctly, namely the quality of sources used. It’s just like the TV. You can watch “daytime” TV, “Ellen” and a bunch of judges adjudicating blacks and white trash issues, and “Reality Skanks of MetroCity”. Or you can watch PBS, C-SPAN, “Talks at Google”, TED talks, “Homeland”, movies labeled “fresh” by Rotten Tomatoes. etc. There’s nothing wrong with being online and learning online. It’s hanging out by the vats of sewage where you get into trouble. Losers sourcing from Alex Jones doesn’t make the internet a bad place anymore than FOX news makes all TV garbage by extension. If “the masses” crave crap, that is exactly what will be offered on the restaurant menu. Alex Jones doesn’t live in a vacuum, someone is buying his non-flouride toothpaste, carny conman “supplements”, and t-shirts. If they stopped buying Alex Jones carny medicine tomorrow he’s be gone inside of 6 months. Blaming the medium of communication really does nothing.
Here is Delong’s post on Marx: http://www.bradford-delong.com/2018/05/warning-reading-marxs-capital-can-introduce-serious-bugs-into-your-wetware-hoisted-from-2006.html
And tomorrow will be Freud’s 162nd birthday. Put Marx and Freud together and you get Herbert Marcuse…damn interesting and damn wrong.
Arthur Laffer’s RSPS Economic Outlook Ranking strikes me as even more GIGO (garbage in garbage out) than Bloom’s EPU index. OK – I’m sure CoRev would agree?
All
Speaking of Art Laffer, he had some influence during the President Reagan’s terms, but more importantly he learned from results of supply-side policy of the time. From previous post by me, I met some skepticism that we are trillions of dollars better off because of President Reagan’s supply-side, pro-growth policy. So here goes why I think so in numbers.
This purpose of this post is to answer the questions about how important President Reagan was for today’s well being. To answer that question I compare the two terms of President Reagan to the two terms of President Obama by respective growth of GDP. Both Presidents had to deal with severe recession in the first years of their Presidencies. The numbers I use are from the quarter they were inaugurated to the quarter in which they left office. For purposes of this post I use data from FRED – Gross Domestic Product (GDP) Billions of Dollars, Seasonally Adjusted Annual Rate.
https://fred.stlouisfed.org/series/GDP/
Relevant numbers from FRED (billion $ SAAR)
1981 1st quarter GDP $3,131.799
1989 1st quarter GDP $5,527.352
2009 1st quarter GDP $14,383.885
2017 1st quarter GDP $19,057.705
2018 1st quarter GDP $19,965.326
Monthly GDP growth over the two terms of President Reagan
ReaganGrowthRate = (5527.352 / 3131.799)^(1/32) – 1 = 0.0179
Monthly GDP growth Over the two terms of President Obama
ObamaGrowthRate = (19057.705 / 14383.885)^(1/32) – 1 = 0.0088
As can be seen, President Reagan supply-side policy had a substantial greater monthly growth rate than did President Obama’s demand side policy. But let’s see what a difference that makes for all our lives today. Instead of the actual results of President Reagan’s growth policy, lets substitute the results of President Obama’s growth policy to the 1980’s.
What would GDP in 1989 1st quarter be at ObamaGrowthRate of 0.0088?
ObamaCalcGDP = 3131.799 x (.0088 + 1)^32 = 4,145.303
Already it can be seen that GDP 1st quarter of 1989 would be reduced by $1,392.050 billion. That already is quite a difference, but what would that mean to us now. To determine that, take the calculated GDP 1st quarter 1989 using ObamaCalcGDP and apply the known monthly grow rate from 1st quarter 1989
through 1st quarter 2018;
which is:
MonthlyGrowthRate = (19,965.326 / 5,537.352)^(!/!!6) – 1 = 0.0111
Using this real number to the calculated 1989 1st quarter GDP to ObamaCalcGDP would get a today’s GDP of:
GDP = 4145.303 x (0.0111 + 1)^116 = $14,916.711
That is a difference of $19,965.326 – $14,916.711 = $5,048.615
Get that, together we are over 5 trillion dollars richer because we benefited from the results of President Reagan’s policy during the 1980’s and not the results of President Obama’s policy applied to the 1980’s.
Finally, everyone should now realize the consequences of President Obama’s policy which resulted in such mediocre growth during those 8 years. That lower growth exponentially shows up in the out years as lower GDP. That is why the President Obama administration failed us all. And why the revitalized growth so far because of President Trump’s policy gives hope for a better future.
Ed
Ed Hanson You might want to double-check your GDP figures. Hint: they’re wrong. After you fix that problem I’ll tell you what’s wrong with the rest of your analysis.
slug
Never say never, the listed GDP numbers are straight from the linked FRED graph. Mostly, I was looking for an historically quarterly graph with consistent treatment. If you don’t like these numbers please pick your own, preferably quarterly. I believe I know why you are being sly about information, it is because no matter which treatment for GDP figures you use, the President Reagan years will shine, and the President Obama years will show their lackluster performance.
And the conclusion of President Obama will make us all poorer than should be as the years past will remain obvious.
Ed
Ed Hanson Take another look at the GDP numbers you posted. They are NOMINAL GDP numbers. That’s a whopper of a mistake. Second, the 1981 tax bill was supposed to address POTENTIAL GDP. That’s what “supply side” economics debate at the time was all about. In the late 70s the economy was consistently running above potential GDP, which led to stagflation. In the language of the time, the AD curve was creeping up a nearly vertical AS curve, which resulted in the price level rising faster than output. So if you wanted to make a case for Reaganomics, then you really needed to look at POTENTIAL REAL GDP because that better approximates the curve that supply siders had in mind. Third, potential real GDP is a function of capital, labor and total factor productivity. Since it’s unlikely that a President has much influence over the population of working age adults (it’s due to biology, not economics), you really need to adjust potential GDP on a per capita basis. That’s the usual approach when doing growth economics. You also have to look at capital deepening, technological growth and rates of convergence. All of those factors are part of a production function analysis that’s needed to estimate changes in potential real GDP. Fourth, comparing Reagan to the Obama years has the temporal sequence all wrong. And hopefully it’s obvious to you why this is true. If you want to say that Reagan’s brand of supply side economics worked, then you have to compare how per capita potential GDP changed between Carter and Reagan. If it turns out that per capita potential GDP under Reagan was no different than it was under Carter, then it’s hard to say supply side economics did it’s job. Fifth, Reagan’s supply side tax cuts worked faces a major econometric problem; viz., it’s badly overdetermined. Remember, Reagan didn’t just have one major tax bill left unchanged throughout the years. He had at least three. So good luck finding the instrumental variables needed to resolve the identification problem. Sixth, you need to account for exogenous shocks to potential GDP because those are not policy related. There are more things I could list, but my point here is to show you that if you want to do a proper economic analysis, then you need to go beyond a simple high school level approach and try doing real economics. The high school approach might impress the boyz down at the VFW hall, but it doesn’t cut it on an econ blog. Why else do you think Menzie and JDH go to the effort of giving readers a small taste of what real economic analyses look like?
The good news is that you really don’t have to do all of that hard work I listed above. Plenty of gold plated economists and econometricians have already looked at the problem. The econometrics tell us that potential real GDP was essentially unchanged from the late 19th century up until the late 2000s. It’s grown at 2.2% since forever. It was no higher under Reagan than it was under Carter or Nixon or LBJ or Eisenhower or Benjamin Harrison. There was a slowdown that was obvious during the Great Recession. No one disputes that. The question is why did it happen? One of the better analyses is NBER working paper 23543, “The Disappointing Recovery of Output After 2009” by Stock & Watson, et al. I don’t think anyone questions Stock & Watson’s econometric credentials. Anyway, they come to two major conclusions that explain the downward shift in per capital potential GDP: (a) the falling labor participation rate, and (b) a slowing in total factor productivity. But key here is that after decomposing the time series they find that the slowdown in TFP really began several years before the onset of the Great Recession. Notice that the authors are talking about the shift in potential real GDP, so they are not looking at the 2007 collapse in aggregate demand observed in actual GDP. The 2007 Great Recession was a double whammy of a collapse in aggregate demand precipitated by the financial markets and a drop in potential GDP that preceded the Great Recession. There is no reason to believe that 1981 style tax cuts would do anything to address either the slowdown in TFP or increase the labor force participation rate.
Slug
One thing at a time, the numbers are also SAAR and are consistently treated across time. Plenty good enough for a fast study.
Second. Quit saying what is the reason for others action, there are a myriad of others who all an have different reasons of actions. That is what legislation is all about, There was no single purpose for the tax rate cut, but to ignore the supply-side reasons is just a bias that is plainly wrong.
Third thing. No I don’t have to make a case about potential GDP. That is just Sudoku for you econometric types. Following basic principles of allowing more of the fruits of enterprise to remain with the earner will over time expand the economy better than your solution of always raising taxes, or creating redistributive taxes, or plainly just subsidizing non-work, or my current favorite, your insistance that inefficient use of government spending is better than nothing The results of the different approaches about taxation will give econometric types plenty of fodder for their papers. That should be enough because their study of past results is clearly better than their predictive ability of the future, which is poor at best.
Fourth thing. Yes a ‘temporal’ comparison of Obama and Reagan is completely appropriate. Each President’s early tax change is a classic study of supply-side verses demand-side approach. Confirmation that it is appropriate comes from the current tax changes which are supply–side in nature and again have accelerated the economy. Since it is obvious that you don’t want to see the comparison because it is completely clear that the supply-side approach is superior, and brings long term greater wealth to all.
The fifth thing. Quite simply, if President Obama had passed the Trump tax package word for word, his legacy would have been made this time as a positive, but instead, he made his legacy by creating such a poor economic recovery and that legacy, unfortunately will make future generations poorer.
Slug, it is so obvious that you do not want to see the truth. What a shame that is. Because it would be so painful for you, tell you what, give me any historic monthly GDP statistics you wish and I will run the numbers. The only thing I ask is the numbers are given consistent treatment, and my limited software can access it. The interactive graphs at FRED would do just fine.
Ed
Ed Hanson The numbers being SAAR is nice, but completely irrelevant. There’s a reason why economists use REAL GDP numbers rather than NOMINAL GDP numbers. It should be obvious enough, but in case it isn’t Menzie has pointed this out enough times that you ought to be aware of why the difference matters.
One thing is very clear, and that is that your understanding of supply side economics is many orders removed from the supply side discussions among actual economists in the late 1970s and early 1980s. At best you seem to have embraced the “Economics for Dummies” version put forward by Jude Wanniski in WSJ op-ed pages. Frankly, even academic economists who supported Reagan and went to work for him regarded Wanniski’s version as embarrassingly stupid.
I’m sorry that you don’t understand why potential real GDP is key. In the grown-up version of supply side economics the objective was to push out the AS curve, and that means increasing the growth rate of potential GDP. Do you understand that business cycle macro is about minimizing the deviations of actual GDP from potential GDP and growth macro is about the growth rate of potential GDP? When I referenced the need for an “instrumental variable” did you have any idea what I meant or why that’s important? If I used the words “simultaneous equations bias” would you understand what I meant? You tried to present what you thought was an intelligent econometric argument for supply side economics; but what you ended up making a complete hash of it.
And BTW, FRED GDP data is not monthly; it’s quarterly or annual.
A little addendum to my story about the phrase “missionary work among savages.” Prof. Charles V. Hamilton had another favorite line. He liked to point out that President Richard Nixon always bragged about how he, unlike JFK, was a self-made man. Hamilton observed that Nixon the self-made man should serve as a warning about the dangers of unskilled labor. To me it’s pretty obvious that Hamilton’s warning applies here as well; viz., an active interest in political economy without the formal training in economic tools can be dangerous.
Ed Hanson Just to demonstrate how braindead your “analysis” is, let’s go ahead and use your approach. Taking the ratio of 1989Q1 GDP to 1981Q1 GDP, then taking the 32nd root and subtracting 1.00 we both get a quarterly growth rate of 0.0179. We agree. Now apply the same approach to Carter’s term. Take the ratio of 1981Q1 to 1977Q1, then take the 16th root and subtract 1.00. The Carter quarterly growth rate is 0.0287, which is 60% greater. So using your own “logic” it turns out that Carter’s economic regime outperformed Reagan’s supply side approach. The obvious conclusion is that supply side tax cuts hurt economic growth.
Still believe your “analysis” was sound??? Still don’t see the first of many problems with your analysis?
slug
Right about the quarterly data. But still waiting for you to link to your favorite GDP data covers the years 1980 through 2018 or so, with a consistent treatment through the years and, yes, quarterly.
Ed
You have a point? If you can find nominal GDP data on Fred, you can find real GDP data.
“Speaking of Art Laffer, he had some influence during the President Reagan’s terms, but more importantly he learned from results of supply-side policy of the time. From previous post by me, I met some skepticism that we are trillions of dollars better off because of President Reagan’s supply-side, pro-growth policy.”
Pardon my interruption of your revisionist history but the good thing about the Reagan White House is they stopped listening to Laffer’s nonsense eventually. Martin Feldstein and William Poole were brought into Reagan’s CEA in 1982 to clean up the Laffer disaster. OK it took Feldstein a few years to get his 1986 tax reform past but that legislation was far better than the stupid 1981 tax cut.
Why do I call it stupid? Well it is well established that the initial Reagan fiscal stimulus lowered national savings driving up real interest rates and reducing investment demand. That was anti-growth. If you read Greg Mankiw’s initial macroeconmic text – you will see a great discussion of this. It was also stupid as the tug of war between Reagan and Volcker at the FED massively appreciated the dollar reducing net exports and leading to a massive recession. Yes the recession was reversed after 1983 when the FED eased up.
But Laffer’s advice was a disaster. Fortunately Reagan finally had the sense to stop listening to this clown..
“President Reagan supply-side policy had a substantial greater monthly growth rate than did President Obama’s demand side policy..”
Utter gibberish. Try comparing population growth rates across time periods. Try modeling the rate of capital accumulation as well as the rate of technological progress. In other words, do a standard neoclassical production function approach. Brad DeLong can help you out here as he is presenting his notes on the Solow growth model.
This is how real economists do this. Hint, hint, Laffer, Kudlow, and Moore are not real economists. So spare us with your amateur attempt to justify the intellectual garbage from the Three Stooges.
Pres. Reagan tripled the federal debt by running record deficits for years, which is exactly a Keynesian solution to recessions. Reagan, until the 1950s, was a very liberal Democrat who learned from FDR how to counteract a recession/depression.
Pres. Obama reduced the federal budget deficit by 75% (as a percent of GDP) from FY 2009 through FY 2015 during a recovery from the worst recession since WW II—something that was never done during any previous recovery. Even Pres. Hoover increased the deficit during the Great Depression from FY 1931 through FY 1933.
So Obama was arguably more of a fiscal conservative than Hoover. Obama was very proud of the fact that he had reduced the deficit, just as he promised in April, 2009, even as hundreds of thousands of jobs were being lost during the Great Recession.
“We came into office facing a budget deficit of $1.3 trillion for this year alone, and the cost of confronting our economic crisis is high. . . But we can’t settle for a future of rising deficits and debt that our children can’t pay. All across America, families are tightening their belts and making hard choices. Now, Washington must show that same sense of responsibility.” President’s Weekly Address, 4/25/09.
No the Reagan fiscal stimulus was NOT Keynesian. It is Keynesian if you have a liquidity crisis or even if monetary policy is impaired. Neither was occurring when Volker was at the helm.
I do remember Volker being bad mouthed at the Reagan White house because he wanted to get inflation below 4%.
Tramp
Your memory may be correct, I became quite suspicious of Stockman and still am, but I can tell you one thing, it never came from President Reagan. So any criticism was nothing more than noise. President Reagan had a strong sense of long term benefits to the country, rather than the typical politician of anything for the next election cycle.
Ed
How is reducing national savings beneficial for the long-term. His 1981 tax cut did that which reduced investment as well as led to largue current account deficits. This is the simple reality you just keep ducking.
This purpose of this post is to answer the questions about how important President Clinton was for today’s well being. To answer that question I compare the two terms of President Clinton to the two terms of President Reagan by respective growth of real GDP. Both Presidents had to deal with severe recession in the first years of their Presidencies. The numbers I use are from the quarter they were inaugurated to the quarter in which they left office. For purposes of this post I use data from FRED – Real Gross Domestic Product (GDP) Billions of Dollars, Seasonally Adjusted Annual Rate.
https://fred.stlouisfed.org/series/GDP/
Relevant numbers from FRED (billion $ SAAR)
1981 1st quarter GDP $6,635.726
1989 1st quarter GDP $8,697.711
1993 1st quarter GDP $9,424.065
2001 1st quarter GDP $12,643.283
Monthly GDP growth over the two terms of President Reagan
ReaganGrowthRate = (8697.711 / 6635.726)^(1/32) – 1 = 0.0085
Monthly GDP growth Over the two terms of President Clinton
ClintonGrowthRate = (12643.283 / 9424.065)^(1/32) – 1 = 0.0092
As can be seen, President Clinton’s liberal policy had a substantial greater monthly growth rate than did President Reagan’s demand side policy.
Prof Chinn, Please write some “FAKE” economic stories about Kalipornikateya!!!!!! There are just too many outlanders here now and more and more need to leave driving down house prices so my son can buy one.
Having wasted my time Googling Kalipornikateya which brought up nothing, may we ask what on earth are you babbling about?
Some folks call California Kali or Cali but I like Kalipornikatya.
Jess so outsiders don’t know the derivation of my Kalipornikateya here is the Wiki that lead to my use: https://en.wikipedia.org/wiki/Californication
Actually sounds like an early Schwarzenegger pronunciation. Pre gubernatorial, of course.
‘ a 1999 album by the Red Hot Chili Peppers’/ Californication is a classic.
Perhaps, one of the reasons middle class house prices in California remain high is Vietnamese are buying houses and two or three Vietnamese families move into one house. Also, I knew, a Caucasian family that worked at Lowes. Five people lived in one house and each one earned around $11 an hour at Lowes. So, that’s $55 an hour for one household. Of course, there’s also a flood of immigrants from Central America and Mexico, to where there are more Hispanics than white people in California now and over 50% of public schools are Hispanic children. Most of those immigrants haven’t completed high school, many not even eighth grade, and many don’t speak English. Since, they’re low skilled and low income, they require government services – education is particularly expensive. However, the sheer volume of those low skilled immigrants and their children should keep housing prices high. Fortunately, California has lots of high skilled people too, including Asians, along with many high skilled industries and tourism.
PeakTrader: What is it about you and the Vietnamese? You wrote in January:
I look forward to more stories about “the Vietnamese”.
Menzie Chinn, why should I ignore what’s happening in Orange County California, where there’s now a large Vietnamese presence and cultural change? And, “Little Saigon” doesn’t bother me – it’s just an observation.
Of course, there were the five Hispanics, I suspected were illegal immigrants, who lived in a tiny room in a hundred year old house near the Embarcadero in Oakland, and had to share the bathroom with two other room renters. Each morning, all five would together ride their bicycles, apparently to work, and all five would ride their bicycles back together late in the afternoon. It seemed to be quite a logistical problem how five people could live in a tiny room with their bicycles.
PeakTrader: Yes, I remember those too, including March‘s.
Reminds me of the days when welfare queens were buying up all the Cadillacs, making it hard for regular folks to buy them.
I bet you also have one black friend – likely Kayne West.
@ Menzie
Menzie, whatever you do, don’t share these links with PeakIgnorance, you’d ruin the tiny little playworld that he lives in, and it will no longer be fun for him playing with his Trump dolly:
http://www.faculty.umb.edu/lawrence_blum/courses/CCT627_10/readings/kasinitz_children_of_immigrants.pdf
https://s3.amazonaws.com/academia.edu.documents/34374384/SakamotoGoyetteKim2009ARSSocioeconomicAttainmentsAsianAmericans.pdf?AWSAccessKeyId=AKIAIWOWYYGZ2Y53UL3A&Expires=1525552510&Signature=AiwTr1bziz6mQMyXamekalC%2Fz2s%3D&response-content-disposition=inline%3B%20filename%3DSocioeconomic_Attainments_of_Asian_Ameri.pdf
Sharing those links with PeakIgnorance could be a very traumatic experience for PeakIgnorance. The nurses in the facility PeakIgnorance is a resident at say this calms PeakIgnorance before his evening mealtime:
https://youtu.be/Ug20llEJpvY?t=1m23s
I am “preaching to the choir” by putting this as a “reply” to Menzie, but I thought this was well written. “CityLab” is apparently an “offshoot” or “branch-off” of “The Atlantic” magazine (who outside of their former hosting of Megan McClueless’ blog, are a decent publication)
https://www.citylab.com/equity/2016/09/higher-prices-or-native-flight-how-immigrants-affect-housing/501845/
If you are to believe what is written here (and I am oversimplifying the author’s work) the main “victims” of immigrants’ and blacks’ demand on housing are those who already live in affluent areas. Those who are affluent tend to be more mobile and are often moving (selling property) of their own choice and volition. The example PeakIgnorance gave is probably a very asinine example, as very few immigrant families will be moving into affluent areas. They neither can afford it, and the zoning laws and community housing boards would probably forbid it. So most likely, whatever area these “3-5” families are supposedly living in, is already a low-priced, rundown neighborhood, in which the arrival of immigrants would have little-to-none affect on the local housing prices. Of course, when PeakIgnorance refuses to reference a newspaper article or even the housing district he specifically refers to (Orange County is HUGE), it “conveniently” disallows anyone from contextualizing what is 98% apt to be completely bullcrap on the part of PeakIgnorance.
Vietnamese reminded me of a real estate joke I heard on a visit to Vancover Canada back in the age of dinosaurs: Agent took a Chinese woman to view possible houses to purchase. At each house they stopped at the the woman said fine now lets look at the next one. At the end of the day the agent was apologizing that he had not shown her houses they she would consider buying. The woman said: No, no, I will buy them all.
“Perhaps, one of the reasons middle class house prices in California remain high is Vietnamese are buying houses and two or three Vietnamese families move into one house. Also, I knew, a Caucasian family that worked at Lowes.”
Actually these Vietnamese are buying these houses for their Chinese friends just to confuse your racist masters. But hey – in your world a;ll Asians look a like!
@ digbert dogbert
Here, Trump explains your “confusion” on the topic—see, the stories about California are “leaks” but they are also “fake news” at the same time. Now Ed Hanson, Bruce Hall, and “Princeton” Kopits all have an IQ level low enough to make that statement perfectly comprehendible. Now dilbert, if your IQ is above Down syndrome level (seems you are way above that) you may have problems grasping that.
https://www.youtube.com/watch?v=jtl5XK7QP38
My apologies on the misspelling of your pseudonym, I meant no disrespect.
It was stolen from my middle son. All intelligence folks steal the good stuff.
Look, I found more “fake news”. These damned “media elites”. Who leaked this?? Who leaked this “fake news”??
https://www.youtube.com/watch?v=jKKigLVtLjE
Art Laffer! The guy who, not long ago, suggested a flat income tax of 6% was just what ordinary Californians needed. Economic nivana that would cure any and all ills that California’s current tax system had created.
How favorable would such a tax have been for California’s middle income tax payers. Welllllll…
In 2017, a couple filing jointly with a TAXABLE (not gross) income of $100,000 would have owed the state$ 3,884. ($4,115 – two exemptions, $114 each, totaling $3,884, or a rate of 3.884%).
Compare that to Laffer’s suggested 6% ($6,000) and, even if you’re math challenged, you understand why that California couple would not have been thrilled with owing another $2,116 ($176/month) in income tax.
A laugher to be sure. (Current California median income is in the $67K neighborhood. Not hard to figure how that flat 6% would be welcomed here.
nonec
Perhaps you did not know, or perhaps you conveniently did not report, but the Laffer 6% flat tax was not limited to gross income. But as Art Laffer wrote”But most of all, there would be no state and local sales taxes, no property taxes, no state gas taxes and no state payroll taxes, none, none, none.” Seeing this, are you sticking to the tax increase story you wrote. And BTW, even without the accelerated growth such a tax would bring, the proposal is revenue neutral.
http://www.foxandhoundsdaily.com/2009/01/california-needs-a-flat-tax-solve-its-budget-problem/
Ed
Perhaps you’re naive enough to believe a 6% flat income tax would replace all state and local sales taxes, all property taxes, all state gas taxes and all state payroll taxes, “none, none, none.” In that case, you might be seriously interested in my ocean front property in downtown Barstow. Price reduced just for you.
nonec
The numbers are clear, California state and local taxes bring in the equivalent of 6% gross income. The only thing that truly changes is the control of the populous the state created. That is a terrible thing for those who are in power, and that is the reason such tax proposals are dead on arrival.
Ed
Maybe Ed is also unaware that state and local government spending is typically at least 12% of GSP. Of course that pays for the police and public schools – things that Ed likely thinks we can do without;
I love this line:
“Let me put the theorem to you precisely (and I could prove it to you mathematically if need be): By trying to redistribute income, government never, ever succeeds in redistributing income.”
Laffer used to rely on Victor Canto to do his mathematically modeling. I was once asked to team up with my college’s best mathematician to teach a class in Mathematics for Economists. My colleague was nervous as he said he knew nothing about economics but he got up to speed reading the great text by Alpha Chiang.
I showed him a few papers by Canto which led my colleague to suggest that Canto had to be the worst mathemetician ever. We used these papers to show our students how not to do it.
I used “Mathematical Economics” by Akira Takayama. I never quite understood why it had a full chapter on Calculus of Variations and another full chapter on Optimal Control Theory. Who the hell would ever use Calculus of Variations if they knew Optimal Control Theory???
A reasonably well written article about current migration patterns of California. Reasons for the net migration are not liberal nor conservative, nor foreign nor the rich protecting their own, but classic economic.
Ed
Why am I not surprised, Ed, that you’re all in on Laffer? The guy David Stockman once described as a “charlatan.” Who, in Stockman’s words, deals in “deceptive gibberish”.
About that Laffer flat tax (actually 6.5% with FULL EMPLOYMENT a necessity for it to work, according to Laffer himself, or did you conveniently forget to mention that?) , a nationally prominent UC San Diego economist once had this to say: “…The claim that tax cuts pay for themselves by growing incomes and the tax base has no support in the data. The historical experience has always been that when taxes are cut, deficits go up. Show me your spending cuts that the Legislature and governor are willing to sign into law, then we can talk about cutting taxes But until that is agreed on, cutting taxes without addressing spending is irresponsible.”
I’m with Dr. Hamilton on this one.
But, please, continue to believe all that comes out of Laffer’s mouth. After all, look at that Kansas miracle. Who says his gibberish couldn’t wreck any other state if given the chance?
nonec
You quoted “But until that is agreed on, cutting taxes without addressing spending is irresponsible.” I assume you are in agreement with this statement. Funny that I missed your criticism during President Obama’s demand-side tax cuts, but I am sure you were loud and insistent.
Anyway, go look at my treatment of the difference supply-side tax rate cuts verses demand side tax cuts. Because supply-side tax rate cuts work to create a greater expansion of the economy, the dividend of that greater increase of GDP continues to make us all more richer as the years continue. Remember what Einstein said about compound interest. Slug has some problems with it, but won’t bring counter DGP facts he would liked used. He knows the story remains the same, allow more of what the individual earns o remain with the earner the greater the expansion of the economy.
I am quite happy with the knowledge that Laffer change his 6% to 6.5%, but will need to see your link to that.
Ed
Read carefully. I quoted Dr. James Hamilton who said cutting taxes WITHOUT addressing spending is irresponsible. That the result of such cuts are deficits. That, in a nutshell, is Lafferian economics.
I assume you are in agreement that increasing debt while cutting taxes–and borrowing to do so– is sound conservative fiscal policy. That’s why I’m sure you were thrilled when Reagan tripled the national debt and while Bush II doubled it in his eight year term. It’s also why you were doing somersaults when Bush and a Republican congress increased the debt by half during the period from 2001-2007. Not hard to imagine you cheering when Bush suggested privatizing Social Security either, since that would have required borrowing only another $4-$5 Trillion.
While I read Laffer’s flat tax op-ed in the Sacramento Bee (where I remember no mention of such a tax replacing every tax in the state nor any mention of the constitutional difficulties therein), the articles I quoted from appeared in the San Diego Union Tribune, May, 23, 2013-where the 6.5% tax is floated– and a followup on May 31, 2013. (www.sandiegouniontribune.com).
The May 23 piece also noted this: “He (Laffer) also said the rate would be revenue NEUTRAL at FULL EMPLOYMENT. Oh? Meaning it wouldn’t work unless EVERY ONE is working?
The articles also mention the aim of reducing the complexity of the tax system but contain nothing about such a rate enabling the abolition of every other tax in the state.
Of course, the argument over such a tax is barely an academic one since a large majority of economists and financial experts consider it to be, as David Stockman has written, deceptive gibberish, and its author a charlatan.
But don’t let me stop you from waiting for the imminent collapse of the California economy preceded by a mass exodus of wealthy Californians because, well, Laffer said it would be so. The least you should hope for is allowing the man who helped wreck the Kansas economy to work his “magic” on California.
noneconomist
In Ed Hanson’s reply to you he said: go look at my treatment of the difference supply-side tax rate cuts verses demand side tax cuts
Yes, by all means do that. It’s a good example of how not to do a proper economic analysis. I have this pathetic image of him proudly turning in his “analysis” as a college term paper. You can guess what grade he’d get.
slug
Still waiting for your pick of GDP quarterly data. Knowledge that the President Obama’s demand-side policy causes less growth than supply-side policy keeps you from to declaring a judgement that President Obama GDP interactive graph. Not to worry, I will use a real GDP historical chart soon. Just have been waiting on you to defend your call.
ed
instead of waiting on slugs, do your analysis. present your work.
oops
Link for above article on net migration:
https://www.marketwatch.com/story/with-no-letup-in-home-prices-the-california-exodus-surges-2018-05-03
Recent btw May 5th.
Ed
Your source is making a bogus claim according to this:
https://www.nbcsandiego.com/news/local/California-Population-2017-Report-481520941.htm
California’s population has come close to 40 million.
“The Next 10 and Beacon Economics researchers used Census data to track migration patterns by demographic characteristics.”
I see how Beacon Economics got this so wrong. They are using the Jeff Sessions count which includes only white people!
Ed Hanson Your post makes no sense. No one has ever said that real GDP growth rates after the Great Recession were higher than growth rates during the 50s or 60s or 70s or 80s or 90s. God only knows how many working papers have been written about the “disappointing recovery” following the Great Recession. The issue is whether or not Reagan’s so called “supply side” tax cuts actually performed as advertised. Simply pointing out that average real GDP growth in the 80s was higher than it was after the Great Recession is not an original or brilliant insight. If you want to argue that Reagan’s “supply side” tax cuts represented an historical break in economic performance never seen before or after St. Ronnie’s glorious eight years, then you’ve got a much higher bar to clear than simply telling us that growth rates in the 80s were higher than they were after 2007. If you wrote a paper that claimed some special status for Reagan’s tax cuts, here are the kinds of questions you must be prepared to answer in front of a murder board:
1. Are there other periods in which real GDP growth rates equaled or exceeded the so called “supply side” period under Reagan? For example, did real GDP under Reagan exceed real GDP growth under Carter or Clinton or LBJ?
2. How do you define a “supply side” policy? Is it any tax cut? If so, then clearly Obama’s 2009 ARRA would count as a “supply side” policy because it cut taxes quite a bit.
3. How do you econometrically identify purely “supply side” effects from “demand side” effects?
4. How do you econometrically identify fiscal policy effects from monetary policy effects?
5. What is the transmission vehicle in “supply side” economics that is supposed to push out the aggregate supply curve? Is it greater labor effort? Is it capital deepening from increased national saving? Fairy dust?
Let me suggest an exercise that might help you better appreciate whether or not Reagan’s “supply side” policies were somehow the unique world historical events that you seem to imagine. Go to FRED and pull up the quarterly data for real potential GDP beginning around 1965 or so. Calculate the four lagged difference in the levels data; i.e., this gives you a moving year-over-year difference in levels. Then calculate the percent changes. Take those percent changes and graph them out. What you’ll see is that there was nothing especially unique about how Reagan’s “supply side” policies affected the growth rates of potential GDP. In fact, potential GDP actually started to fall off after Reagan’s phased-in 1981 tax rates fully kicked in. You’ll also notice that the trend in potential GDP started to fall off well before the onset of the Great Recession, which is exactly what Stock & Watson told us was in the data. Instead of St. Ronnie hero worship, what policymakers really need is a good explanation as to why potential GDP started to fall off in the early 2000s and why it hasn’t snapped back to historical levels. What we don’t need are useless and uninformed wild goose chases.
BTW, still waiting to hear how you would identify the instrumental variables needed to isolate supply side effects from demand side effects. And while I’m at it, let me remind you that using EXACTLY the same methodology you used in your earlier post, it showed that under nominal GDP growth rates under Carter were 60% higher than under Reagan. Still think there’s no problem with using nominal data?