Holding to the Old Faith
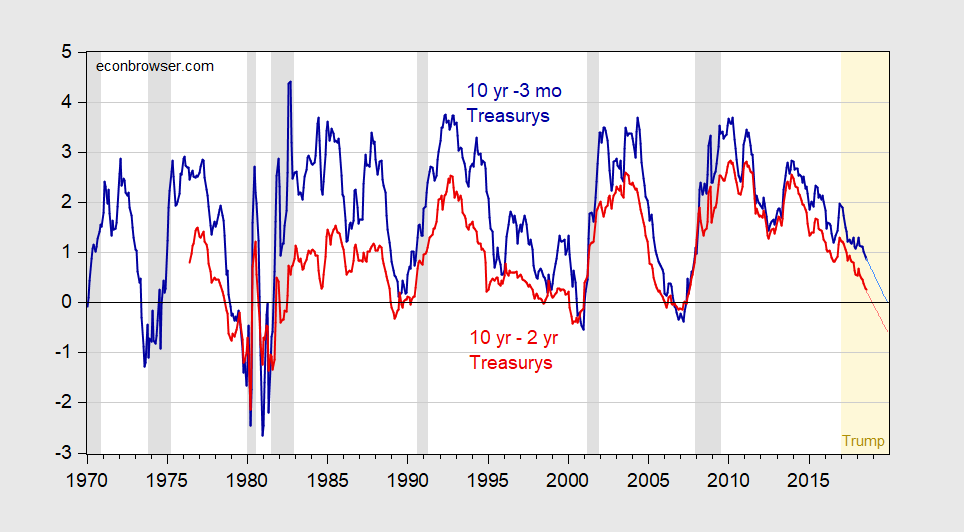
Figure 1: Ten year-3 month Treasury yield spread (bold dark blue), and ten year-two year Treasury yield spread (bold dark red), and projections at current pace using 2017M01-18M08 sample (light blue and pink lines), in percentage points. August 2018 observation through August 27th. NBER defined recession dates shaded gray. Light orange denotes Trump administration. Source: Federal Reserve Board via FRED, Bloomberg, NBER, author’s calculations.
While the August ten year-three month (ten year-two year) spread is 0.87% (0.26), the corresponding figures as of 8/27 are 0.75%(0.18%), reflecting the downward trend. At the current pace the ten year-two year will invert in about 5 months.
In Chinn and Kucko (2015), we document the predictive power of these spreads for recessions. In today’s SF Fed’s Economic Letter, Michael Bauer and Thomas Mertens follow up on their previous study, and conclude:
The three long-term spreads and the one short-term spread all have very similar predictive accuracy, with AUCs of 0.85 to 0.89. The traditional 10y–3m spread performs better than the other three spreads by a slight margin. We also assess our predictors over a sample period that excludes the so-called zero-lower-bound period, when short-term interest rates were essentially zero (2009–2015) to give the best possible chance to the short-term spread, as did Engstrom and Sharpe. This helps its relative performance and puts it about on par with the 10y–3m spread. Engstrom and Sharpe found that their short-term spread statistically dominated the 10y–2y spread, and our findings are consistent with this result. However, we also show that the traditional 10y–3m spread is the most reliable predictor, and we do not find any evidence that would support discarding this long-standing benchmark as a measure of the shape of the yield curve. It is worth emphasizing again, however, that all of these term spreads are fairly accurate predictors and quite informative about future recession risk; the differences in forecasting accuracy are small.
So, while I see the merit of looking at several indicators, and can see that in a horse race other spreads might marginally outperform (in particular) the 10yr-2yr spread, when one spread inverts, that is going to be highly suggestive.
The 10yr-3mo spread will, at the current pace, go below zero in December 2019. Assuming a recession follows within a year, that suggests a recession by December 2020.
PredictIt‘s odds of a recession by January 2021 has risen from 40-60 to 50-50 (and as high as 55-45) over the past 3 months.
The 10yr-3mo spread will, at the current pace, go below zero in December 2019. Assuming a recession follows within a year, that suggests a recession by December 2020.
PredictIt‘s odds of a recession by January 2020 has risen from 40-60 to 50-50 (and as high as 55-45) over the past 3 months.
I’m confused about the timeline. If the yield curve is expected to invert in five months, then that puts the inversion date at Dec 2018 and the onset of recession around Dec 2019. Trump’s term ends Jan 2021.
2slugbaits: Apologies. Yes, that’s a typo. I changed it after posting to January 2021. Thanks for catching that.
re: “projections at current pace using 2017M01-18M08 sample”
eyeballing that graph, it looks like the yield spreads are in a rate channel that started sometime near the end of 2014…i think that if you did your projection on a 2015M01-18M08 sample, you’d find the inversion would be farther out…
rjs: Yes, if I do so, the 10-2 spread inverts in February 2019 instead of December 2018.
The fact that the 2-year rate has passed 2.6% is quite indicative of a tighter monetary policy. If Trump was not tweeting about the Russian investigation so much – he’d be lambasting the FED nonstop.
He already has but Powell’s not listening to him.
Read Bauer and Mertens’s Aug 27th FRBSF Info in the Yield Curve letter. Not perfect, but superior to anything else. Be sure you understand why. (How will you know when you understand?) Then look at the current data and think.
JBH: One can start with the quoted paragraph that is reproduced below the graph. It quotes from Bauer and Mertens — indeed the same Bauer and Mertens article you are lauding so profusely. Hence, I have little understanding of what you could possibly mean.
Menzie You display two of the horses in this race on your graph. I am simply saying this. Neither is in contention. Though you most assuredly think they are. And though I know well that you will not believe me on this matter no matter what. So that it would appear futile for me to go any further. But I will for one simple reason. In doing so, I illustrate a great, profound lesson. That those who dig deepest reap the greatest reward. So it is in every endeavor mankind has ever engaged in. All the greats — Feynman, Kubrick, Leibniz, Shakespeare, Bach, Jung, Maxwell, Jobs, always went deeper than the others around them who were also searching. Now bringing you back to the race at hand. I am simply saying that the paper you link to, and a paper that that paper links to, have a better horse than the two you show on your graph. And I am saying even more! That not even that horse is the winning one. Because there is one still better.
So it seems that Trump is pressuring the FED to lower interest rates:
https://www.reuters.com/article/us-usa-trump-fed-exclusive/exclusive-trump-says-not-thrilled-with-feds-powell-for-raising-rates-idUSKCN1L5207
I discovered this link by reading an Angrybear post ala NewDealDemocrat who argued that Powell will get the James Comey treatment as in “you’re fired”.
U.S. economic growth is stronger and U.S. long bond yields are higher than the E.U. and Japan. Apparently, there’s strong domestic and foreign demand for those bonds. Also, the U.S. economy has a brighter future and is a safe haven.
The Fed’s Operation Twist hasn’t been reversed and monetary policy is still highly accommodative with a Fed Funds Rate below 2%. Also, we had a fiscal expansion beginning this year. Core PCE remains below 2%. The consensus is we’re at full employment, but that seems wrong. The economy isn’t close to “overheating.”
The 2001-07 expansion was on top of the 1982-00 economic boom. However, the economy has been very depressed, since the severe recession ended in 2009, perhaps, until this year. There may be somewhat of a self-fulfilling prophecy that because the expansion is old, and has been perceived as stronger than in reality over the past nine years, a recession is expected, i.e. too much caution.
Where to start with your daily gibberish? Oh yea – your first paragraph is contradicting what Trump has said. Good luck after he fires you.
Your 2nd paragraph is in denial. The FED is already raising interest rates.
Now paragraph 3:
“The 2001-07 expansion was on top of the 1982-00 economic boom. ”
Of course 1982 was the bottom of the Reagan recession which was caused by the same toxic mix of fiscal stimulus and tight money that you are praising. Go figure! And of course you completely missed the Bush41 recession. The stupidity is deep within you!
Pgl, I don’t expect you to understand economics, but at least try to understand English.
The “economic boom” reflects the two longest peacetime expansions, in 1982-90 and 1991-00, which I call the long boom, in 1982-00.
An “expansion” and a “boom” aren’t the same thing. There can be a recession in an economic boom, but an expansion and contraction reflects a business cycle. Also, you need to know the difference between a recession and a depression.
I understand English. But you do gibberish which is far removed from economics. But please continue to make up meaningless terms this way as the rest of the crew is having so much fun laughing – not with you. At you.
Pgl, I’ve tried to make it as simple as possible.
But, it’s all way over your head.
“Pgl, I’ve tried to make it as simple as possible. But, it’s all way over your head.”
Yes Peaky – we all realize that your job is to make the intellectual garbage and gibberish from the White House aka your “it” as simple as possible. And we all appreciate your tireless efforts to repackage their lies!
And, the 2001 recession was likely the mildest in U.S. history, which makes the 2001-07 expansion, on top of the 1982-00 boom, stronger.
That is, the 2001-07 expansion was built upon the 1982-00 economic boom and the mild 2001 recession.
Actually, the long boom was in 1982-07.
PeakBabbling brings up 1982 and 2007? Economic historians know that these two years signal the two colossal macroeconomic disasters in our lifetimes. The 1981/82 Reagan recession was horrible and in large part due to a toxic mix of fiscal stimulus and tight money that Trump is imposing on us now. The recession that began as of December 2007 was horrific and in large part was due to the same kind of ill advised deregulation of the financial sector that PeakBabbling now advocates.
So why does PeakBabbling bring up these dates? Who knows as his stupid babbling knows no bounds.
By your measure of business cycles, we had a boom from 1949 to 1974. Just as long and higher average growth rate.
Of course your measure is contradicted by the economists at the NBER. Hey Peaky – email them and lecture them on how they do not know economics!
The 2001 recession was mild? I guess that is why the FED had to “keep interest rates too low for too long” aka the gibberish from the former economist known as John B. Taylor. That is the funny thing about right wingers. If you stack all of your incessant babble up – it massively contradicts itself.
Hey – can you write more of this bizarro intellectual garbage? We need a good laugh!
Chart below shows rates and yields are relatively low, e.g. compared to before the 2007-09 recession, which are positive for economic growth going forward:
http://www.fedprimerate.com/prime-rate_vs_30-and-15-year-fixed-rate-mortgage_vs_10-year-treasury-yield.htm
I think this is the central conundrum. Is the spread more important, or the absolute level? Is this time different, or not?
Steven Kopits: Jonathan Wright would say both.
JMO, but I think it’s the spread because of the condition it describes, i.e., borrowing money in the short term is more expensive than the expected return in the long run. That’s a pretty hostile investing/economic environment, and so it summons recession.
But as I say, JMO.
Sebastian
So, I think the counter-argument runs along demographic lines. That it, without high GDP growth, it’s hard to generate big assets bubbles, which in turn create recessions or depressions when they pop. Therefore, the spread matters, but the recession will tend to be shallow, as has been the expansion.
Maybe.
An example: If the total population is falling in Japan, and the working age population is falling even faster, is it possible to create a housing bubble in Japan barring Argentine-style fiscal and monetary policy? And if you can’t generate a bubble, can you generate a bust? And if you can’t do either, do you still have material business cycles, or just a kind of porpoising up and down without much trend, a la Japan?
Somehow PeakIgnorance has missed the entire discussion of how the Wicksellian real interest rate is lower today than it was over a decade ago. C’mon Peaky – try buying an economic textbook that is not over 90 years old!
Professor Chinn,
I notice in the SF Fed’s Economic Letter conclusion says that there is a still a comfortable spread. Is there a probit model to forecast for a given spread what the probability is of the spread inverting?
SF Fed Conclusion
The yield curve has been a reliable predictor of recessions, and the best summary measure is the spread between the ten-year and three-month yields. Although this particular spread has narrowed recently like most other measures, it is still a comfortable distance from a yield curve inversion.
AS: I think the two are consistent. The 10yr-2yr spread at 26 bps means unlikely recession w/in a year looking at past correlations. If you run the probit regression, I think you get about 18% probability w/1 year of inversion. If you ask if one *starts* within a year, you get a higher probability, as noted by Lenoel.
Professor Chinn,
Thank you for the reply.
Interesting news today. Trump’s director of the National Economic Council, Larry Kudlow, says that he is looking into regulating Google because its searches return too much negative news about his Dear Leader. It’s hard to figure Kudlow’s angle in this but the simplest explanation is that he is simply “working towards the fuhrer”.
Civil servant Werner Willikens in 1934: “Everyone who has the opportunity to observe it knows that the Fuhrer can hardly dictate from above everything which he intends to realize sooner or later. On the contrary, up till now, everyone with a post in the new Germany has worked best when he has, so to speak, worked towards the Fuhrer. Very often and in many spheres, it has been the case—in previous years as well—that individuals have simply waited for orders and instructions. Unfortunately, the same will be true in the future; but in fact, it is the duty of everybody to try to work towards the Fuhrer along the lines he would wish. Anyone who makes mistakes will notice it soon enough. But anyone who really works towards the Fuhrer along his lines and towards his goal will certainly both now and in the future, one day have the finest reward in the form of the sudden legal confirmation of his work.”
Other news today. George Washington University released the results of a study into excess deaths in Puerto Rico. The study was commissioned by the Puerto Rico government.
Results: 95% CI: 2,658-3,290 with mean of 2,975 for September 2017 through February 2018.
They indicated that for the poor and elderly (65+), the risk of death was 45% higher and persistent through the end of the study period. This suggests that the count might be even higher if you look beyond February.
https://publichealth.gwu.edu/sites/default/files/downloads/projects/PRstudy/Acertainment%20of%20the%20Estimated%20Excess%20Mortality%20from%20Hurricane%20Maria%20in%20Puerto%20Rico.pdf
jo: Thanks, have just posted.
Other news today. George Washington University released the results of a study into excess deaths in Puerto Rico. The study was commissioned by the Puerto Rico government.
Results: 95% CI: 2,658-3,290 with mean of 2,975 for September 2017 through February 2018.
They indicated that for the poor and elderly (65+), the risk of death was 45% higher and persistent through the end of the study period. This suggests that the count might be even higher if you look beyond February.
https://publichealth.gwu.edu/sites/default/files/downloads/projects/PRstudy/Acertainment%20of%20the%20Estimated%20Excess%20Mortality%20from%20Hurricane%20Maria%20in%20Puerto%20Rico.pdf
joseph: Thanks, just posted.
One oddity of the likelihood that the 2 year-10 year spread might invert first is that this shows how far we have come in the US at least from being in negative nominal interest rate territory, although some nations are still having that such as Switzerland and Japan. As it is, and I have noted this here previously as wee as in at least one post on Econospeak some time ago, when we see negative nominal interest rates, more often than not the lowest rates are for 2-year government securities, thus leading to a non-monotonic yield with a large 2 year-10 year spread. That this spread may be about to disappear and invert says that at least in the US we have indeed moved far away from that negative interest zone, with this weird non-monotonicity and tendency for a minimum at 2 years still an unexplained mystery as near as I can tell, not even a whisper of a theory out there despite this being a pretty ubiquitous empirical phenomenon, although perhaps about to disappear if those remaining negative nominal interest rate nations follow the US and raise all their interest rates into positive territory.
I am wondering why no-one has talked about inversion being related to highly expansionary fiscal policy. Happened before over there ladies and gentlemen.
you aint gonna get a recession with a structural deficit of 6% of GDP
Why no comment on fiscal policy at all. Surely when you lot have a structural deficit of 6% of GDP monetary policy must get tighter. It has occurred before overthere with Republican Presidents.
A recession when fiscal policy is this expansionary aint gonna happen my friends
“A recession when fiscal policy is this expansionary aint gonna happen my friends”.
We had a rather deep recession in 1981/82.
Mate,
Your recessions started with Volker in the Fed and Carter in the White house. Reagan did not get to change fiscal policy until much later.
now if he had tried to balance the budget as he promised you would have had a yuge recession
task task
Thanks Menzie
Two comments as I did not know the first registered. I thought it part of Trump policy towards Aussie comment
Volcker gave a mild recession under Carter and was already lowering interest rates before he was shocked at Reagan’s fiscal irresponsibility. To which he overreacted. Jeff Frankel the other day had a related and excellent warning about the next recession. Check it out as I just provided a link.
a mild recession? Just where is Unemployment get to?
Agree on Frankel it is in my Around the traps
Jeff Frankel has a related post which is excellent:
https://www.project-syndicate.org/commentary/the-next-us-recession-will-be-severe-by-jeffrey-frankel-2018-08
Hopefully Menzie will feature Jeff’s latest here!
pgl: You read my mind!
Keep in mind that no matter how fancy our math or statistical analysis, there are in reality only 7 observations since 1970 to draw from (7 recessions). Thats it. There is nothing fancy stats can tell us that common sense cannot: yield curve inversion is a symptom of tight monetary policy to dampen inflation. The 10-2 yield curve was flat to inverted in 1997/1998 without a recession – its helpful to note the course of Fed Funds during that time when Greenspan lowered rates between Aug 1998 and Jan 1999. Greenspan and co changed course and raised rates later in 1999 as the dot com bubble reached its peak.
In other words, the Predictit forecast of a 50% chance of recession is really a forecast of (overly?) tight monetary policy, related to FOMC concern about inflation or “financial excesses.” Whether its “overly” tight depends on your view about inflation and whether 2% inflation is a ceiling or an average.
dwb: Excellent first paragraph. Filled with many insights about the yield curve for those who come here to learn. Looking at the false signal episode and at all the correct signals, it can be deduced that the fed funds rate must be on a rising trajectory before any meaningful information can be extracted from a 2-10 inversion. Assume that the unobservable neutral rate is 1.5%. Assume coincidently and serendipitously that inflation stops rising at the Fed’s official target of 2%. (In actuality, inflation will probably overshoot the official target.) This means that at a minimum the nominal fed funds must go to 3.5% to halt the acceleration (or rise if you wish) in inflation. Until fed funds gets there, an inversion in the 2-10 is not a valid signal of impending recession. In the meantime the 2yr must go higher for reasons which should be obvious. When and only when the funds rate broaches above the 2yr will the first red flag pop up. We are a fair distance away from that at the present time. (The weak link in all this is the considerable loss of inflationary momentum in the latest two data points, June and July.)