In this post, I used IMF estimated data for predicting the counterfactual mortality levels, necessary to calculate excess deaths. It is important to note that by not taking into account the recent population decline, one is probably biasing down estimates of excess deaths.
For instance, here are three estimates:
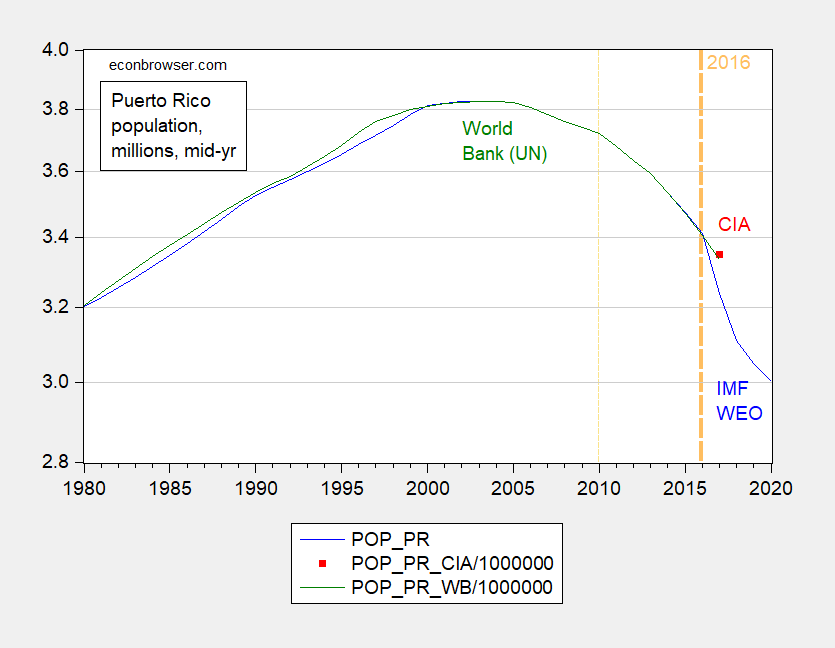
Figure 1: Estimated mid-year population for Puerto Rico, in millions, from IMF World Economic Outlook (blue), World Bank World Development Indicators (green), and CIA Handbook (red square), all plotted on a log scale. Bold dashed orange line at 2016, when Harvard School of Public Health team based counterfactual. Thin dashed orange line at 2010, start period (2010-2016) for Santos-Lozada and Howard used for counterfactual.
If the population is actually smaller in September 2017 onward than what it was in mid-2016, then the “normal” level of mortality is overstated. Excess deaths = recorded minus expected will then be biased down. If we use 2010-2016, the bias will be further exacerbated. That is why both Kishore et al. (2018) and Santos-Lozada and Howard (2018) indicated their estimates were conservative.
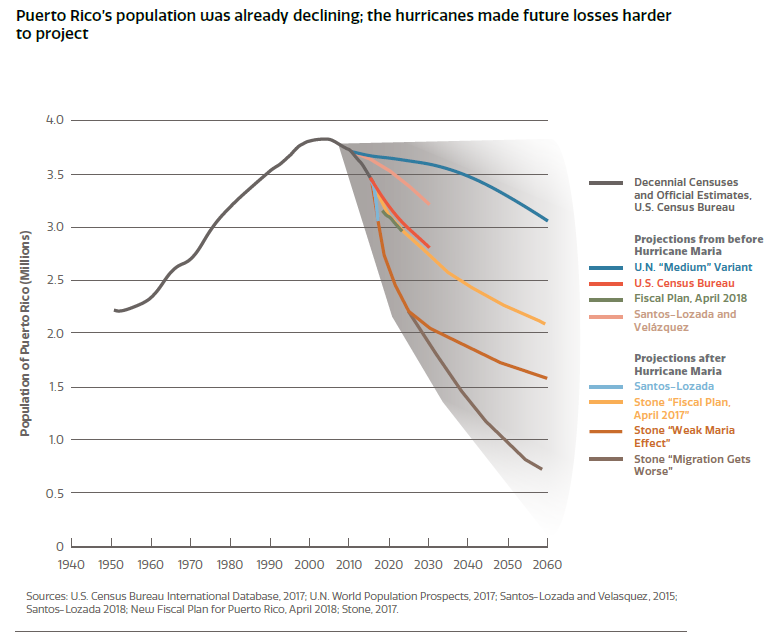
A more general picture of estimates here, from the DRAFT Economic and Disaster Recovery Plan for Puerto Rico:
So, when you read:
Thus, the year-end excess death toll of 1,400 may be treated as a firm number in practice. It is nowhere near the 4,600 central estimate of the MPR study and relayed by virtually the entire mass market media in the US. The Harvard study was wrong, and by a wide margin. Therefore, as we wrote earlier, unless the Study authors can point to where 3,000 bodies undiscovered through March 2018 may literally be buried, we are left to conclude that they simply do not exist, and the Study must be judged as wildly inaccurate and a gross exaggeration of the true impact of Hurricane Maria in Puerto Rico.
Understand, in addition to the final administrative data likely not being “firm”, the counterfactual is constructed. Assumptions made implicitly can have a big impact on the inferences, even when those assumptions seem innocuous.
My estimates indicate 740-2705, depending on how to treat statistical significance, assumptions regarding population size, nature of error terms in regressions, and not taking into account specification error, measurement error in population statistics, and demographic attributes of the population.
Update, 5:30PM Pacific: Reader TDM suggests that demographic effects are important in calculating the counterfactual. I estimate:
(3) mt = β0 + β1popt + δ(OCT14) + monthly dummies + θ(pop65) + ut
Where pop65 is the (log) estimated population over 65 according to the World Bank and pop is sourced from the World Bank as well (instead of IMF). The estimate of θ is 0.150, t-stat of 0.137. This suggests, but is not completely dispositive, of the idea that the results are highly biased due to the omission of demographic factors.
Update, 8/14 10:30AM Pacific:
Notice that estimated excess mortality is barely changed for the 2010-16 sample.
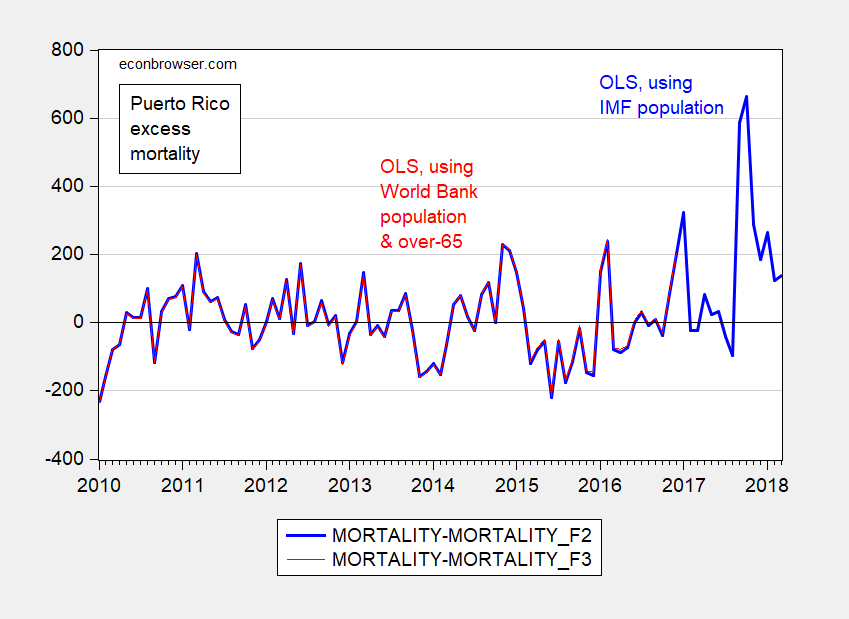
Figure 2: Estimated excess fatalities using OLS log-log specification including IMF WEO population (blue), and using OLS log-log specification including World Bank population and over-60 population (red). Source: Author’s calculations.
Page 5 of Kishore et al. (2018) also casts doubt on the demographics hypothesis.
Update, 8/18/2018, 5:30PM Pacific: Data here [XLSX].
The 740 number for excess deaths Sept 20 – Dec. 31, 2017 is not even theoretically possible, because the government has already confirmed 1400 excess deaths. The only way to achieve this would be for the government to double count deaths by mistake during the post-Maria period. Highly, highly unlikely.
The 2705 number implies roughly 1300 undiscovered or unreported deaths now between eight and eleven months ago. Highly unlikely.
I stand by my statement.
Steven Kopits: We don’t know how the government arrived at that number. It’s not footnoted in the draft report. We don’t even know if there is a confidence interval associated with the estimate.
I’m not asking for you to stand by your statement. I’m merely saying you can’t state these things with such certitude and have any hope of being considered a serious policy analyst.
If your estimate is running at 3.2x the preliminary actuals, I mean, making a call is not that hard. And of course, eight months later, the PR govt said exactly what I had claimed. So if you’re claiming something different, you’re on the outside looking in, and it’s incumbent upon you to justify your view. If you’re publishing on a blog, well, claim what you like. If you’re publishing in the NEJM, you had better have your ducks in a row.
“Princeton” Kopits has mentioned the Milken Institute’s soon to be published numbers on the Puerto Rico excess mortality rate at least once, strongly implying it will be (in Kopits’ own opinion) one of the better numbers to look at. I’m very curious, if the Milken Institute’s number is much closer to Menzie’s range of numbers, than the numbers of the man who doesn’t understand freshman statistics terminology—i.e. “Princeton” Kopits—what will “Princeton” Kopits have to say then?? Mark your calendars kids.
Milken is working out of death certificates, Moses. They were hired by the government, so I doubt the Milken numbers would be much different than the official ones.
The premature v excess death number is the one to watch.
@ “Princeton” Kopits
You’re contradicting yourself in so many ways, it’s difficult to keep track. So you DO or DO NOT believe in death certificates?? One moment you are saying the numbers are “too high” because they haven’t been tabulated in the official count, the next second you’re saying the death certificates shouldn’t be relied on.
It’s also especially interesting, given an earlier comment you made related to the Milken Institute:
https://econbrowser.com/archives/2018/05/heckuva-job-donny-puerto-rico-edition#comment-209803
Moses –
The death certificates are what they are. However, they deal with cause of death, not the attribution of cause of death. In Puerto Rico following Hurricane Maria, the distinction matters.
As you will recall, only 64 deaths were attributed to the hurricane, even though morgues and funeral homes were seeing substantially elevated numbers of bodies coming in. This led to complaints that the incumbent approach was systematically under-counting the number of fatalities from the hurricane by excluding those caused indirectly, notably following from a loss of power. The excess deaths calculation demonstrates that this assertion was materially correct: the hurricane did elevate mortality, but mostly indirectly through a loss of power, which caused the most vulnerable population — the elderly and infirm — to die at unusually high rates.
The governor acknowledged this problem and retained the Milken Institute (GW SPH) to come look at the death certificates to establish attribution, rather than causation. This matters in Puerto Rico, because FEMA pays some funeral expenses if the death can be attributed to hurricane.
There is a potential trap in this mandate, and I suspect Milken has fallen into it. It has to do with pre-mature deaths.
If 2017 had been an average year, like 2016 or the 2010-2016 average with no hurricane, then 8300 people would have died between Sept. 20 – Dec. 31, 2017. As it turned out, the records show that about 9700 people died during this period, for excess deaths of about 1400. But that’s not necessarily the number of deaths which can be attributed to the hurricane.
Let’s take that 8300 normal deaths for the period. On Sept. 20, the weakest person in that group had a day to live, and the strongest, 102 days (to Dec. 31). The average person in that group would have died within 51 days, that is, by around the 10th of November. So, materially, the vast majority of the people in this group were either on their death beds or in pretty bad shape when the hurricane hit. Now, Menzie seems to think that that weren’t any intra-period deaths, that no one who would have died on, say, Dec. 12 actually died on Oct 30 due to the hurricane.
I suspect the intra-period premature deaths were in fact in the thousands. If you imagine a person with thirty days to live — on dialysis, or insulin, or with a heart or respiratory condition — and you take away their medication, their air conditioning, their oxygen tanks, their dialysis — do you think they would die at least a day early? I suspect thousands did.
Thus, the premature deaths attributable to Maria are not just the excess deaths of 1400, but rather the intra-period pre-mature deaths which brought forward the deaths of those who would have died within the calendar year in any case, but who died perhaps a few weeks to a month or so before they would have otherwise.
This matters for Milken, because if you start working through the attribution (as opposed to causation) exercise death certificate by death certificate, you’ll find that far more than 1400 deaths could be attributed to Maria. In fact, literally all the deaths after Sept. 20 could be attributed to Hurricane Maria. That’s a political and perception problem, on the one hand, and an issue with FEMA, on the other.
That’s why, had I been running the project, I might have chosen an actuarial approach, rather than a direct attribution, certificate-by-certificate approach. Therefore, rather than saying the Mrs. Rodriguez died for lack of insulin due to the hurricane, I would say the Mrs. Rodriguez, given her condition on the day before the hurricane, would have been expected to live x days (for example, six months) from that date. Instead, she died one month later, therefore, a loss of five months of her life can be attributed to Hurricane Maria. By this approach, we don’t really need to establish if the hurricane killed her or not. We can address her death in a probabilistic fashion without having to ultimately determine whether the hurricane or her pre-existing condition or something else caused her death. As a consequence, the impact of the hurricane would be measured in pre-mature deaths (not excess deaths) and life-years lost. So, we might see a result that the hurricane contributed to the pre-mature deaths of, say, 4600 people representing 200 life years.
https://www.cnn.com/2017/12/20/health/puerto-rico-storm-death-review-problems/index.html
https://gwtoday.gwu.edu/sph-research-project-study-hurricane-mortality-puerto-rico
https://publichealth.gwu.edu/content/milken-institute-school-public-health-statement-new-study-estimate-excess-mortality-puerto
Kopits wrote:
Now, Menzie seems to think that that weren’t any intra-period deaths, that no one who would have died on, say, Dec. 12 actually died on Oct 30 due to the hurricane.
No, you have that wrong.
Menzie thinks that, if a person on the way to her final appointment at an assisted-suicide clinic is obliterated by a drunk driver, that person was killed by the drunk driver and the death is a homicide, not a premature suicide, and will be counted in official statistics, in perpetuity, as a death caused by a motor vehicle incident.
If you wanted to sound slightly more human, Kopits, you’d stop discounting deaths over time and switch to something like person-years lost to the hurricane.
Personally, I’m not thrilled with the focus on a few thousand deaths, give or take whatever, when there are millions of survivors who suffered and continue to suffer terribly from the impact of the hurricane and who have received second-class treatment, at best, from the federal government. Very, very few of those millions of people were responsible for or benefited from any corruption and incompetence of territorial and local governments in PR.
Well, Ott, the Puerto Ricans themselves voted for the government that bankrupted them and for the politicians who resisted raising their electricity rates for 30 years. And they benefited from low power prices jobs for politically connected people, and aggregate consumption above sustainable levels. A large portion — a majority — of the electorate was complicit.
And we have a PR-scale humanitarian disaster every week — every week! — at the Mexican border, and I haven’t heard you stand up and be counted.
So if we’re talking about manning up, by all means, do it. Tell us we have a crisis of immense proportions at the Mexican border and that we should do something about it.
“If you wanted to sound slightly more human, Kopits, you’d stop discounting deaths over time and switch to something like person-years lost to the hurricane.”
Well, that’s exactly what I did.
As for being more human, I don’t know what to tell you. This is a counting exercise. I haven’t said whether Puerto Rico should get more aid or less. I haven’t said anything normative at all, except that the MPR’s median estimate for excess deaths is wildly off — which the PR govt has confirmed — and that their CI is effectively useless for decision-making purposes, which it is.
Right now, I hold had the high estimate for premature deaths in PR. I am the one saying that at many as 4600 (or even more) people might have died prematurely in PR after the hurricane. No one else has said that, to the best of my knowledge.
“I am the one saying that at many as 4600 (or even more) people might have died prematurely in PR after the hurricane. ”
getting pretty close to the middle of the estimate provided by the harvard study. and an order of magnitude greater than the 400 you accounted for recently. you need to reevaluate your definition of a garbage study steven. without the prompting of the harvard folks, you probably never would have considered revising your estimate.
The Harvard study looks at excess, not premature, deaths, Baffs. I stand by what I said: the MPR study was garbage, or more precisely, it was grossly oversold. (There was nothing wrong with doing the study. The key to the study, however, is not the result, but the resulting error analysis. They should have run the 38 deaths they found from the surveys to ground. That would have been the worthwhile part of the exercise, to see if they could error correct to create an approach that could be used in low documentation environments, eg, Syria or Sudan.)
No one has looked at pre-mature deaths, to the best of my knowledge, Baffs, although Milken is surely grappling with the issue as they work through the attribution exercise.
well steven, i for one have gained much more from the harvard study than i have from your discussions. you are too focused on splitting hairs between premature and excess-almost to the point there may be an agenda in your argument? at any rate, the harvard study actually put boots on the ground to try and acquire information-not a small feat on a storm stricken island. it really is hard to call that garbage while one sits in an air conditioned office and produces numbers from somebody else’s data collection efforts. just my opinion.
“I’m merely saying you can’t state these things with such certitude and have any hope of being considered a serious policy analyst.”
You could have saved a few words:
… You can’t … have any hope of being … a policy analyst.
Lord – we have had more than my fair share of Princeton Steve pretending he is smarter than the rest of us. He is not a policy analyst – he is an attention seeker. Sort of reminds me of Omarosa.
That’s very unfair to Omarosa—at least the woman has sex appeal—let’s give her that at least. One positive personal trait beats out zero positive personal traits. Wrap it up, I’ll take it.
https://www.youtube.com/watch?v=68Ml678-DKw
That is my favorite wrap song by the way. I say, that is my favorite wrap song. That is my favorite wrap….. nevermind.
(I stole that last line dear blog readers, quiet, it’s our secret)
Not taking demographic attributes into account is probably significant.
The population that left was not a random sample.
It is probable that expected deaths would not significantly decereace,
and could actually increase if health workers were over-represented in the population that left.
TDM: Mebbe. Should be checked. Oh, Kishore et al. (2018, p.5) notes:
I have not heard anybody conjecture health workers were over-represented in the remaining population. Seems not the most important factor.
@Menzie
I know your job isn’t to teach math or stats, but can you humor me this once?? I will try not to ask such questions again, as I am fully aware you didn’t get your Phd to answer such questions.
the “u” symbol with the subscript is your HAC error term yes?? and the zero with the line through it— θ — is a kind of “slope” or theta?? I’m kind of guessing you hate me for asking this.
Moses Herzog: “u” is the error term. Under standard assumptions, this error term is independent and identically distributed (i.i.d.). This assumption is often violated in practice, according to diagnostics. For instance the errors are either serially correlated (so the errors are not independent) or some errors come from a distribution that has a bigger variance than the others (so not identical, in this case heteroskedastic). These are the simplest types of violations to deal with. One standard approach is to estimate the standard errors dropping these assumptions, and that is Newey-West (after Whitney Newey, and my colleague in Economics here, Kenneth West).
The θ is the parameter summarizing the relationship between log population to log over-65 population. The interpretation of θ is then percent change in the number of fatalities per month for a one percent change in the over-65 population. The estimate of θ is positive as expected, but statistically insignificant at any conventional level. Typically, that would be the end of the story. However, we can also say the economic magnitude of the coefficient is small, 0.150. That means the point estimate is that each one percent increase in the over-65 population induces a 0.150 percent increase in excess deaths each month. Using 2016 figures, this implies an addition 3.7 fatalities when the 2016 average is 2740.5.
Thank you. I greatly appreciate this.
Moses Herzog Let me add a little more to the discussion. The “u” term can be thought of as representing the residual or difference between the actual and fitted value for each observation. The HAC approach is intended to kill two problems with one stone. Heteroskedasticity means the variance is not evenly distributed across the regression. For example, if you plotted the “u” term residuals against the regression line you might find (for instance) that the gaps between the residuals and regression line tend to increase as you move along the x-axis. That would signal heteroskedasticity. Heteroskedasticity invalidates the standard errors you often see in parentheses beneath the coefficients. Heteroskedasticity is oftentimes a huge problem when working with cross-sectional data, but typically less of a problem when working with time series data. The other stone killed by HAC is autocorrelation, which is a huge problem in time series data. In my regression I ignored the heteroskedasticity problem based on some prior tests, but decided to defeat autocorrelation by adding a lagged value of the dependent variable to the RHS of the equation. So I did not run the regression using HAC corrections. But adding another parameter to the regression (i.e., the lagged dependent) risks overparameterizing the regression, which improves the fit but usually hurts out-of-sample performance. So you check various “information criteria” to see if the improved fit is worth the cost of adding another parameter. In this case it was. And since I was adding a lagged value of the dependent variable, it meant that the forecast should be “dynamic” because the forecast for “t+1” affects the forecast for “t+2”. Whether you correct for autocorrelation by HAC or adding an AR(1) term (i.e., the lagged dependent) is sort of a case-by-case thing. There are pluses and minuses to both. One thing to notice is that adding an AR(1) term will usually change the coefficients on the other variables, which is why I got a slightly different conditional mean number than Menzie. The difference in the 95% number is because I used standard errors rather than HAC corrected error terms, so I got a tighter (but less reliable) fit.
Also, the reason the theta coefficient in the pop65 parameter is interpreted as a percent change is because both sides of the equation (i.e., “m”, “pop” and “pop65”) are expressed as logs. This is what’s called a log-log regression. I won’t show it here, but a little basic calculus proves that the coefficients represent responses expressed as percents.
I appreciate it. You and Menzie’s added explanations. More than you both probably imagine. Thanks!!!
Moses Herzog: Recommend highly Stock and Watson’s Econometrics textbook. It’s clear, easy to read; sure you can pick up a used copy cheap. It’s what I assigned in my public affairs stats course.
So here are the results of a slightly different model. I took Menzie’s data and ran the regression from Oct-2010 thru Aug-2017 (rather than Dec-2016). I also set an Oct-2014 dummy variable and 11 seasonal dummies. I also used the population parameter. Using logs stabilized the variance, so heteroskedasticity was not a problem per White’s test. This wasn’t a surprise since this was logged time series data. A much bigger problem was serial correlation, so I added one lag of the dependent variable. After running the regression I checked the correlogram and the Q-stats did not show any autocorrelation. The residuals were (barely) normal at 0.07. Not all of the coefficients were significant, including the population (not a surprise) and the Oct-014 dummy (which was a surprise). But overall the regression wasn’t too bad after comparing the various information criteria and loglikelihood. The adjusted R-square was 0.568. So not a great regression, but I’ve seen a lot worse in the real world.
The results were roughly in line with Menzie’s results. The excess deaths using the conditional mean came to 2213 from Sep-2017 thru Mar-2018 versus Menzie’s 2251. I did get a slightly higher number of excess deaths when using the 95% limit: 936 (Sep-2017 thru Nov-2017) versus Menzie’s 804. I don’t know if Menzie used a static or dynamic forecast, but I used an out-of-sample dynamic forecast. So there it is. I’ve also tried several other regressions, but the bottom line is that no plausible regression gives you numbers that are far away from each other. So I think we need to accept the fact that the mean forecast of excess deaths through March 2018 is something a little north of 2200.
2slugbaits: Suspect you got tighter fit by using AR(1) and regular standard errors instead of HAC robust, hence, got higher significant deaths. I didn’t use a lagged dependent variable, so for me static is same as dynamic out of sample.
Thanks for checking. Good to know somebody out there knows how to run a regression and conduct inference.
Tell the truth I am a little jealous of 2slugbaits on this. I get the broad outlines in my mind, the slope etc. This is “multiple” regression not linear. Yet when I try to crunch the numbers I just get flustered. and what is doubly annoying is, I know I had 3-4 classes where I did this at University, and yet can’t seem to manage it anymore (to much gin, vodka, and bourbon??). But one of these days I am going to crunch one out and put my numbers up in here. I am pretty determined to do that. I just need to run over the texts again. I can’t seem to find my old math book so I guess I’m just gonna have to download some shit.
@ 2slugbaits
What the hell is this?? Actually crunching out the numbers??
I find “Princeton” Kopits’ throwing stones test much more reliable. Sometimes referred to as the “doo-doo test”. It requires zero software packages, has very high variance in order to avoid being called out for error by actual academics, and only one very big dummy. On top of all that, it’s not time consuming. Add in some “muddy water” from contradictory statements, just to sprinkle in some zest to the laymen’s policy cure: “No federal aid for those lethargic hispanics.” Attach a blog link to a much more travelled website, and presto. After all, Orange Excrement tossed them a couple rolls of Brawny paper towels. What else could they possibly need??
What’s your number for Sept. 20 – Dec. 31, 2017, the period of the Harvard study?
Why are people like Omarosa, Michael Cohen, people at Trump’s “Apprentice” (and, no doubt, many others who may be working at the WH as you read this) making audio recordings around Donald Trump and around the White House??? I’m so glad you asked, because a pretty intelligent guy, Ed Burmila, has the answer:
http://www.ginandtacos.com/2018/08/13/press-rec/
If your boss was a slimeball scumbag, doing many illegal and traitorous things, would you have a digital recorder and/or phone mic handy?? No need to raise your hand in front of the class, Just answer the question in your own mind.
TalkingPointsMemo covers the effect of the Trump trade war on Wisconsin’s economy as politics:
https://talkingpointsmemo.com/dc/donald-trumps-trade-wars-are-roiling-wisconsin-gop
Interesting discussion but why no mention of Menzie’s posts on this topic?
@ pgl
Most of the best economists get very little to no attention. We could even mention Keynes at Bretton Woods. Some of his better ideas he ever had in his life (of many completely ignored) were aired at Bretton Woods. They are now the stuff of history books, such as that Meltzer book I had mentioned in this blog before. I am no Meltzer fan (if I am even spelling his name right), but his book is one of the few published that has Keynes’ writings on the squaring out of international accounts in it. (The book is a pretty penny and that is the ONLY reason I bought it). To this day I’m still wondering how the hell Krugman got the job at NYT. Maybe he has the “annoyance” factor going for him like J.R. Ewing on the old “Dallas” TV show in the 1980s. Krugman annoys enough right-wingers they can’t wait to “tune-in” as they love to hate him.
But your knowledge of economics is better than mine, you know how this goes with solid economists and media attention better than me.
pgl wrote:
Interesting discussion but why no mention of Menzie’s posts on this topic?
Because TPM was doing reporting from the campaigns in WI. It’s primary day there. You can go drop some links in the comments.
@ Menzie
am up to the 4th assumption of CLRM right now in my studies. This East Indian guy has some great visual representations in here that get some ideas across quite well. You know the type of 2 dimensional drawing that sort of “tricks” your eyes into seeing 3-dimensional look?? He has 2-3 in here that have been quite beneficial to me grasping the concepts in my mind, where I’m pretty sure I would be frustrated otherwise. His book (an older text) is much better than what I have read of “W”s book so far. Just to give you a hint who he is Menzie (i.e. which text of the two I have), he’s taught at MSU and got his bachelor’s at Berkeley. I think when I get where I can do R/ type stuff or what you do with Eviews, than “W”s book will be more useful—but right now I find the East Indian guy’s book MUCH more useful.
In fact Menzie, I wanted to get your Stock and Watson text, but beggars can’t be choosers, and I can’t wait to Christmas as I want to learn this shit NOW.
In fact, I trust you Menzie both inherently and implicitly on your OLS regressions and numbers you post on this blog, but I would get great personal satisfaction of being able to “crunch” the numbers myself after you gave rough outlines on how you yourself had crunched them.
Moses Herzog: All required data now online, here.
I had downloaded that .xlsx and then DL’d it again. You’re going to laugh at this. I consider myself to be pretty sharp, but sometimes it takes me awhile to register stuff—–I’m intelligent—but not quick-witted—I can grasp complex things but it takes me awhile. Like, you know what helps me the most on your memo???—>> the tables—the one with the final tabulations with some of them in red text numbers—-and you know what I just now figured out!?!?!?! That “QREG” was quantile regression, so now the table is making much more sense to me, then I can go back and do the regressions “going backwards”. I think I’ll do the “OLS” from the regular mean (that’s best for beginner yes??). Then if I get a good number on that I can “work outwards” (or “upwards”) and figure out the other regressions—but I figure if I can just get one of those regressions to work out on the number—then the other will start to “click” for me. It would be a “Breakthrough” for me on this topic. I think it will be weeks or months before I can do the HAC or Newey West type stuff—my mind just takes awhile
Don’t post this comment unless you think other readers might be encouraged to try to do these from what I am saying.
@ Menzie
Yeah, still too hard for me. What I was trying to do was figure out how you got the 546.13 from the 2928. Then from there I think the dots would connect faster once I got that 546.13 on my own. I know you explained it in the memo, but it’s still a deal of making the regression formula and putting the right numbers in. Obviously it’s something to do with the mean number of deaths from 2010 on, subtracted from the 2928, with the “residuals” and dummies thrown in for more accuracy, yeah?? I’m getting the general idea. Don’t tell me, not knowing will probably motivate me to keep reading the texts. There has to be something similar to this in the texts somewhere, but still taking baby steps.
https://www.youtube.com/watch?v=fA7LGqwjhYs
@ Menzie
Menzie, do you know anything about a program called “Gretl”?? Or know of “freeware” “openware” alternatives to Eviews that are good quality?? I have just (finally) discovered that maybe “OpenOffice” isn’t the best thing to run econometrics on. I have a high opinion of R/ but am afraid learning the programming lingo will “bog me down”
If anyone else has thoughts on this it would be very welcome and I would be grateful. THANKS!!!