Analysis of current economic conditions and policy
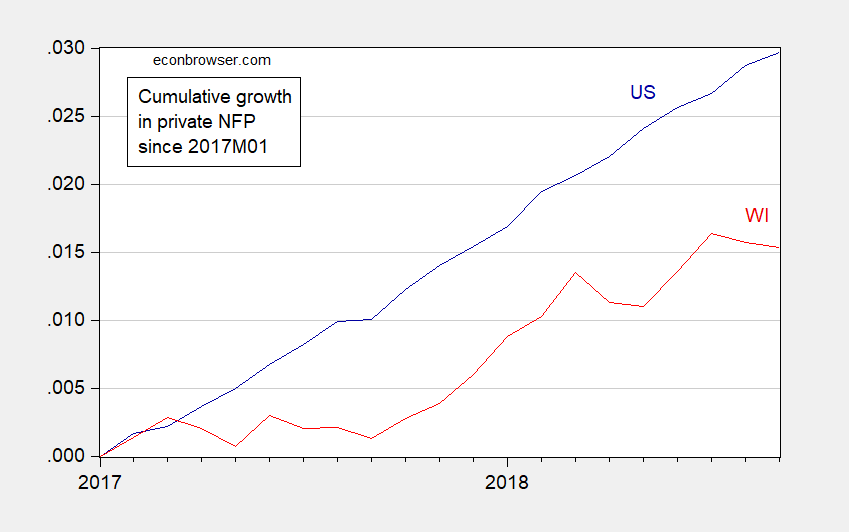
Private Nonfarm Payroll Employment Growth in US and Wisconsin (Not Pretty!)
Figure 1: US private nonfarm payroll employment (dark blue), and Wisconsin (red), both in logs, normalized to 2017M01. Source: BLS, DWD, author’s calculations.
22 thoughts on “Private Nonfarm Payroll Employment Growth in US and Wisconsin (Not Pretty!)”
Moses Herzog
Off-topic
Gee, who would have ever thought FOX business news would be the LAST to pull out of the Saudi conference?? I guess when great journalists are murdered by sicko governments that Trump loves dearly and sucks up to for blood money for him and his son-in-law, it really affects Rupert Murdoch and the other “family values” conservatives on the FOX executive board “in a deep way”. https://www.cnn.com/2018/10/18/media/fox-business-network-saudi-conference/index.html
Bruce Hall
Some 12-month changes in Non-farm Payroll as of August:
Except by your own figures, Wisconsin ranks #2 on your list.
pgl
Ohio ranks just above Wisconsin on Bruce’s little list here when you do the change over the last year. Maybe Bruce should check more carefully as over the past month (which was Menzie’s standard) Ohio employment fell.
C’mon Bruce – please define “doing fine” more carefully and also check your homework as your latest is really embarrassing.
Bruce Hall
pgl,
I finally stopped laughing long enough to reply to your “reply”. Think it through. Menzie’s premise was how badly Wisconsin was doing. So, how can you interpret my comment as anything except sarcastic? But I will grant you one thing: September preliminary data just became available and my post was based on August’s report (and the historical data do get modified somewhat in new reports).
So, yes, looks as if every state in the midwest is doing fine except Wisconsin. /sarc
You just have to be combative even when it goes against your normal narrative.
pgl
Oh wow – you moved your annualized comparison forward and Wisconsin is still #2. But guess what? This was not Menzie’s point, which I guess flew past your head.
When you stop laughing try to understand my simple point. You are looking at something over a year which is clearly not the same thing as looking at it over a more recent period such as the last month. I trust someone can mansplain that to you. Now if you learn to actually draw over the time graphs like Menzie has, then and only then you might see the light.
Bruce Hall
pgl, you seem to have lost sight of Figure 1 which has base January, 2017, so I believe Menzie was hinting rather strongly that his timeframe was longer than a month. Rather that compare Wisconsin to the whole of the U.S., I used BLS data to show yr/yr change for the midwest which makes sense because of the many variables affecting sections of the country differently.
Try a very difficult mathematical graphic representation:
• show a zero starting point as September 2017
• plot the percentage change points at September 2018
• draw lines between zero and the six state values for September 2018
If you can do this successfully, you will get a picture of the year over year changes. Actually, the lines are superfluous, but I thought you’d feel better about having them. And, if you really get into it, you can go back to the BLS data for which I provided a link and do the same exercise for as far back as you want to go and then I’d suggest the lines would be helpful. But it’s really unnecessary for this post.
And, yes, Wisconsin’s yr/yr performance for the past two months has been better than four midwestern states and worse than one. Is that a problem? I guess it is if you want to show that Wisconsin is doing badly vis-a-vis its neighbors.
joseph
Yesterday, Donald Trump was defending the assassination and dismemberment of a journalist with a bone saw.
Tonight at a campaign rally in Montana, the Thug in Chief physically mimicked and lauded Republican Representative Gianforte who last year grabbed a journalist by the neck with both hands, body slammed him to the ground and then beat him in the face with his fists while on top of him. Trump said that Gianforte, who pleaded guilty to assault, was “my kind of guy.”
Trump really doesn’t like journalists and envies authoritarian thugs like MBS and Putin who can murder them at will. This is looking more like 1930s Germany every day. Republicans are fine with this, as long as they get their tax cuts.
When I was a youngster, I wondered how an entire country like Germany could embrace fascism. Now I see how easy it happens, with a conservative majority that is just fine with a sociopathic president.
pgl
He does not like journalists. He really hates Muslims. And of course he despises women. Female Muslim reports – get a body guard!
That won’t explain all of it, of course. But when you combine low unemployment rates with net out-migration, there would seem to be at least some relationship to slower increases in employment. Wisconsin doesn’t appear to be alone in experiencing this situation in the Midwest.
Samuel
After eight years, compared to national trend lines, can we state that the Koch-sponsored experiment in state government delivers sub-par performance?
Samuel: For some observors, it’s always “Tomorrows another day” (to quote “Annie”).
pgl
I pray Bruce Hall does not give investment advise for people holding pharmaceutical stocks. It is often the case that such a stock can see a nice upward run on the hope that its promising new drugs will get FDA approval. But suppose we learned last week that one of their promising drugs failed the phase III clinical trials. Its stock valuation will have declined after that news came out.
I bet Menzie gets the point about new information but I get the sense that Bruce would look at the performance over the last year as guidance for where the future price will go. If Bruce does – he is going to lose his shirt BIG time. Do not follow his advise – ever.
Now you may be wondering why I wrote this. Just read Bruce’s mocking of Menzie’s post. I’m sorry Bruce but your comments were so dumb that you own dog is laughing at you.
Bruce Hall
pgl,
Trading stocks tends to revolve around a faster process than real economic movement in a state. But I will give you this: downturns can occur relatively quickly as seen for the entire U.S. in 2008 under extraordinary circumstances. Regardless, even in stocks with a faster movement than employment changes, there can be quick movements in both directions. One can be a day trader or in it for the longer term. I suspect from your perspective, you are a day trader. You might be spooked by a brief downturn, but a certain billionaire out of Nebraska would advise otherwise.
Do you have any insider information that a brief flattening of employment data for Wisconsin is indicative of future performance that is not likely to happen elsewhere in the midwest? Waiting….
And BTW, I wasn’t “mocking” Menzie’s post as much as disregarding the total U.S. comparison in favor of a regional comparison which I believe makes more sense. However, based on past posts about Wisconsin, I’d say that Menzie might be mocking the state’s current administration’s performance.
Bruce Hall: For indications of future performance, see Philadelphia Fed map of leading indices (August), here. My quick glance suggests WI (1.36%) is beating only OH (0.66%) in the regional comparators list… (And MN is 2.52%!!!)
pgl
I defer to the experts at the Phiily FED. Especially given that it had to hurt when their Phillies lost out to my Braves in the NL East!
Bruce Hall
Menzie, well I can’t argue with a Federal Reserve prediction, but I can question the basis.
The link below leads to comparative charts of the six midwestern states employment data from 1/17 to 9/18. They show four things:
1. change from 1/17 (your chart basis)
2. change from 9/17 (my comment basis)
3. change from 1/18
4. highlight of recent data points for four states with recent flattening or downturned employment
For prognostication purposes, one might want to at least look at points 3 and 4. Points 1 and 2 are getting a little irrelevant.
The trick to any trend analysis is to pick a starting point that supports one’s arguments, right? These six states do not move in concert, so comparisons using different starting points will result in different conclusions. In this instance, one could debate that recent performance (since 1/18) plus current performance (last 3-4 months) might give better insight into future performance than looking back to change from 1/17 or even yr/yr. But even that is iffy. Overall, I’d say that given all four points, Wisconsin’s employment performance has been sort of average. What’s striking is that Ohio’s employment growth stand quite a bit above the rest using all four points. Maybe The Ohio State University Buckeyes are driving the economy.
Of course there are external factors that must be built in to any projections. Will tariffs quash the growth in the “rust belt” states? Will tariffs quash the growth in agriculture dominated states (suppressing non-farm growth). Are there any non-economic issues that will affect employment growth? Can’t tell from the charts (BTW the link you provided to the Fed projections brought up a page too small and blurry to read).
Bruce Hall: Sorry, here is the webpage — go to the map icon.
You can plot all the series for whatever time span you want by using FRED (employment, coincident indexes…)
2slugbaits
Bruce Hall Maybe The Ohio State University Buckeyes are driving the economy.
I believe a true Buckeye would pronounce it “THE Ohio State University”
Bruce Hall
Menzie,
Thanks, I’ll keep trying that link, but I get a “Safari can’t open that page” message.
Regardless, I was really only addressing the historical chart regarding total non-farm employment in your post, not prognostications from various sources about total economic activity.
The future:
“Trying to predict the future is like trying to drive down a country road at night with no lights while looking out the back window.”
– Peter Drucker
“Prediction is very difficult, especially if it’s about the future.”
– Niels Bohr
“There is not the slightest indication that nuclear energy will ever be obtainable. It would mean that the atom would have to be shattered at will.”
– Albert Einstein
You know – if you ever learned to draw a graph, it might save us from reading your usual long winded rants. I get that one likely should look at a time frame longer than a month or two but the old adage a picture is worth a 1000 words applies here.
Off-topic
Gee, who would have ever thought FOX business news would be the LAST to pull out of the Saudi conference?? I guess when great journalists are murdered by sicko governments that Trump loves dearly and sucks up to for blood money for him and his son-in-law, it really affects Rupert Murdoch and the other “family values” conservatives on the FOX executive board “in a deep way”.
https://www.cnn.com/2018/10/18/media/fox-business-network-saudi-conference/index.html
Some 12-month changes in Non-farm Payroll as of August:
Ohio 1.6%
Wisconsin 1.5%
Minnesota 1.5%
Michigan 1.3%
Illinois 0.8%
Indiana 0.8%
Looks as if every state in the midwest is doing fine except Wisconsin.
https://www.bls.gov/eag/eag.us.htm
Except by your own figures, Wisconsin ranks #2 on your list.
Ohio ranks just above Wisconsin on Bruce’s little list here when you do the change over the last year. Maybe Bruce should check more carefully as over the past month (which was Menzie’s standard) Ohio employment fell.
C’mon Bruce – please define “doing fine” more carefully and also check your homework as your latest is really embarrassing.
pgl,
I finally stopped laughing long enough to reply to your “reply”. Think it through. Menzie’s premise was how badly Wisconsin was doing. So, how can you interpret my comment as anything except sarcastic? But I will grant you one thing: September preliminary data just became available and my post was based on August’s report (and the historical data do get modified somewhat in new reports).
September preliminary data. – https://www.bls.gov/eag/eag.us.htm:
Ohio 1.9%
Wisconsin 1.4%
Michigan 1.4%
Minnesota 1.3%
Indiana 0.9%
Illinois 0.8%
So, yes, looks as if every state in the midwest is doing fine except Wisconsin. /sarc
You just have to be combative even when it goes against your normal narrative.
Oh wow – you moved your annualized comparison forward and Wisconsin is still #2. But guess what? This was not Menzie’s point, which I guess flew past your head.
When you stop laughing try to understand my simple point. You are looking at something over a year which is clearly not the same thing as looking at it over a more recent period such as the last month. I trust someone can mansplain that to you. Now if you learn to actually draw over the time graphs like Menzie has, then and only then you might see the light.
pgl, you seem to have lost sight of Figure 1 which has base January, 2017, so I believe Menzie was hinting rather strongly that his timeframe was longer than a month. Rather that compare Wisconsin to the whole of the U.S., I used BLS data to show yr/yr change for the midwest which makes sense because of the many variables affecting sections of the country differently.
Try a very difficult mathematical graphic representation:
• show a zero starting point as September 2017
• plot the percentage change points at September 2018
• draw lines between zero and the six state values for September 2018
If you can do this successfully, you will get a picture of the year over year changes. Actually, the lines are superfluous, but I thought you’d feel better about having them. And, if you really get into it, you can go back to the BLS data for which I provided a link and do the same exercise for as far back as you want to go and then I’d suggest the lines would be helpful. But it’s really unnecessary for this post.
And, yes, Wisconsin’s yr/yr performance for the past two months has been better than four midwestern states and worse than one. Is that a problem? I guess it is if you want to show that Wisconsin is doing badly vis-a-vis its neighbors.
Yesterday, Donald Trump was defending the assassination and dismemberment of a journalist with a bone saw.
Tonight at a campaign rally in Montana, the Thug in Chief physically mimicked and lauded Republican Representative Gianforte who last year grabbed a journalist by the neck with both hands, body slammed him to the ground and then beat him in the face with his fists while on top of him. Trump said that Gianforte, who pleaded guilty to assault, was “my kind of guy.”
Trump really doesn’t like journalists and envies authoritarian thugs like MBS and Putin who can murder them at will. This is looking more like 1930s Germany every day. Republicans are fine with this, as long as they get their tax cuts.
When I was a youngster, I wondered how an entire country like Germany could embrace fascism. Now I see how easy it happens, with a conservative majority that is just fine with a sociopathic president.
He does not like journalists. He really hates Muslims. And of course he despises women. Female Muslim reports – get a body guard!
Some of the changes in Non-farm Employment may be related to this:
• https://object.cato.org/sites/cato.org/files/wp-content/uploads/migration_map_2.jpg
• https://object.cato.org/sites/cato.org/files/pubs/pdf/tbb-84-revised.pdf
That won’t explain all of it, of course. But when you combine low unemployment rates with net out-migration, there would seem to be at least some relationship to slower increases in employment. Wisconsin doesn’t appear to be alone in experiencing this situation in the Midwest.
After eight years, compared to national trend lines, can we state that the Koch-sponsored experiment in state government delivers sub-par performance?
Samuel: For some observors, it’s always “Tomorrows another day” (to quote “Annie”).
I pray Bruce Hall does not give investment advise for people holding pharmaceutical stocks. It is often the case that such a stock can see a nice upward run on the hope that its promising new drugs will get FDA approval. But suppose we learned last week that one of their promising drugs failed the phase III clinical trials. Its stock valuation will have declined after that news came out.
I bet Menzie gets the point about new information but I get the sense that Bruce would look at the performance over the last year as guidance for where the future price will go. If Bruce does – he is going to lose his shirt BIG time. Do not follow his advise – ever.
Now you may be wondering why I wrote this. Just read Bruce’s mocking of Menzie’s post. I’m sorry Bruce but your comments were so dumb that you own dog is laughing at you.
pgl,
Trading stocks tends to revolve around a faster process than real economic movement in a state. But I will give you this: downturns can occur relatively quickly as seen for the entire U.S. in 2008 under extraordinary circumstances. Regardless, even in stocks with a faster movement than employment changes, there can be quick movements in both directions. One can be a day trader or in it for the longer term. I suspect from your perspective, you are a day trader. You might be spooked by a brief downturn, but a certain billionaire out of Nebraska would advise otherwise.
Do you have any insider information that a brief flattening of employment data for Wisconsin is indicative of future performance that is not likely to happen elsewhere in the midwest? Waiting….
And BTW, I wasn’t “mocking” Menzie’s post as much as disregarding the total U.S. comparison in favor of a regional comparison which I believe makes more sense. However, based on past posts about Wisconsin, I’d say that Menzie might be mocking the state’s current administration’s performance.
Bruce Hall: For indications of future performance, see Philadelphia Fed map of leading indices (August), here. My quick glance suggests WI (1.36%) is beating only OH (0.66%) in the regional comparators list… (And MN is 2.52%!!!)
I defer to the experts at the Phiily FED. Especially given that it had to hurt when their Phillies lost out to my Braves in the NL East!
Menzie, well I can’t argue with a Federal Reserve prediction, but I can question the basis.
The link below leads to comparative charts of the six midwestern states employment data from 1/17 to 9/18. They show four things:
1. change from 1/17 (your chart basis)
2. change from 9/17 (my comment basis)
3. change from 1/18
4. highlight of recent data points for four states with recent flattening or downturned employment
For prognostication purposes, one might want to at least look at points 3 and 4. Points 1 and 2 are getting a little irrelevant.
https://www.dropbox.com/s/stnzfiprpsybbo3/Midwest%20Non-Farm%20Employment%20Changes.pdf?dl=0
The trick to any trend analysis is to pick a starting point that supports one’s arguments, right? These six states do not move in concert, so comparisons using different starting points will result in different conclusions. In this instance, one could debate that recent performance (since 1/18) plus current performance (last 3-4 months) might give better insight into future performance than looking back to change from 1/17 or even yr/yr. But even that is iffy. Overall, I’d say that given all four points, Wisconsin’s employment performance has been sort of average. What’s striking is that Ohio’s employment growth stand quite a bit above the rest using all four points. Maybe The Ohio State University Buckeyes are driving the economy.
Of course there are external factors that must be built in to any projections. Will tariffs quash the growth in the “rust belt” states? Will tariffs quash the growth in agriculture dominated states (suppressing non-farm growth). Are there any non-economic issues that will affect employment growth? Can’t tell from the charts (BTW the link you provided to the Fed projections brought up a page too small and blurry to read).
Bruce Hall: Sorry, here is the webpage — go to the map icon.
You can plot all the series for whatever time span you want by using FRED (employment, coincident indexes…)
Bruce Hall Maybe The Ohio State University Buckeyes are driving the economy.
I believe a true Buckeye would pronounce it “THE Ohio State University”
Menzie,
Thanks, I’ll keep trying that link, but I get a “Safari can’t open that page” message.
Regardless, I was really only addressing the historical chart regarding total non-farm employment in your post, not prognostications from various sources about total economic activity.
The future:
“Trying to predict the future is like trying to drive down a country road at night with no lights while looking out the back window.”
– Peter Drucker
“Prediction is very difficult, especially if it’s about the future.”
– Niels Bohr
“There is not the slightest indication that nuclear energy will ever be obtainable. It would mean that the atom would have to be shattered at will.”
– Albert Einstein
But, then, there is this:
http://graphics.wsj.com/fed-predictions/#c%5B%5D=Janet+Yellen&c%5B%5D=Charles+Plosser&d=0
If the best of the best gets it correct half of the time, perhaps we should be using a coin toss and save some overhead.
You know – if you ever learned to draw a graph, it might save us from reading your usual long winded rants. I get that one likely should look at a time frame longer than a month or two but the old adage a picture is worth a 1000 words applies here.
pgl,
I knew there were some who had problems with words, so I have already sent a comment that includes a link to a graphic that covers all four bases. Thanks for letting me know my work is appreciated. But I’ll repeat the link to the graphic here for you: https://www.dropbox.com/s/stnzfiprpsybbo3/Midwest%20Non-Farm%20Employment%20Changes.pdf?dl=0
A dialog box may open up asking if you want to open an account. You can click on the X to close it and view the picture.