Researchers have long relied upon the St. Louis Fed’s FRED and ALFRED databases for (primarily) US series. Now, Banque de France, CEPREMAP and France Stratégie have launched a new free database of international macro data, DBnomics.
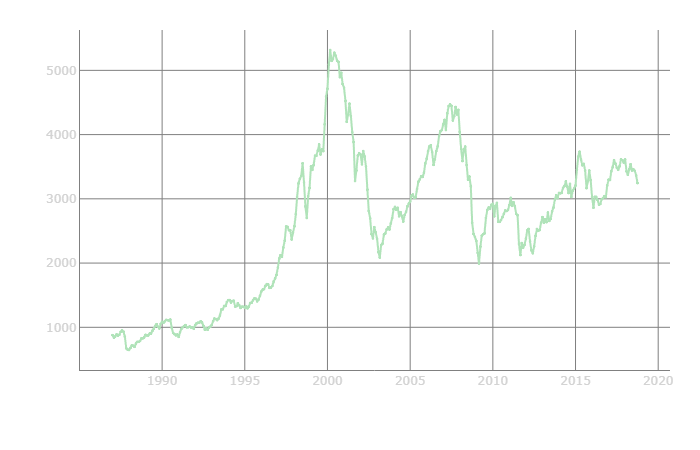
Figure: Eurostoxx 50 index.Source: DBnomics.
DBnomics brings together data from 45 providers with a graphic interface, and should make it such that commenters on Econbrowser can no longer assert they couldn’t access the relevant data to support their arguments. (And no more excuses for quoting numbers from Shadowstats, Breitbart, or Sarah Huckabee Sanders.)
It doesn’t include data from Fox Facts, or as Saturday Night Live likes to call it, “Feel Facts.”
This is going to hamper the research efforts of CoRev and PeakTrader!
why? they are not data dependent to begin with.
More fake news.
You don’t know what the data is telling you.
You ignore much of it, because it doesn’t fit your false narrative.
then explain why comrade trump could not close your output gap after two years of controlling both the white house and congress?
Interesting. FRED does have some foreign data but it is often limited. For example, it has mainly 10-year government bond rates and only on a monthly average – not a daily basis. OK, I know how to go to the local Central Bank websites but they are all a bit different and a little confusing. An international version of the excellent FRED machine is something to check out.
Professor Chinn or Other Experts,
Since we are talking data and perhaps forecasts, does anyone have an idea to share of what type of forecast was used to forecast New Orders for Durable Goods(DGORDER) for October 2018 released today? The Econoday consensus was for a M/M % change of -2.5% and the consensus range was -4.5% to -1.0%. The actual change shown is -4.4%, very close to the lowest consensus range. My hobbyist efforts using a non-linear model showed a forecast of -1.5%. A linear model showed a forecast of -1.0 %. What must the forecast model look like to forecast -4.4%? Just asking.
https://youtu.be/i3jI3RrMsVI?t=131
@ AS
This link provides some more details. It appears that it is the Commerce Department that tabulates the official numbers. One would assume there are some notes on the Commerce Dept site explaining how they make forecasts (or maybe it is just private outfits that make the forecast as opposed to Commerce tabulating the actual hard number).
https://www.bloomberg.com/news/articles/2018-11-21/weak-investment-leads-signs-of-cooling-momentum-in-u-s-economy (some humorous statements from Kudlow here, that, surprise, are wrong).
I will peck around the Commerce Dept and see if I can find out more on that, but my guess is you are already 2 steps ahead of me if you are doing “hobbyist” forecasts on your own.
@ AS
It appears this number can vary drastically (as you have observed with the most recent MoM number) and is very difficult to predict. I will keep hunting and pecking just for my own curiosity. But I don’t think there is a definitive answer to this question, and if there is it appears to be above my pay grade. If you uncover a way to predict it consistently correct ahead of time, you will have probably found a mathematical golden goose. I’m sure the logarithm programming geniuses are working on it as we speak/type.
Actually, they do not collect data on orders. They survey companies for data on shipments, backlogs and inventories and back out what orders would have to be to get the actual data reported on the other series.
Doe4s that answer you question?
Interestingly, what is actually reported can make a big difference in the inflation rate inferred by this data. If in one month new orders are dominated by more traditional goods rather than high teck orders it can cause the nominal value of orders to surge strongly and if the next month orders are dominate by high teck the nominal value will drop sharply. That is one reason this data is so volatile and why you should always smooth the data.
Moreover, the data no longer includes data on semiconductors. They use to get that data from a semiconductor trade group. But the trade group decided they could make a lot of money selling the information rather than giving it to the government. So they quit giving it to the government.
……. “commenters on Econbrowser can no longer assert they couldn’t access the relevant data to support their arguments” LOVE IT.
But Menzie knows the words that really excite me: “FREE databases”. “45 providers”……. say it again….. FREE…….. I think I’m getting a pre-Thanksgiving erection.
https://youtu.be/JBHKVAs85Ko?t=8
https://youtu.be/1fG3_pSpe5M?t=30
I do not know the reason why, but this link for “DBnomics” seems to be working better than the one Menzie gave. I am not even certain if it is the same data, but I’m like 75% sure it is the same data. Again, I am not sure why the link isn’t working, it may just be a problem on my end with the format or something.
https://legacy.nomics.world
Hey Moses Herzog,
DBnomics team here, thanks for your comment!
legacy.nomics.world is the previous version of DBnomics, soon to be deprecated. Could you give us some specifics on the problems you ran into with db.nomics.world? We’d love to help you use it.
You can also shoot us an email (contact@nomics.world) or post on the forum (forum.db.nomics.world) if you prefer.
I just noticed this at near midnight of Thanksgiving USA time (very late Thursday night) so I am extremely sorry for my slow response.
It’s extremely kind of you to respond. I think I figured it out. I had the browser set on “private” mode. When I turned the “private” mode off, the site came up correctly with the search function. I hope that won’t be “required” long term, that people have to have “private” mode turned off on the browser to access the DBnomics info.. But as you are performing a kind of “public service” to provide the information, I don’t think I could complain too much if that is the case.
Either way I think having these sites up, like DBnomics, for people to access is so great, and I hope my problem didn’t waste anyone’s time. Again, hope we can access it without “privacy” mode turned off on browsers, but I also understand for your own purposes if you can’t.
Warm regards to DBnomics, and our European friends from the USA (don’t mind or pay much attention to our current resider in the White House, we like our European brothers and sisters no matter what that orange fart bag donald trump says). HONESTLY we’d ignore the orange colored bastard ourselves if we had a choice on the matter.
Holy cr*p. When you subscribe to the RSS feed for DBnomics, it’s spitting out new sh*t like every 5 minutes. This thing is like the motherload or mother….. of databases. It appears you still have to go to the homepage to get the data off your RSS reader, but still the RSS update headlines are convenient to know if they have something you’re curious about.
Paraphrasing of SocGen’s US economic outlook. They were the most bearish of the large banks in their last year’s report:
https://www.zerohedge.com/news/2018-11-21/get-out-now-socgen-releases-most-bearish-2019-forecast-yet
Moses, I’m surprised that you say that https://legacy.nomics.world works better than https://db.nomics.world. In what sense? https://legacy.nomics.world is the legacy version of the prototype that we had one year ago. It has only 11 providers of data rather than 45 on the current one: https://db.nomics.world
@ Monsieur Juillard
I tried to explain that for some reason the link wasn’t working for me, and there was a chance the problem was on my end. Obviously didn’t explain it very well. I stand corrected.
https://youtu.be/bdks9im0wUo?t=5
AS, also note that real orders for non defense capital goods is a component of the leading indicator.
They deflate the nominal data with the PPI for final demand for private capital equipment (PA41312).
Spencer,
Thanks for the comments. As mentioned, I have found it very difficult to forecast DGORDER. I had not looked at real orders. I was also not aware of the data collection process. Are you saving that one should try to forecast shipments, backlogs and inventory levels and then back into the forecast of DGORDER (FRED data name)?
I tried to search “foreign capital investment” or “foreign capital inflow”. Many results did come up. But it was hardly straightforward to use any?