Today, we are fortunate to present a guest contribution written by Paweł Skrzypczyński, economist at the National Bank of Poland. The views expressed herein are those of the author and should not be attributed to the National Bank of Poland.
Is it worth to use the U.S. Economic Policy Uncertainty Index (EPUI) as measured by Baker et al. (2016) together with the yield curve slope to track the business cycle turning points?
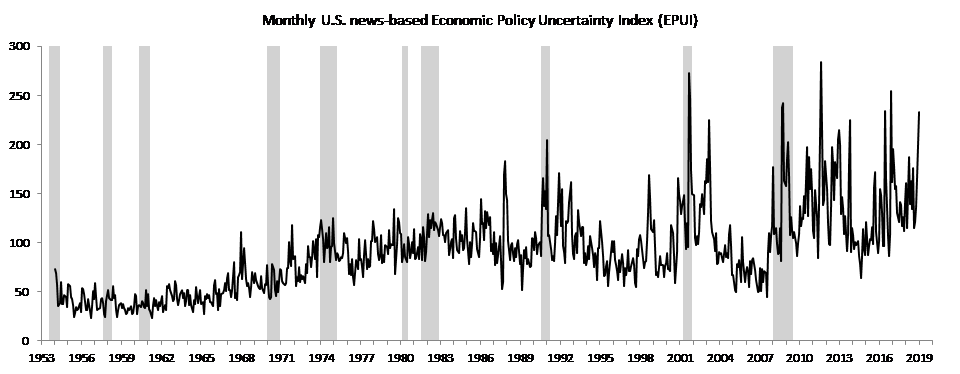
One can check how the EPUI performs when added to a standard term spread model specification to answer the above stated question. Monthly news-based EPUI time series goes back to 1985, however it is possible to construct a much longer time series of the EPUI with the use of historical data published at http://www.policyuncertainty.com. That is exactly what we perform here to obtain EPUI time series covering 1954-2018 period which allows us to estimate the augmented term spread model over the same sample as the standard term spread model. Namely we use monthly EPUI data covering Jan 1954 – Dec 2018 as shown in the figure below.
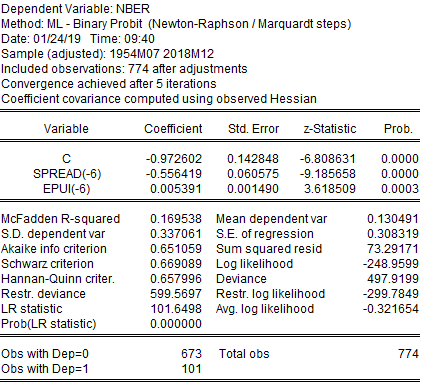
The analysis focuses on four specifications of probit models for the NBER dated recessions binary variable on the lefthand side of the estimation equation:
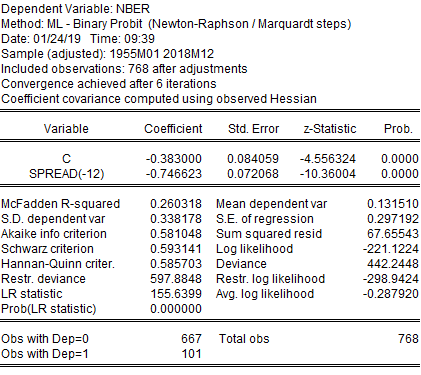
- spread_12 – model with 12-month lagged 10Y3M spread as the only regressor,
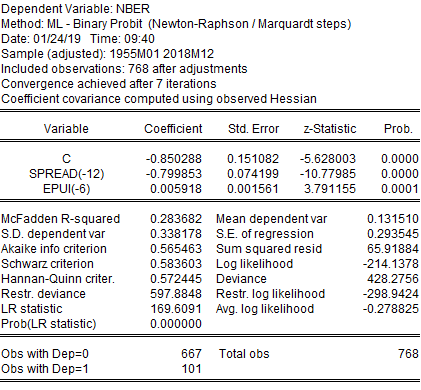
- spread_12_epui_6 – model with 12-month lagged 10Y3M spread and 6-month lagged EPUI as regressors,
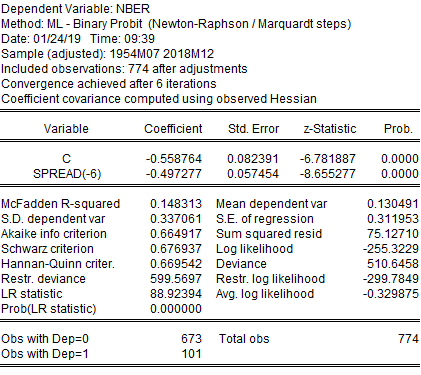
- spread_6 – model with 6-month lagged 10Y3M spread as the only regressor,
- spread_6_epui_6 – model with 6-month lagged 10Y3M spread and 6-month lagged EPUI as regressors.
Tables below report the obtained estimates of model parameters.
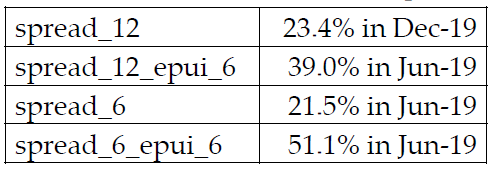
Figures below present the obtained U.S. recession probabilities in-sample and their out-of-sample forecasts. Due to the structures of models used only the spread_12 model is able to forecast 12-months ahead, while remaining models forecast 6-months ahead. The predicted probabilities are reported in table 5.
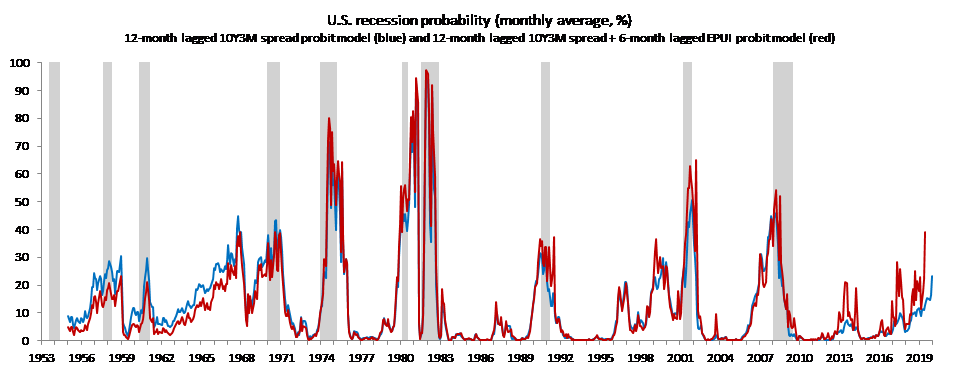
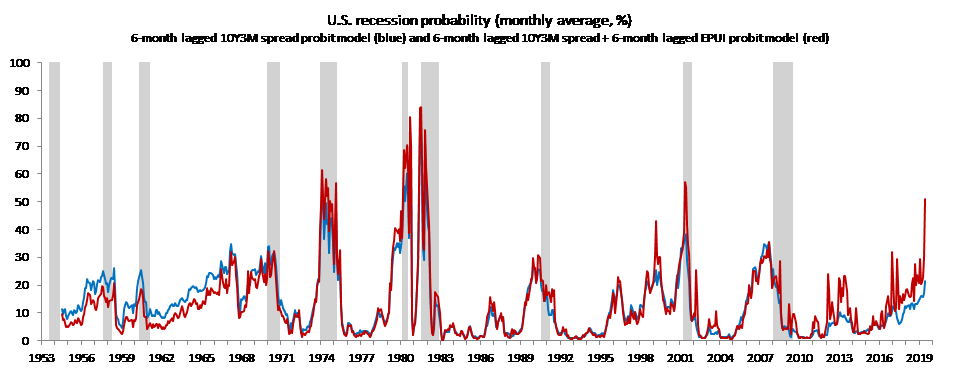
The general picture that emerges is that adding the EPUI to a standard term spread model increases the volatility of probabilities, especially during this expansion, which is not surprising given that the EPUI itself became more volatile in recent years.
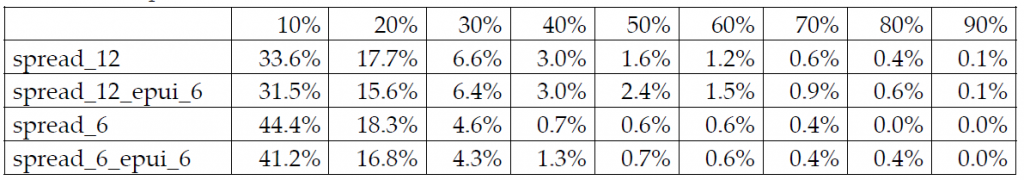
To check whether adding EPUI to the standard model makes sense we focus on the ROC curve analysis of the models. Table 6 reports false positive rates of the models for threshold probabilities from 10 to 90%. The indication here is not very appealing in favor of the augmented models as for 50% threshold models without EPUI are characterized by lower false positive rates.
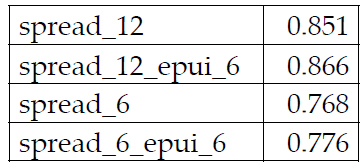
Similarly, AUROC values, which can be interpreted as the goodness of fit measure of the models, indicate that the augmented models are very similar to the standard ones. Table 7 reports the obtained AUROCs. It is worth to outline that the null hypothesis of AUROC being equal to 0.5 is rejected at any reasonable significance level for each model, so we may conclude that all the models do better in predicting economic activity turning points than a toss of a coin does.
Overall once again the standard 10Y3M term spread probit model occurs to be a very strong benchmark when it comes to tracking U.S. business cycle turning points. The presented analysis shows that gains of including the EPUI in a standard model are quite scarce. In turn the answer to the question stated at the beginning is that using the EPUI to track business cycle turning points doesn’t seem to improve much the signals generated by the term spread itself. You can do it, but it doesn’t seem that it will help you much. Back to the drawing board then… Nevertheless, be aware that all models used here indicate that during 2019 the predicted odds of a recession in the U.S. are on the rise, which is associated both with the recently flattening yield curve and rising economic policy uncertainty.
References
Scott R. Baker, Nicholas Bloom, and Steven J. Davis. 2016. “Measuring Economic Policy Uncertainty.” Quarterly Journal of Economics, vol 131(4), pages 1593-1636.
This post written by Paweł Skrzypczyński.
I don’t pretend to fully understand all the stats or econometrics involved, but I have fuzzy idea here and there. Seems like a nice post, and relatively speaking the question was answered. Maybe not 100% but like 85% certainty??
I also wanna say it’s very cool to see someone move from the comments section to the official posts section of the blog. Yay!!! Yay Paweł Skrzypczyński !!!! Hats off to Pawel. I think I only saw that happen twice on my old haunting grounds at James Kwak’s BaselineScenario blog. One of which I strongly disagreed with Kwak allowing that person to put the post up. But Kwak wanted to have varying viewpoints on the blog and it was obviously his call to make.
Here we have the all-too-common econometric penchant of using a 10-pound maul to drive a slender 1-inch framing nail. Moreover, the basic question itself is wrong from the outset. The correct question is: What do the host of reliable leading indicators say? Not what do these two series alone say, one of which is a reliable indicator.
This error is compounded by utilizing all data since 1954. There are two things drastically wrong with doing so. The complexion of the economy has evolved dramatically over the postwar years. As Jorda, Schularick, and Taylor say: In advanced economies, a century-long near-stable ratio of credit to GDP gave way to rapid financialization and surging leverage in the last forty years. Most notably, in pre-1985 years the level of overall debt mattered little. Since 1985, however, the level of debt matters a lot. On the margin, by now exponentially so. To get a forecast of when the next recession will get underway – the whole point of indicators like these – using data since 1985 will give far greater forecast accuracy than clouding up the picture with data from back in the 50s and 60s. There are three cycles to work with since 1985, all three being more meaningful to the current cycle because they took place in this era of debt.
Not only this. But using all data over the entire extent of the cycle to forecast the peak of the cycle is far inferior to using just expansion data. In other words, data from the down phase of cycles should be thrown out in the estimation process. Of course, this messes with the ability to use tools like logit or probit. The usefulness of these methodologies is relegated for the most part to tightly framed narrow spheres of inquiry. Whereas no sphere is larger than that of the economy, or the economy augmented by the larger political and geopolitical sphere.
Does using uncertainty data improve on using the yield curve by itself. Yes to an extent it does as shown here. This is a case of adding data – that is, information – in the form of another independent variable. But it completely overlooks tossing out data – the down phase of the cycle – data that has absolutely nothing to do with calling the peak of the cycle.
Moreover, why if you were going to go through this useless-from-the-outset exercise would you limit yourself to 6-month and 12-month lags? Depending on the length of the series and the starting date, in general these lags will only coincidentally be the correct ones. This model could be improved upon by the simple expedient of getting the lags correct.
Having said all this, in real time using the proper tools in the toolkit the earliest month to expect recession is August. The latest expected date is next (2020) April. It is 95% probable that recession will start sometime in this 9-month interval, with the central tendency being December. From the alternative perspective of what coincident data are saying at this moment, all sectors of the economy except that of the consumer are either in recession or are exhibiting strong downward momentum with little hope of pulling out of their dive. The downturn in global trade and rest-of-the-world economic activity is just icing on the cake.
As for the extraordinary number of false signals uncertainty has thrown off during the current expansion, this makes its own statement.
Presumably during the data-mining part of this study, it was determined that lags less than or greater than six months lags for the Economic Policy Uncertainty Index variable produced less attractive results.
Which begs the question: why are lags used for the EPUI variable not the same as the yield spread variable, e.g., 12 months?
If the yield curve forecasting model works in part because of delays between CAPEX budgeting and actual expenditures, then if the EPUI variable is capturing sentiment among those who actually determine business plans, the the lag effects should be similar. Here I am assuming that business sector decision making drives economic fluctuations and not so much household budgeting decisions.
Erik Poole: In my (nonsystematic) assessment, smaller lags do better for EPU. 6 and 12 months are standards in the yield curve literature, so that’s why those lags were (somewhat arbitrarily) selected. I believe Dr. Skrzypczyński has used 1 lag of EPU before in other analyses, to obtain “better” results, but I’ll let him respond directly.
to track the business cycle turning points?
I’m wondering if a standard single dependent variable probit style model is really the best way to test for “turning points.” What if we reframe the question to ask whether the independent variables can predict the state of the economy 6 or 12 months out, but recognize that there are really three potential states: recession, expansion, and steady. And if we’re looking for business cycle turning points, then why restrict ourselves to NBER dated recessions? For example, if the economy slides from 4 percent growth to 1% growth, most people would likely regard that as a downturn in the economy even if NBER doesn’t call it a recession. Suppose we define “steady” as the mean growth rate plus or minus one standard deviation, with anything above that threshold defined as “expansion” and anything below it defined as “recession”? In something like a multinomial logit model the reference state would be the steady state. The output from such a multinomial logit model would tell us the probability of the economy jumping (or turning) from one state to another given the independent regressors. Anyway, just a thought.
Why a logit specification rather than a probit? No good reason. I’m just old school and find it more natural to think in terms of logits.
I just think some of these things are historically important. I hope Paweł Skrzypczyński or anyone else doesn’t think I am stepping on their toes here, because that’s not my intention:
https://www.youtube.com/watch?v=N3fjW7IE0PU
https://www.youtube.com/watch?v=jXHazWuwIfc
I may see if I can find links to some of the court documents, Mueller or SDNY, and put them up in the blog sometime. It appears Roger Stone is going for a presidential pardon (I know, all of you are “shocked”). I’m wondering if SDNY or other state level courts can go after Roger Stone?? You have to presume or surmise Mueller has already thought of this, whether it was a pliable strategy or not, and acted accordingly. I’m not sure if donald trump even now knows, or has realized, how much damage SDNY can do to him once he leaves office.
Thanks all of you for your comments, as usual I see that Econbrowser is the place where interesting discussions take place. Let me replay.
@ Moses Herzog
Thank you! You’re far too kind!
@ JBH
I used 1985 as the starting point of the sample and actually the probits of this type turned out to work well only for small lags of the EPUI (I actually elaborate a bit more on that in my reply to Erik Pole below). That is why I turned to longer series, because I was curious and actually I wasn’t surprised to see that adding “long” EPUI to the term spread probit helps minimally. You mentioned “the extraordinary number of false signals uncertainty has thrown off during the current expansion makes its own statement” and I totally agree with that. As to your other comments on dropping recessionary data from the analysis – indeed it is what we can do but with different econometric tools.
@ Erik Pole and @ Menzie Chinn
Indeed I tried the specification with 1-month lagged EPUI, actually 1-month lagged 6-month moving average of EPUI and a 12-month lagged 10Y3M spread on a sample 1985-2018. That is exactly the model that Laurent Ferrara proposed in this post https://econbrowser.com/archives/2019/01/us-recession-probability-term-spreadepu-model. It works fine but… to forecast further than 1-month ahead you need to make assumptions on the evolution of the EPUI itself over the forecast horizon which isn’t the best idea I guess. That is why I choose to lag the EPUI by 6 months. At the same time the 12-month lagged EPUI just doesn’t work here – you get insignificant estimates, so that is why I stick to the models presented in my post.
@ 2slugbaits
Interesting idea, I just used the standard expansion-recession definition of the cycle here as the NBER dates are straightforward to use. Perhaps my question stated at the beginning might be formulated somewhat differently. It is indeed the case that I wanted to check whether the augmented models can predict recessions and I guess the “turning points” statement might be somewhat misleading.
Let’s take, what at the moment should be viewed as a complete hypothetical.
What if you have a man, named “Corsi”. And Corsi is a complete dope. He’s a moron, and “Corsi’s” “friends” all know that “Corsi” is a moron. So Corsi is a very good middleman, you might think of “Corsi” as a “mule”, that instead of transporting drugs, transfers information. Now let’s say an outfit called “WikiDrips” passes info to Corsi. Then Corsi passes that info to a man named “Stone”. Then Corsi SUDDENLY gets a $15,000 per month job from a friend of Stone’s doing a radio show, we’ll call him “Jonesy” and “Jonesy” has a radio show called “Info Battles” listened to by a very large pack of illiterates. Why would “Stone” give a job to Corsi from his friend Jonesy?? Why would someone do that?? And later, when asked who was the middleman for info from “WikiDrips”, “Stone” gives a different man’s name (We could call this hypothetical person “Randy RedHerring”) than Corsi’s name, even though “Corsi” was the middleman?? Because they were exchanging recipes on how to make the best Vietnamese style Pho soup at home??
https://www.washingtonpost.com/politics/witness-in-special-counsel-probe-former-stone-associate-collected-payments-from-infowars-through-job-stone-arranged/2019/01/24/4dfa4300-1e57-11e9-9145-3f74070bbdb9_story.html
https://www.youtube.com/watch?v=EqBxKvJPTfA
Reach your own conclusions folks, but I’m wondering why a candidate for President or a sitting U.S. president would need to call an adviser on unlisted phones, blocked phones or associates’ phones?? What would the point there be?? Wouldn’t the idea there be to use a secure phone line, rather than phone lines that obfuscate who are the parties involved in the phone call or obfuscates who initiated the phone call??
https://www.washingtonpost.com/politics/trumps-night-owl-calls-to-roger-stone-in-2016-draw-scrutiny-in-mueller-probe/2018/11/28/77d6174e-f332-11e8-80d0-f7e1948d55f4_story.html
Apparently, they were not so secure.
I don’t think either man denied communicating on the phone with each other. The deeper question is, does the FBI or anyone else have recordings or some form of dialogue of the communications. If there were wire tap recordings, bugs, etc. (and that is a HUGE IF, and a very doubtful if) that is roughly the moment where Roger Stone craps his own pants.
The yield curve is not a direct component of demand in the economy and therefore not Keynesian.
The direct components — real personal consumption expenditures have been rising steadily: https://fred.stlouisfed.org/series/PCEC96,
gross private domestic investment has been rising strongly: https://fred.stlouisfed.org/series/GPDI
and federal government deficit spending is now increasing strongly: https://fred.stlouisfed.org/series/FYFSD.
Only the trade deficit is now a significant drag on demand: https://fred.stlouisfed.org/series/BOPGSTB
Trump’s trade war is the major headwind along with the Fed’s rate increases and balance sheet run-off which could precipitate a credit crunch.
Observing the real moving parts of the economy would seem to be more productive. Of course there are always Black Swans such as the oil shocks of the 1970s and the Wall Street mortgage frauds that produced the Great Recession.
“The yield curve is not a direct component of demand in the economy and therefore not Keynesian.”
The money supply is not a direct component of demand. Nor are exchange rates. Are you claiming that any IS-LM model or any Mundell-Fleming model cannot be Keynesian????
Like any model, both IS-LM and MFM are limited by their assumptions albeit they purport to be Keynesian. As Minsky said, however, “such Keynesian models are either trivial (the consumption-function models), incomplete (the IS-LM models without a labor market), inconsistent (the IS-LM models with a labor market but no real-balance effect), or indistinguishable in their results from those of the older quantity-theory models (the neoclassical synthesis).” John Maynard Keynes, pp. 50-51.
Likewise, as Keynes himself said, “It is a great fault of symbolic pseudo-mathematical methods of formalising a system of economic analysis, such as we shall set down in section vi of this chapter [21], that they expressly assume strict independence between the factors involved and lose all their cogency and authority if this hypothesis is disallowed; whereas, in ordinary discourse, where we are not blindly manipulating but know all the time what we are doing and what the words mean, we can keep “at the back of our heads” the necessary reserves and qualifications and the adjustments which we shall have to make later on, in a way in which we cannot keep complicated partial differentials “at the back” of several pages of algebra which assume that they all vanish. Too large a proportion of recent “mathematical” economics are mere concoctions, as imprecise as the initial assumptions they rest on, which allow the author to lose sight of the complexities and interdependencies of the real world in a maze of pretentious and unhelpful symbols.” The General Theory, p. 297.
Are you claiming that IS-LM and MFM have the power to predict the next recession?
If Trump’s trade war is a major headwind, would free trade be a much better option for the US?
Free trade is not an option in the international marketplace.
I think the point of watching the yield curve is you want a “precursor” to a recession. The same with EPUI—a “precursor” to events. Yeah, “on the ground” data is useful, no one said it wasn’t (i.e. I basically agree with you). But often times by the time you see that “on the ground” data, either the damage has been done or has provided you no anticipatory value. One “on the ground” number that has a lot of anticipatory value is credit numbers. The amount of credit, the ratings of credit, and the quality of credit (which sometimes, as we found out around 2009, the quality of the credit is not reflected in the ratings, because the rating issuers, banks, get paid a fee or a commission to ignore the true underlying value/quality of the credit issuances).
Those who follow bonds are often said to be smarter than those who follow equities. This may or may not be true. But I suspect bond traders and credit people get this reputation of being smarter than equities folks because when you trade in things sensitive to default (or maybe you own/trade C-tranche “securities”), you’re much quicker to pull down on the building fire alarm than the equities cats who make their money on commissions, “active management” bullshit cons on brokerage accounts and funds, or front-running your own customers’ trades (the “principal-agent problem”). They get paid the same whether you’re buying or selling stocks, equity brokers get a commission on both sides of the trade, buy or sell.
But to make a short story long—-I would be paying close attention to bonds and credit (household and corporate) in this stage of the game.
How long will it take after we spend how many billions of U.S. government taxpayer dollars building a fence as puny as donald trump’s hands for stories like this to break??
https://twitter.com/CBPArizona/status/1088160469305634816
Do you think border patrol will be there every time this happens, and each time they get more and more proficient at doing it?? If you think that, then you passed the “I’m dumb enough to be a MAGA voter” IQ test.
“And a week or so ago, 376, in the same sector, dug a tunnel under.”
Pat Kimble’s tweet. El Chapo is an expert at doing tunnels!
I know some people will laugh at this, but it’s really not that much of a stretch. Yeah, tunnels are cheaper, drones are cheaper. Anti-drone technology are cheaper (talking the costs to Sinaloa and Jalisco here). but again look at the quality of the fence if Pelosi craters like she always does. Look at the dollars involved, more so for drugs, but even human trafficking on a mass scale earns a lot of money. I am going on record now as saying they will use explosives on certain sections of the fence. That’s only a matter of time.
It’s going to be entertaining observing all the seepages in that fence over time, if you can block out of your mind the billions that will probably be wasted on this fence. This is where my little quarrel with Barkley Jr. will be resolved, If Pelosi builds any portion of that fence and signs off on it—she is weak. I still think she shows signs of early dementia. You can see it in her eyes. There were people (similar to barkley Jr. ) insisting there was nothing wrong with Reagan when he clearly had early Alzheimers. He had that blank look in his eyes way before he left office. Pelosi has that same dead look in her eyes sometimes. We’ll see what happens. Even if Pelosi’s mind is still dexterous and adroit (which it isn’t) I put about 80% odds she coddles trump with large portions of his fence. We’ll see……..
It seems Trump has hired Bruce Hall as his immigration expert!
https://talkingpointsmemo.com/news/reeling-from-shutdown-loss-trump-spews-misinformation-about-immigrants-on-twitter
“On the heels of caving to Democrats over his demands for border wall money — which did not bear fruit, aside from a record-breaking 36-day partial government shutdown — Donald Trump bombarded Twitter on Sunday with waves of presidential misinformation.”
First set of lies had to do with that voter fraud scam put forth by the Republicans but here is where Bruce shined:
“We are not even into February and the cost of illegal immigration so far this year is $18,959,495,168. Cost Friday was $603,331,392. There are at least 25,772,342 illegal aliens, not the 11,000,000 that have been reported for years, in our Country.”
That was Trump’s 8:44AM tweet. TPM says:
“It’s unclear where these numbers come from.”
No – it is very clear where this intellectual garbage comes from – a standard Bruce Hall comment!