One argument against the secular stagnation thesis is that the risk-adjusted real rate is not particularly low. I’m dubious.
In Figure 1, I depict the real ten year Treasury yield, adjusted by survey-based inflation expectations (from the Cleveland Fed, Survey of Professional Forecasters), and the TIPS yield.
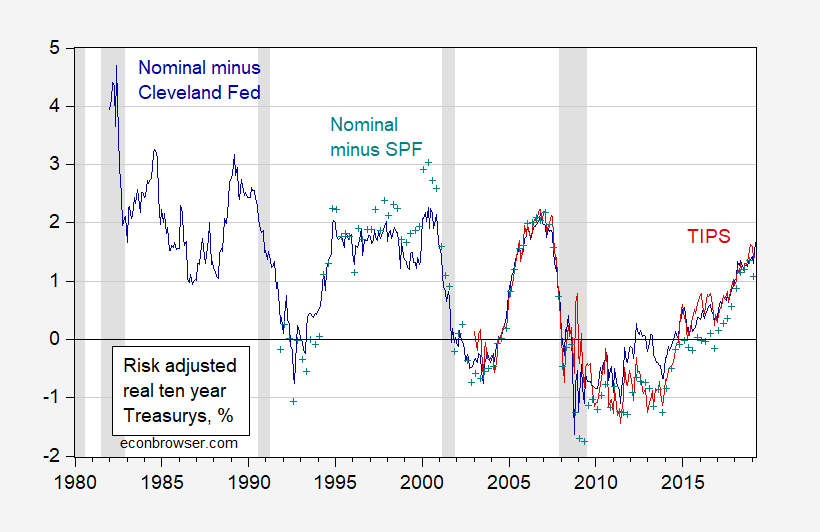
Figure 1: Ten year constant maturity Treasury yield adjusted Cleveland Fed ten year expected inflation and Kim-Wright term spread (dark blue), adjusted by Survey of Professional Forecasters median ten year expected inflation and Kim-Wright term premium (teal +), and TIPS yield adjusted by Kim-Wright term premium (red). NBER defined recession dates shaded gray. Source: Fed, Cleveland Fed, NBER and author’s calculations.
Notice that real risk-free rates have declined, particularly relative to the 1980s. However, it is true that the decline is less apparent than in the typical graph using unadjusted real rates. This is shown in Figure 2.
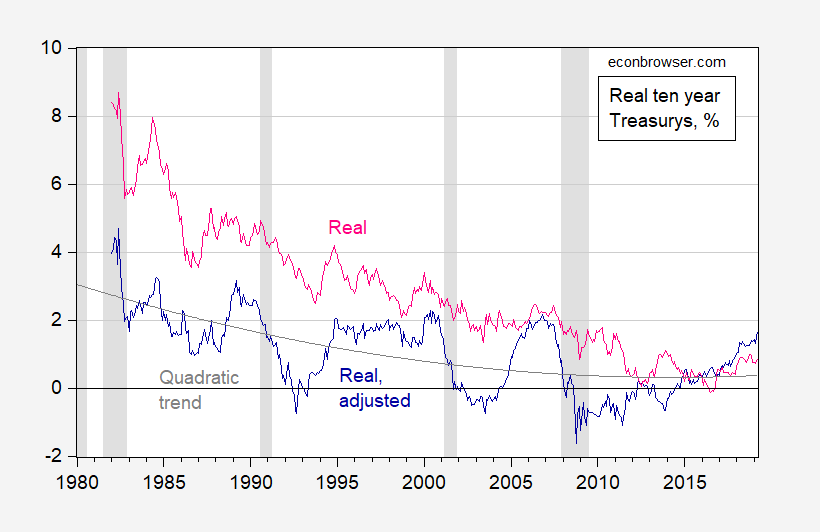
Figure 2: Ten year constant maturity Treasury yield adjusted Cleveland Fed ten year expected inflation and Kim-Wright term spread (dark blue), quadratic trend (gray), and ten year constant maturity Treasury yield adjusted Cleveland Fed ten year expected inflation (pink). NBER defined recession dates shaded gray. Source: Fed, Cleveland Fed, NBER and author’s calculations.
The adjusted real tend year rate is trend stationary (can reject a unit root null). I estimate a quadratic trend shown in Figure 2. The trend is downward sloping, and statistically significantly so. In other words, risk adjusted rates are lower.
It may be the case that the risk adjusted real rate rises in the near future. I will merely note that yet another alternative measure of the (short) risk-free natural rate (Laubach-Williams 1-sided estimate) suggests that real rates are low…
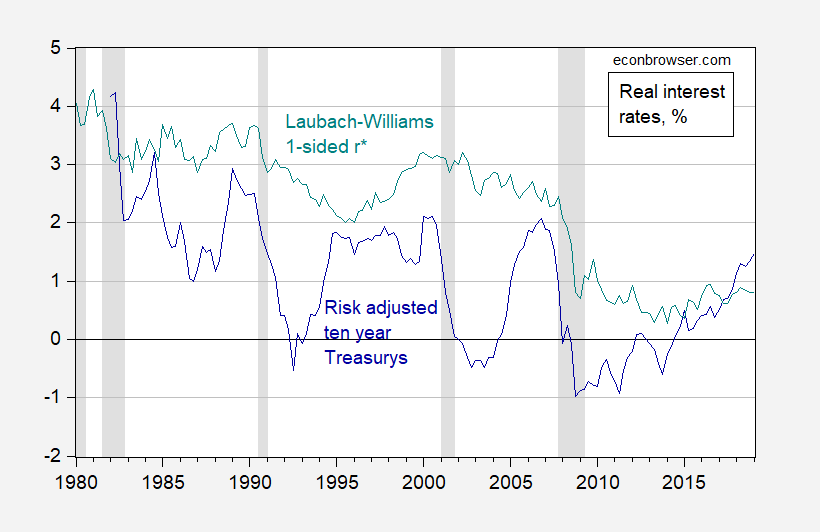
Figure 3: Ten year constant maturity Treasury yield adjusted Cleveland Fed ten year expected inflation and Kim-Wright term spread (dark blue), and Laubach-Williams one-sided estimates of natural rate (teal). NBER defined recession dates shaded gray. Source: Fed, Cleveland Fed, Atlanta Fed, NBER and author’s calculations.
Linking to the National Review. Menzie you’ve sunk to new lows. (Hopefully by this point you know, as I hold you in high esteem, that is friendly teasing). Nonetheless, I will tell you so as to avoid the slightest of rancor—that is friendly teasing.
The National Review may have a terrible reputation which was well deserved during the reign of Kudlow. But this oped was actually not that bad. At least the authors understood what a real interest rate was. Ask Kudlow and Stephen Moore just for laughs at their incoherent replies.
This article is from 10 months prior. Still interesting.
https://www.bloomberg.com/opinion/articles/2018-06-13/gundlach-sees-6-yield-in-3-years-anyone-else
I was hoping there would be a link that details Dunham’s and Fullerton’s logic or rational for their 4.6% numbers (which I think to most people’s ears seems a much more reasonable number than 6%, which sounds pretty wild at this stage). If anyone agrees with these 3 guys’ forecasts or has a link with a detailed case for such numbers, I sure would love to see them. I’m not saying it’s impossible, I’m just saying I would like to see the argument presented in thorough detail.
Interesting article on inflation in the Wednesday, May 1, 2019 WSJ, page A2. The article shows a chart comparing CPI to an online price index. The source of the chart is Austan Goolsbee and Klenow (2018).
The summary is that the CPI seems to show higher inflation compared to the online price index.
May be worth a post. I can’t remember if a comparison has appeared in the past on Econbrowser.
AS: As I recall, BPP (Billion Prices Project) matched US CPI pretty closely.
AS Isn’t the Billion Price Index primarily geared towards goods whereas CPI covers both goods and services? Not sure on that, but I thought I read that somewhere.
2slugs,
Did you mean to address your question to Professor Chinn? I get the sense that the Billion Price Index is primarily geared towards goods.
The Wikipedia link follows.
https://en.wikipedia.org/wiki/MIT_Billion_Prices_project
It seems that we have again bond markets versus stock markets again.
bond markets have usually been right in my memory
Why call this “risk adjusted”? The premium has become negative. I think “term premium” would be more accurate. Just sayin.
The sec-stag hypothesis was just an overblown over-reaction to the great recession. In 2013, some people assumed that it was going to be an L-shaped recovery (permanently lower), because it did not snap back like our previous V-shaped recoveries. In fact, it was a U-shaped recovery due to the lack of an appropriately large stimulus. We had a $6 trillion gap, so we needed a $4 trillion stimulus, if you have 1.5 multiplier effect (4*1.5=6). Instead, we got $1 trillion stimulus, so it took a long time to recover. The last 10 years have been best explained by Keynesian Econ 101, and anyone who has tried to complicate those simple explanations have been wrong, and that includes the sec-stag people.
Plus, the original sec-stag hypothesis required a whole lot of things that are not present now, such as a declining population. Our fertility rate at 1.85 plus immigration means that we actually have a growing population. I think it’s best to stop using this phrase to describe the current situation.