What the heck? Here’s what the Trump-Hassett CEA reports in February.
Source: ERP, 2019, as edited by MDC (orange arrow).
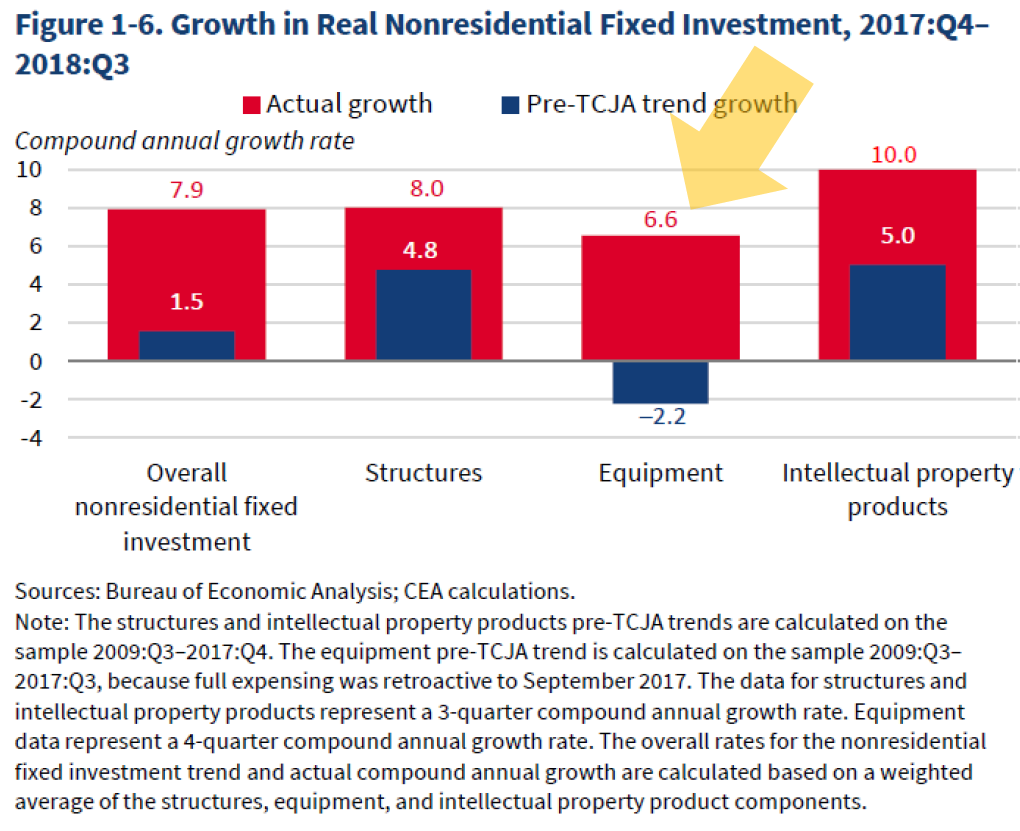
Consider carefully the bars highlighted by the orange arrow. If you look at the data for equipment investment in real terms, 2009Q3-2019Q1 (2nd release), one obtains the following graph. It’s hard to see how the pre-TCJA trend growth rate is negative.
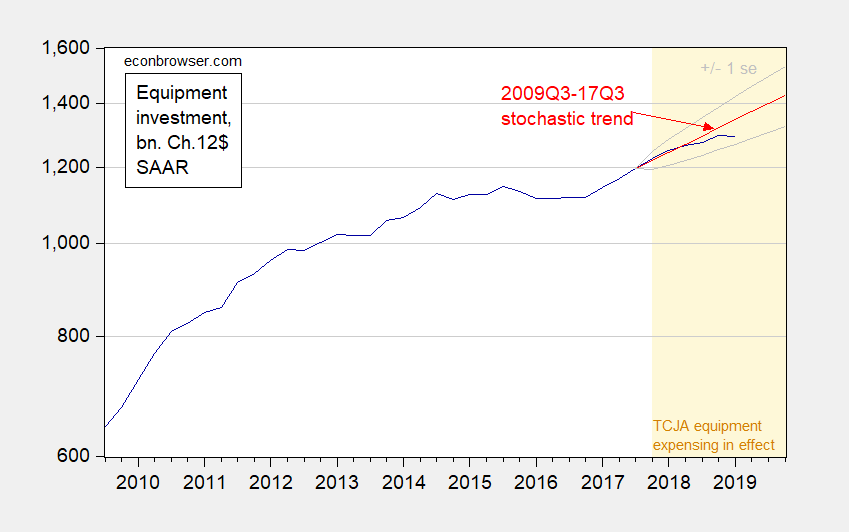
Figure 1: Equipment investment, in bn Ch.2012$, SAAR (blue, log scale), stochastic trend estimated on logged data, 2009Q3-2017Q3 (red), +/- 1 se prediction interval (gray). TCJA period for enhanced expensing shaded orange. Source: BEA 2019Q1 second release, author’s calculations.
My calculations indicate that (stochastic) trend annual growth rate over the pre-TCJA period indicated by the ERP is 7.8%, not -2.2% as indicated in ERP Figure 1-6. The TCJA period growth rate is 6.4%, rather than the 6.6% reported. Using the vintage the CEA probably used (December 2018 release) does not change these fundamental patterns. It might be that CEA is using net rather than gross investment; if so, I could not find an indication that this was the case in the text. (Data here).
Interestingly, the most recent data shows the investment boom is faltering, and faltering significantly relative to pre-TCJA trend. (I use a stochastic trend because log equipment investment fails to reject the unit root null using ADF, and ERS-DF, and rejects trendstationary null using KPSS).
So, I’d welcome any thoughts on this puzzle — have I misread something or is there a mistake in the ERP?
Update,6/4 2PM Pacific:
Upon reflection, I think I have determined what is going on — and my confusion is partly due to my mis-reading. The key is to read the notes to the figure:
The overall rates for the nonresidential investment trend and actual compound annual growth are calculated based on a weighted average of the structures, equipment, and intellectual property product components.
This means the red bar is an actual growth rate calculated in the standard manner. The blue bar is the year-by-year decline in the trend growth rate in investment — not the corresponding average annual growth rate over the pre-TCJA period. I think the way this is number is calculated is by estimating a quadratic trend, and calculating the implied annualized decline in the growth rate. I get pretty close to the figures in the bar charts. The difference might be attributable to how the CEA staff estimated the pre-TCJA trend (deterministic or stochastic; see this post for discussion).
I will say that the notes to this figure are not the most transparent; indeed, one might say they are misleading, given that the vertical axis is actually denoting two different variables even though the text suggests the same variable over two periods is being plotted.
Update, 6/6 8:45AM Pacific:
Here is my re-interpretation of CEA Figure 1-6.
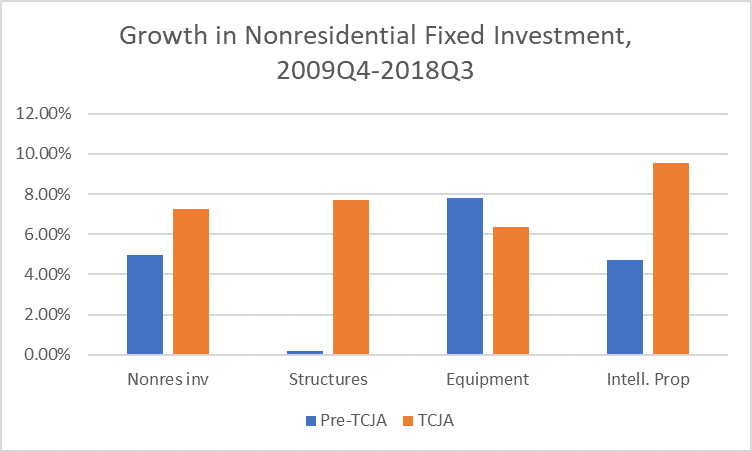
Figure 2: Chinn’s reinterpretation of ERP, 2019 Figure 1-6. Trend growth rates calculated using log differences. Nonresidential investment based on reported aggregates. Equipment investment calculations uses data up to 2017Q3 for the pre-TCJA period. Source: BEA 2018Q3 final release, and author’s calculations.
Alternative data? I hear there is precedent for that.
Oh – Kelly Anne Conway wrote Chapter 1 of the ERP!
According to FRED, Gross Private Domestic Investment was dead flat between 1Q2015 and 3Q2016, and since then has been rising at the same rate regardless of TCJA.
https://fred.stlouisfed.org/series/GPDI
The rate of GPDI should have increased, but did not. TCJA was poorly designed vis-a-vis investment. As Keynes points out, increased investment is a function of increasing demand.
Menzie? You did not get the memo? THE job of everyone who works for this White House is to lie. That’s your job if you are the Attorney General summarizing the Mueller report. That was Kevin DOW 36000 Hassett’s job.
Professor Chinn,
Are you using dlog(equipment) to derive a constant of 0.019559 in order to derive the pre TCJA annualized percent increase of 7.8% by multiplying 4*100*0.019559? If so, I seem to get the same results as you present. If not, maybe you could give some guidance. Using a regression of log(equipment) and trend, I find a constant of 6.161223 and a trend of 0.015909. Taking (exp(0.015909)-1)*4*100=6.4% for the pre TCJA trend annualized trend rate.
FRED chart for Real Private Nonresidential Fixed Investment
https://fred.stlouisfed.org/graph/?id=PNFIC1
For 2009Q3 to 2017QIV, I get a 5.1% average annual growth rate but Hassett types 1.5%?
I guess Kevin was asked to transpose the 5 and the 1! But any idiot could look at the FRED graph and get that Kevin got this terribly wrong. Was he lying or just relying on Kudlow to do the arithmetic?
“I sue a stochastic trend”.
Did you mean use? Or maybe you are worried the AG Barr will sue you for telling the truth here?!
“Deciphering Figure 6-1”? Actually it is figure 1-6.
When I went to the ERP, I was dumb enough to look for figure 6-1 and then realized I was in the wrong chapter!
My mistake! Fixed now.
Labeling the figure 6.1 instead of 1.6 is not nearly as bad as claiming 1.5% growth pre-TCJA when the actual number was 5.1%!
Someone with the time should fact check this entire chapter.
I don’t understand how they arrived at a negative 2.2% value. The 6.6% actual is clear enough; 1275.6 / 1197.1 = 1.0656, or ~6.6% growth over 2017:Q3. So presumably the CEA found some time series model that predicted a counterfactual equipment investment level of 1247.5, which is ~2.2% less than the actual of 1275.6. Using the base period 2009:Q3 thru 2017:Q3, using untransformed levels, the best model is ARIMA(1,1,0) with constant. This specification has the lowest Bayesian Information Criterion, significant at conventional levels, no evidence of autocorrelation, normally distributed residuals and no ARCH effects. The dynamic forecast for 2018:Q3 is 1271.0, which is a 6.2% growth, or only 0.4 percentage points less than actual. And the 6.2% growth is well within the 95% interval. I could not find any plausible ARIMA model that would predict 2018:Q3 equipment investment of 1247.5, which is what you’d need in order to come up with a negative 2.2% growth. Note: using an ARIMA(0,1,0) with constant (effectively a random walk with drift) gives a dynamic 2018:Q3 forecast of 1266.1 for a 5.8% growth; i.e., still not negative. And an ARIMA(1,1,1) with constant gives a dynamic forecast of 1276.8 (even higher than the TCJA actual!), although the diagnostics are not as good. So it sounds like the CEA really had to do a lot of work to come up with a negative 2.2% number.
The ERP says that they assumed businesses accelerated equipment investment in anticipation of the full expensing provision being included in the TJCA. This doesn’t pass the smell test. For one thing, that provision wasn’t even introduced into the TJCA bill until mid-November 2017 and didn’t actually become law until late December 2017. Would businesses really want to commit themselves that early to a provision that was far from a sure thing? Also, the GDP data reflects the completed production of equipment and not orders placed for future delivery of equipment. If there was a spike in 2017:Q4 equipment production, then it seems likely that businesses committed themselves to ordering that equipment long before 2017:Q4 and long before the TJCA was a living bill. My recollection is that up until very late 2017 businesses had more or less given up any hope of seeing a tax cut for business equipment expensing.
I don’t understand how they got that 1.5% for overall real business fixed investment. It should be 5.1% as I note here:
http://econospeak.blogspot.com/2019/06/a-very-erroneous-chart-in-economic.html
Is Hassett lying here? Or did he outsource chapter 1 to Lawrence Kudlow and Kelly Anne Conway?
This is the Economic Report of the President for God’s sake. Such blatant dishonesty does not belong here.
So maybe academia isn’t the only institution with a replication credibility crisis???
I suspect this goes way beyond replication issues. Yes – I’m going there. The authors of this report were instructed to misrepresent the data. After all – anyone who is familiar with the data would know this figure was grossly misleading. Yet they published it anyway.
Um no. They are not misrepersenting anything. They are spouting falsehood.
oops..
the 6.2% growth is well within the 95% interval.
Meant to say the actual 6.6% growth is well within the 95% interval of the ARIMA forecast.
Read the footnote, when someone makes comparisons using different time periods to calculate the different values
I automatically conclude the results are meaningless.
Hassett usually goes on some kind of “speaking tour” yes?? I mean do the usual TV network interviews to sell these CEA numbers. My question is, are any of them going to try to pin him down on live TV how he got the number and/or send a media outlet the most minute details of the math so they can see how he got the -2.2% number?? Or is Hassett going to be lobbed the usual softballs with no follow-up questions?? I know PBS NewHour has interviewed Hassett before. Are they going to fall asleep at the switch next time they interview this poser?? “Paging Judy Woodruff!!!! Paging Judy Woodruff!!!!” Judy, get Hassett on and please prove to us you’re not entering Nancy Pelosi back roads here.
(potential paywall after the jump) https://www.nytimes.com/2019/02/27/business/media/reporters-banned-trump-hanoi.html
https://www.reuters.com/article/us-northkorea-usa-reporters/white-house-bars-four-reporters-from-trump-kim-dinner-idUSKCN1QG2BZ
I thought Putin was the guy donald trump liked to have secret meetings with?? Is Hassett now barred from the media on explaining his numbers?? Even NASA has to explain their numbers sometimes, yes??
“are any of them going to try to pin him down on live TV how he got the number and/or send a media outlet the most minute details of the math so they can see how he got the -2.2% number??”
Of course they will not. I doubt most of these reporters even get this stuff. And a lot of them think Hassett is a nice guy because he is always smiling. The possibility that he might be lying to them is beyond their comprehension – alas. Which is why I get my economic news from economic blogs and not cable TV.
Any theories yet on who replaces Hassett?? I presume there will be some good names throw their name in the hat just so they can put it in their Linkedin CV.
We should head down to Barnes and Noble to see who has written the latest book on how TrumpEconomics will produce miracles!
Is it possible CEA “mistakenly” used a shorter time span sample for pre-TCJA growth rate “by accident”. Say instead of going all the way back to 2009 they only went back to a more recent date for the growth rate computation?? That would make the shift in equipment expensing “more dramatic” yes?? I lift this verbatim from Hassett’s rose garden fertilizer, page 45.
“This created a strong financial incentive for companies to shift their equipment investment to the fourth quarter of 2017, so as to deduct new equipment investment at the old 35 percent statutory corporate income tax rate. After the initial spike in the rate of growth in fixed investment, standard neoclassical growth models would predict a return of the rate of growth to its pre-TCJA trend, but from a higher, post-TCJA level, with the capital-to-output ratio thereby asymptotically approaching its new, higher steady-state level.”
Our host’s first thought (they are using net investment growth rates) seems like a plausible explanation. I know KH ignored research on the effects of the corporate income tax rate on investment when he opined on the effects of the TCJA, but these apparent errors in fact would show a level of incompetence that I find hard to believe of any CEA group, just as I would have been surprised to learn that Mnuchin’s one page analysis of the TCJA came from the Office of Tax Analysis in Treasury (it didn’t). Can our host (or anyone else) get clarification from the CEA? I’ve heard of Presidents who dismissed the CES’s “Economic Report of the President,” but never incompetence in the Report of the type apparently shown here.
don: I don’t know many people in the current administration, let alone CEA. I have added what I think is the answer as an update.
“I will say that the notes to this figure are not the most transparent; indeed, one might say they are misleading, given that the vertical axis is actually denoting two different variables even though the text suggests the same variable over two periods is being plotted.”
Klever Kevin! Sort of like Bob and Weave Barr!
Things in the EPR not highlighted by the CEA.
(1) Table B-20 (page 660). Notice that median income for non-whites (viz., Blacks, Asians & Hispanics) declined for 2017; however, it increased for one demographic group (viz., White non-Hispanic).
(2) Table B-21 (page 661). Real farm income fell 14% in 2018 even though government subsidies to farm income increased 15.3%.
(3) Table B-25 (page 666) Prime age (viz. 25-54) labor force participation rates for both males and females are slightly lower in 2017 and 2018 than they were during the first two years under Obama (i.e., during the depths of the Great Recession). This is “prime age” so the aging workforce narrative shouldn’t apply here.
well it is either a conspiracy or a stuff up. given the expertise in this administration I would go for the latter
Well…….. this is “shocking”. This is the same woman who believes the 737 Max 8 is the greatest invention since chopsticks??
https://www.youtube.com/watch?v=CF1bjPuU5gM
Well, maybe Elaine Chao can use some cutting-edge gunpowder from the mainland to blow-up this naughty boy Eric Lipton. Doesn’t Lipton know hard facts are “so 2015”?? Disgusting…….. This must be what donald trump calls a “witch hunt”?? Or is it a “b*tch hunt”??? Oh, I’m getting sooooo “confused” again…….. Maybe we can use Mitch McConnell as an arbitration judge and he can tell us what an American patriot Chao is??
At least donald trump isn’t allowing foreign influence into the White House cabinet. So I feel relieved about that.
Reading a crimped up late February 2019 NYT hardcopy…..
“Kim Won’t Give Up Weapons, Says North Korean Defector” WHAT!?!?!?!?!?! But our “president” Orange Excrement says Kim is going to cough up all his nuclear weapons by midnight tonight…….. Oh man, I been skipping too many Stephen Moore and George Papadopoulos co-authored foreign affairs commentaries again and now have lost my insight into the North Korean pulse:
(possible paywall) https://www.nytimes.com/2019/02/27/world/asia/north-korea-kim-jong-un-defector.html
To think of all the brilliant foreign affairs stratagems this country could have made since donald trump’s great international relations “expert” George Papadopoulos got carted off to federal prison. All the “missed opportunities”. Gone forever……..
My father always loved horses. Seem to remember him specifically mentioning Belgians a few times. I imagine he would have liked this story. I think I know how this guy feels, knowing a certain very enjoyable segment of your life is ending and not a damned thing you can do about it. Oh well, he can still visit his horse on the outskirts of the city. Not like it’s across an ocean or something.
https://www.nytimes.com/2019/02/28/nyregion/central-park-mounted-cop-retires.html
BTW, I had the NYT writer edit out all references to horse shit made earlier in this story, in hopes of not upsetting commenter JBH
@ Menzie
Guess who is doing a paper on Tariff Passthrough and tariff incidence??? Although I am sorry to say, she seems to say nothing about the cost of professorial looking suits. I will hunt around on VOX sometime in the next few weeks (or other less economics based websites) and see if I can finding anything more informative for you there. I know at one time Hong Kong was a great place to get world-class suits on the cheap—but those magical days were gone decades ago.
https://www.theguardian.com/business/live/2019/jun/05/us-interest-rate-cut-expectations-markets-services-sector-uk-eurozone-business-live?page=with:block-5cf770728f0853193b201a42#block-5cf770728f0853193b201a42
“The US Federal Reserve’s dual mandate is to keep American inflation steady and unemployment as low as possible.
But… it often feels like there’s a third mandate – keep the stock markets up.”
Now that I understand the data that the chart presents, I’m a little astonished at how dishonest the chart is. What it appears to do is take the trajectory of investment growth pre-Trump, punishing the data for showing that growth was higher early in the recovery and tapering over time. It then ignores the same curve shape and plots strictly arithmetic growth post-Trump. I would be interested in seeing the shape of the same curve, post-Trump. My expectation is that there would be continued tapering, especially in light of reports I have read that say the touted surge in investment didn’t happen.
“I’m a little astonished at how dishonest the chart is.”
It is incredibly dishonest but should we be astonished that Team Trump lies about everything all the time? He’s been doing this all his life.
Ever curious what a supreme donkey jackA$$ looks like?? Pay close attention to the photos in the link:
https://www.marketwatch.com/story/summers-goes-from-mocking-to-joining-kudlows-half-point-rate-cut-in-two-months-2019-06-05?mod=mw_theo_homepage
2 months. Just 2 months. What underlying facts have changed in 60 days folks?? These are the things you do when you have LITERALLY fallen in love with the sound of your own voice. Which is one thing donald trump and Larry Summers have in common.
“It might be that CEA is using net rather than gross investment”.
Well no!
http://www.bea.gov reports real net investment on an annual basis not a quarterly basis.
https://apps.bea.gov/iTable/iTable.cfm?reqid=19&step=2#reqid=19&step=2&isuri=1&1921=survey
Table 5.2.6. Real Gross and Net Domestic Investment by Major Type, Chained dollars
[Billions of chained (2012) dollars]
Net nonresidential investment is reported in line 12. In 2010, this figure was $174.2 billion. In 2017, it was $494.2 billion. We are talking an annual growth rate much greater than 1.5%.
Net equipment is reported in line 18. In 2010, this figure was $ 68.8 billion. In 2017, it was $252.3 billion.
Hassett reported negative growth. This reporting is wrong whether one uses gross or net figures.
pgl: See addendum to post for an explanation of what is going on in figure 1-6.
donald trump wins again!!!!! Can’t you weak losers get that??
https://youtu.be/FlAMKyDJAjM?t=31
“The blue bar is the year-by-year decline in the trend growth rate in investment — not the corresponding average annual growth rate over the pre-TCJA period.”
So we have an apples to oranges comparison presented as if it were apples to apples.
“I will say that the notes to this figure are not the most transparent; indeed, one might say they are misleading, given that the vertical axis is actually denoting two different variables even though the text suggests the same variable over two periods is being plotted.”
Precisely. This figure was designed to mislead.
“The blue bar is the year-by-year decline in the trend growth rate in investment — not the corresponding average annual growth rate over the pre-TCJA period.”
OK but that is not how it is labeled:
“pre-TCJA trend growth” is not the same thing as the change in the trend growth rate.
There is no way to sugar coat this – Hassett knew he would mislead the readers of the ERP. But when one works for Trump – that is the job.
Yes, it would seem that while maybe not outright inaccurate it is seriously misleading. Putting figures right on top of each other invites comparing them, but it looks if you are right, Menxzie, that they are not cmparable. Definitely misleading in a way to fake news sell a point.
For those denouncing Powell and Summers for now supporting a possible fed funds rate cut (with Janet Yellen reportedly having done so recently as well), this is about uninverting the now inverted yield curve, which if one believes past experience, is forecasting a possible/likely recession, with indeed the ongoing decline in long-term rates that has brought about the inversion being due according to many to an expectation the Fed will cut short tern rates. So while clearly Powell’s talk has puffed the stock market in the face of possible ridiculous Mexican tariffs, it is in fact aimed also at avoiding that possible recession, and inflation certainly is not high enough to warrant not dong it.
As it is, I think I would prefer to see them hold off until we see actual noticeable declines in growth rates or worsening of the labor market, the former fairly likely soon, if not the latter. I supported them raising the rates to provide a tool to fight a recession, not to forestall inflation, which was their official justification for doing so.
Menzie I think the way this is number is calculated is by estimating a quadratic trend,
But this effectively means the CEA is assuming investment follows a deterministic trend stationary path. That’s kind of assumption is controversial enough that it should have been stated explicitly rather than left up to reader to tease out and reverse engineer a chart.
2slugbaits: Could be, or CEA estimated growth rate as a function of linear trend, so then growth is trend stationary…