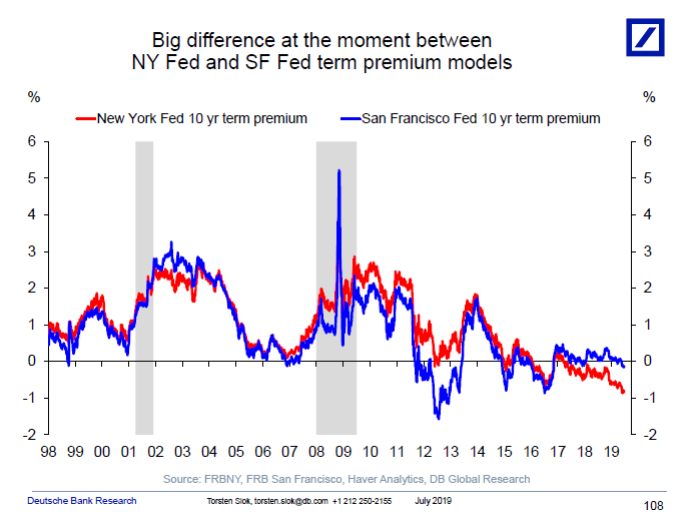
Torsten Sløk at Deutsche Bank had an interesting commentary [not online] this morning, noting the disjuncture between the different estimates of estimated term premia from affine (no arbitrage) models of the term structure emanating from the NY and SF Feds. I adjust the term spread by the term premium from SF and show the implied probability of recession, alongside that from the conventional 10yr-3mo.
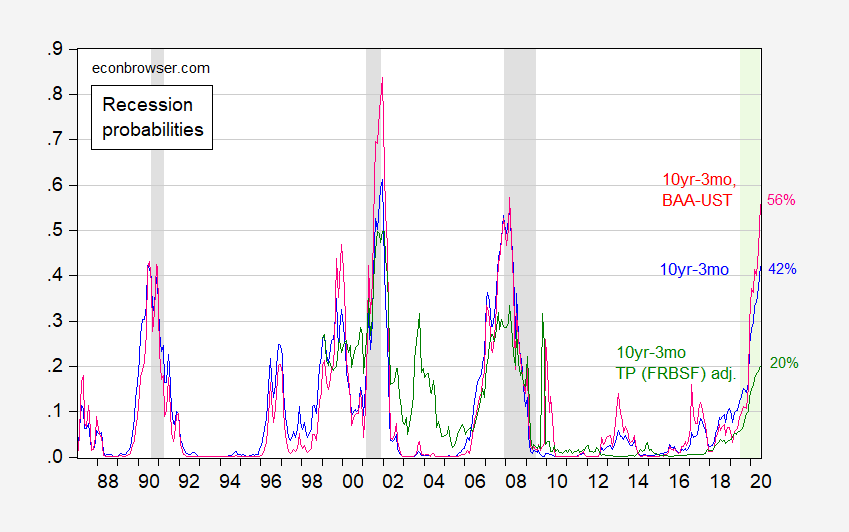
Figure 1: Implied recession probability from probit regression on 10yr-3mo term spread (blue), and same augmented with BAA-UST spread (red), both estimated over 1986M01-2019M06, and 10yr-3mo term premium adjusted spread (green), estimated over 1998M01-2019M06. 3 month Treasury is secondary market yield. NBER defined recession dates shaded gray. Source: Federal Reserve via FRED, SF Fed, NBER, and author’s calculations.
Note that while the estimated probability of recession is lower for the term premium adjusted model (20%), in the last recession, a 30% probability was recorded. On the other hand, a 30% probability was indicated in 2003 without any recession occurring (so a “false positive” using a 30% threshold). If you are wondering what the NY Fed term premium-adjusted term spread, it indicates a single digit probability of a recession, and completely misses the previous two recessions.
On the other hand, the conventional 10yr-3mo and 10yr-3mo augmented with credit spread (blue, red, respectively) indicate much higher probabilities. However, the 10yr-3mo does not suggest a recession using the threshold exceeded last episode, while the 10yr-3mo credit spread augmented does…
Here is the graph from Torsten Slok which spurred this post:
“On the other hand, a 30% probability was indicated in 2003 without any recession occurring (so a “false positive” using a 30% threshold). ”
My fair 10 sided die has a 30% chance of rolling {0,1,2} of {0..9}, this does not mean it has a false positive threshold. Epic logic fail here. Its a probabilistic model, so a 30% chance means that of 10 outcomes, roughly 7 are successes (not a recession) and 3 are failures (recession). We cannot ex-post apply a “false positive threshold.”
You are assuming the probabilities are calibrated, in the sense of “30%” really means “30%” as opposed to uncalibrated, in the sense of “higher = a higher probability of recession, but the actual numeric value isn’t accurate.” In order for the former to be true, a lot of assumptions underlying the models have to hold, but the requirements for the latter are much weaker. I read these as uncalibrated numbers.
If by “uncalibrated” you mean that the confidence interval around these numbers is very wide, I am not assuming that. I simply decided not to go into whether or not we even have enough data (based on 3 recessions) to estimate a 30% probability. How many “draws” of monetary policy cycles do we have between 1988-present? I define a monetary policy cycle as tightening/easing/neutral). Ultimately we have 3 data points, so no matter how fancy the model we don’t have a lot of data. We can draw up a fancy model to “prove” “this time is different” using the term premium. But “this time is different” is the same thing I heard before the 2001 and 2007 recessions. An extraordinary forecast requires extraordinary evidence, evidence we simply dont have.
Ultimately, a recession will be determined by monetary policy. The Fed has been undershooting its 2% target for a decade. One thing that will be different: If the Fed screws up and causes a recession, Powell will be fired for cause. And Trump will install a political hack like Moore or Cain.
As someone born in Ithaca, NY, whom the internet for awhile claimed was born in Ithaca, Greece, just why are you calling yourself this name that is very close to “Ithace”?
Well, looks like the mid-range estimated probability is 42 percent, what Menzie has previously put up, although now we have bounds of 30 and 56 percent for that mid-range forecast.
The thing that is most interesting to me about this post is the SFRB which I think would be apt to be bent to more “liberal”membership—their term premium model is saying there’s lower chance of recession and NYFRB, which I would guess is apt to have more conservative members (or at the least those more inclined to market cheerleading) has a term premium model indicating higher chance of recession.
Well, all the people like Jerome Powell focused on careerism will be figuring out how to change all these term premiums into smiley faces soon, so all the cool kids like Steve Bannon, Newt Skankrich, and David Brooks don’t start making fun of them in the grade school cafeteria during lunch.
Moses Herzog: Recession risk using SF Fed term premium estimate is higher than that using NY Fed estimate. Apologies if I wrote it in a confusing way.
I have not heard anybody I respect accuse Powell of careerism. He could’ve earned a lot more money staying in private sector.
You didn’t write it in any way confusing—extremely bad (and personally embarrassing) reading comprehension on my part. The Powell one is debatable. He’ll have his chance to show his metal up to November of next year. Pelosi has in essence proved me correct on herself—I will give you Powell is still debatable—but I’m not hopeful on him.
Now that I’ve completely embarrassed myself showing that I apparently cannot read a simple graph with two lines on it (I wish that was sarcasm, but that is more like painfully laser accurate self-deprecating humor), I would like to make a half-attempt to redeem my CoRev level error in reading graphs.
When we look at this yield curve inversion stuff in the last roughly year, my mind keeps returning again and again and again to Lael Brainard’s very perceptive, keen, and prescient comments in a public speech she made. She is a very highly intelligent woman, and I believe these are quite conceivably the best comments that have been made on the yield curve (with the possible exceptions of Menzie’s general observations over that same time period) in the entire last year.
“As we try to assess the implications of this flattening of the yield curve, it is important to take into account the very low level of the current 10-year yield by historical standards. For the 20 years before the crisis, the 10-year Treasury yield averaged about 6‑1/4 percent, compared with recent readings around 3 percent. One reason the 10-year Treasury yield may be unusually low is that market expectations of interest rates in the longer run may be unusually low. A second reason may be that the term premium–the extra compensation an investor would demand for investing in a 10-year bond rather than rolling over a shorter-dated instrument repeatedly over a 10-year period–has fallen to levels that are very low by historical standards. According to one estimate from Federal Reserve Board staff, the term premium has tended to be slightly negative in recent years. By contrast, when the spread between the 10-year and 3-month Treasury yields was at its peak in early 2010, this measure of the term premium was close to 100 basis points.
Other things being equal, a smaller term premium will make the yield curve flatter by lowering the long end of the curve. With the term premium today very low by historical standards, this may temper somewhat the conclusions that we can draw from a pattern that we have seen historically in periods with a higher term premium. With a very low term premium, any given amount of monetary policy tightening will lead to an inversion sooner so that even a modest tightening that might not have led to an inversion in the past could do so today. ”
May I semi-humbly suggest, that when looking at the yield curve inversion (in the current 2019 context), and trying to draw any conclusion from the confounded mystery of inversion—people keep Brainard’s comments somewhere in their mind.
https://www.federalreserve.gov/newsevents/speech/brainard20180531a.htm
I’d point out that ECRI called a recession for the mid-2011 period, and Europe faced a brutal recession from mid-2011 at mid-2013. We have referred to this as a crypto recession in the US, with the difference between the US and Europe coming down to rapidly increasing oil production in the former and a need to cram down oil consumption in the latter. So that’s not a false positive in 2011-2013 as I see it.
The downturn from late 2014 coincides with the collapse of oil prices; the downturn in 2016 coincides with a collapse in oil prices; and the downturn in 2018 coincides with a collapse in oil prices — all three linked to over-production and a subsequent retrenchment in drilling and completion in the US, which is continuing today from its start in late November.
From Moses’ comment:
“As we try to assess the implications of this flattening of the yield curve, it is important to take into account the very low level of the current 10-year yield by historical standards. For the 20 years before the crisis, the 10-year Treasury yield averaged about 6‑1/4 percent, compared with recent readings around 3 percent. One reason the 10-year Treasury yield may be unusually low is that market expectations of interest rates in the longer run may be unusually low. ”
So the question is why interest rates in the longer run may be unusually low. If you think it’s just random, then it’s a kind of glitch…but how to handle it conceptually? On the other hand, if you think it’s driven by demographics — and I do — then you had better get a handle on just what those demographics means, ie, net v gross assets (in particular, human health) and the potential returns from either replacement assets or a fixed stock of assets for which demand is falling every day, as in the case of Japan.
Kopits: 2011 Severe eurocrisis caused collapse in oil. 2014-5 End of QE caused collapse in oil. 2018 Burst stock market bubble caused sympathetic collapse in price of oil. Of these three, only the second warrants being called over-production.
On this regime of low interest rates. Forget demographics. Record level debt around the globe is by far the predominant force pressing down on economies and hence on interest rates. If you will put in the hard work to understand this, you will find that much else falls in place too. So important is debt at this historic juncture, that if economics were hieroglyphics debt would be the Rosetta Stone.
JBH: Huh? Debt overload — too much debt — is causing interest rates to be low? How does that work?
Menzie: Reinhart Rogoff found that financial crises devastated growth for as long as a decade ahead. Given the Keynesian propensity to throw fiscal stimulus at sub-par growth, it’s inevitable that the debt ratio notches even higher in the wake of credit crunches and financial crises, atop the debt that had already built during the bubbles that precipitated those crises. The debt then acts as an albatross around the necks of debtors, repayment of interest and principal extracting purchasing power from the circular flow spending stream. This of course holds growth down. Central bankers, instead of doing the job of providing sound money, then hold short rates down in an attempt to stimulate their way out of the sluggish growth trap that’s developed.
Historical data from more than a couple decades ago will not show this effect as more recent data does. That’s because never before in the history of the world has there been a record level debt burden like today. The largest economy in the world – that of the EU – is sick. It’s never recovered from the 2008 catastrophe. From 2010 to 2018, real growth in the EU came in at a lowly 1.4%. This pressed ECB policymakers to take their official rate negative, bringing the entire yield curve down. Were the Southern periphery countries not so heavily indebted, interest rates would never have gotten so low. Debt enters here causally again. Arbitrage between the debt of European sovereigns and US Treasury debt is a powerful force. The 10-year Bund and 10-year Treasury yields have lengthy periods of near perfect correlation, with the relatively high yields in the US tugged down by funds flowing out of Europe wanting to take advantage of higher yields here.
Naturally enough I have a small reduced-form annual model of US real GDP growth. I developed it years ago as a forecasting model. In the wake of studying Reinhart Rogoff and Hyman Minsky, sometime after the crisis I entered the overall debt-to-GDP ratio into this old model. It made an organic change. Currently, the model is estimated from 1986 on. I date what I call the era of debt from 1985. I judge that debt was optimal around 1985. The coefficient on the debt variable in this model is astonishingly robust through many different model specifications, and through numerous observation sets. Already by the quarter before the last recession, growth was being suppressed by debt to the tune of nearly a percentage point. Today, because the debt ratio is higher, I find that growth is suppressed around 1 3/4ths percentage points by debt. This is why I’ve often remarked that excessive debt is the economy’s number one problem. Coming to this understanding was how I was able to say 2%, 2%, 2% in real time from around 2012 on. As it turns out, Obama era growth was exactly 1.9%. From very early on, debt is what helped me understand that growth was going to remain low like that.
As for exactly why debt suppresses growth, that is harder to grasp than doing the data work. I’ve given some indication above why I believe this happens. This is a state of the art learning process. I’m on the frontier with no mentors to lead the way. There is much I don’t understand, but I believe I do have the question right. Which is always the first step.
Lacy Hunt with Hoisington is on top of this. Former member of the shadow open market committee. He has a theorem that debt accelerations ultimately lead to lower not higher interest rates. Some of this has to do with the fact that increments of new credit at these higher levels of debt have a diminishing returns effect on growth. In my view, another element is that debt is roughly the flip of savings. And a lower saving rate adversely affects investment, hence depressing real growth, leading the Fed to engage in ZIRP-type policies, ergo low rates. This should be enough to give you the flavor of what you ask about.
Oh dear, JBH, it looks like I must reply to your effort and announcement you have a model you have not specified. Given that, obviously my reply is limited. So, a few comments, mostly repeats of things I have said previously here.
It is well known that in a simple bivariate correlation debt/GDP and GDP are negatively correlated. Of course there is a well known trivial aspect of this. GDP is on both sides of that equation, so when GDP grows slowly or goes down, the debt/GDP ratio rises. So we do not know your specification, but this alone is a reason for the relation to hold. I have already here noted that among the high debt/GDP nations there are cases where there is no problem for a lot of reasons I doubt your model does not deal with, such as the interest burden and the level of foreign liability. So, Japan has a very high debt/GDP ratio, but no problem, while Grreece also does, although about half Japan’s (US is about a third of Japan’s), and it has a lot of problems. Heck, I have seen media discussion of certain poorer developing nations where those discussing them have said they were in serious indebtedness problems with something like a 30-40% debt/GDP ratio. Of course such nations are the opposite of Japan; they are paying extremely high interest payments to foreigners who own their debt. Those are the nations that end up in sovereign default situations, which really trash their growth.
Thank you for identifying your “optimal debt,” 1985, the year before your model starts, just after Ronald Reagan massively increased the US national debt after having trashed Carter for much lower deficits than he ran, which is of course how the debt rises, just as Trump’s unprecedented level of a deficit in a high employment economy is seriously increasing the US national debt. You have been pushing idiot Trump lines. As an opponent of increasing national debt, are you ready to recognize that Trump’s massively unpopular tax law is massively increasing the US national debt?
On the matter of the relation between debt and growth, please do not pretend that you are the first person ever to attempted to study this matter. As it is this has been studied, and while there are lots of dissenters from MMT to New Monetary Economics to Cambridge capital theorists (none of which I suspect you know zip about), Your admitted difficulty in finding a relation between debt and GDP growth is not surprising as basically all of massive past studies suggests that to the extent there is such a relation, it is weak. The strongest argument is a psychological self-fulfilling one. So, if people like you take control of public consciousness so that business people thinking about investing in real growth hold back because they are worried by a high debt/GDP ratio, then growth will slow.
Just to repeat the more widely accepted links, the annual change of the debt is the budget deficit (assuming we are talking about the public debt) and while a budget deficit usually tends to stimulate growth because of tax cuts and more spending, large deficits can also lead to “crowding out” if govt borrowing competes with private borrowing, thus tending to push interest rates up, a major reason for Menzie’s skpepticism regarding your weird argument drawing on the wacko Lacy Hunt that more debt leads to lower interest rates.
I think the jury is still out on Japan. The economy will be no bigger in 2050 than it is today, and the country already has a 200% debt-to-GDP ratio. So if things go bad, they could go bad in Japan in a hurry and in a big way. I personally think that Japan goes down in the same financial crisis that ends the Communist Party’s dominance in China, cc 2025, or not longer after US shales lose their resilience. (I don’t know if any of you are paying attention, but Beijing is losing in Hong Kong right now, big time. If that kind of sentiment spreads to the mainland — and it will in the next financial crisis — we’ll come to see that there is nothing special about China other than its size. It will become a democracy — a weak democracy, but a democracy nevertheless — just as did Japan, Korea, Taiwan, Thailand (sort of), and Indonesia. Mainland Chinese are not a lesser people than anyone else in Asia — indeed, they are arguably in the top tier, culturally speaking. Sooner or later, as long as the Chinese economy continues to grow, prosperity will push China towards democratic accountability as evidenced by more or less free elections.)
BTW, for whatever it’s worth, a lot of these investment banks have their own podcasts, and Deutsche’s has Torsten Slok speaking extemporaneously on a lot of topics. Is it as good as some banks’ proprietary client newsletters?? NO, obviously the content is not going to be as good as those they offer paying clients–but it’s still educational and worth a listen from time to time. GS’s and Deutsche’s I’m sure are good quality, along with most of the major investment banking names you would think of.
Bloomberg Surveillance is another free podcast, and the content there is usually pretty good as well, when they aren’t trying to brush Tom Keene aside with the latest blonde dingbat.