Still rising, so likely no recession as of June 2019.
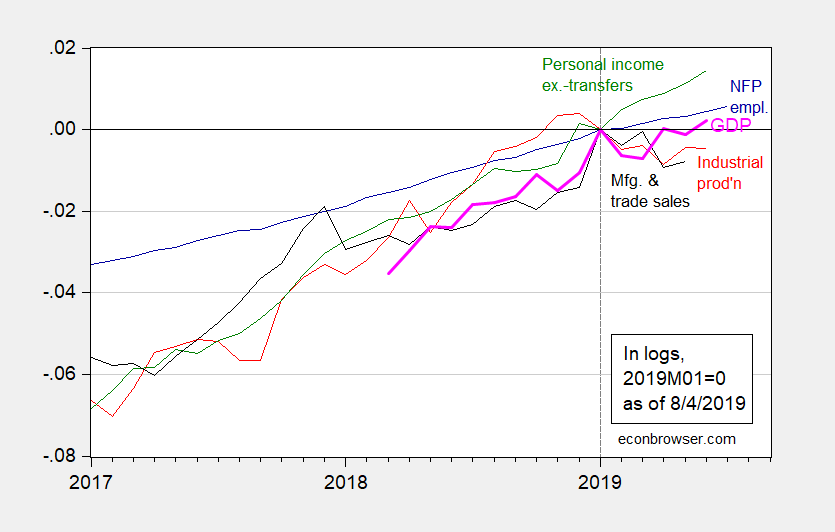
Figure 1: Nonfarm payroll employment (blue), industrial production (red), personal income excluding transfers in Ch.2012$ (green), manufacturing and trade sales in Ch.2012$ (black), and monthly GDP in Ch.2012$ (pink bold), all log normalized to 2019M01=0. Source: BLS, Federal Reserve, BEA, via FRED, Macroeconomic Advisers (7/25 release), and author’s calculations.
On the other hand, we need to think about how much punishment the manufacturing sector can take without spillover to the rest of the economy. Employment is resilient, but hours and production indices have dropped, with little evidence of recovery in the former.
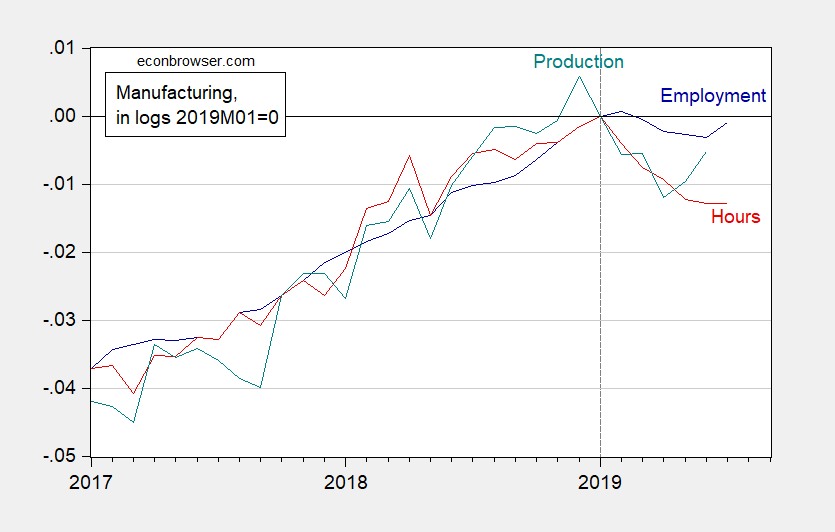
Figure 2: Manufacturing employment (blue), aggregate hours of production and nonsupervisory workers (red) and production (teal), in logs 2019M01=0. Source: BLS, Federal Reserve via FRED, and author’s calculations.
When one considers the backdrop to world wide trade, and the tradables sector, it’s pretty worrisome. We have slowing world trade growth, we have an incipient currency war between the US and China, and the possibility of a major conflict in a US Section 232 action on automobiles, centered on Europe. And with no clear end-date to the resolution of these issues, we can assume trade policy (and economic) uncertainty will continue to hover over every decision.
“When one considers the backdrop to world wide trade, and the tradables sector, it’s pretty worrisome. We have slowing world trade growth, we have an incipient currency war between the US and China, and the possibility of a major conflict in a US Section 232 action on automobiles, centered on Europe.”
I would concur but Bruce “no relationship to Robert” Hall assures us that exports are such a tiny part of overall GDP that troubles in the tradables sector is nothing to worry about. Maybe his real name is Pollyanna Hall!
Does it mean I am a sick/sadistic person if I say I’m incredibly humored and entertained by China’s currency deprecation?? Please, if you hate me and have always dreamed of letting me have it on this blog, don’t hold back.
https://www.youtube.com/watch?v=-oUJdF-BDrQ
whoever, I would concur but Bruce “no relationship to Robert” Hall assures us that exports are such a tiny part of overall GDP…. Dyslexia much?
“whoever, 12.2% might be considered important, but not driving the economy. Consumer spending was six times that. Perhaps our perspectives are different.”
I’m really living in your head now, eh? You’re beginning to sound a lot like CNN when Trump says he wants to stop illegal immigration, they can only hear immigration. That’s called “selective hearing”. In your case, it’s called “selective perception”.
Now that the clarification is out of the way, I’ll agree with your assessment that the trade issues are “worrisome”. However, not all U.S. exports go to China. These are the top 10 categories:
The following export product groups represent the highest dollar value in American global shipments during 2018. Also shown is the percentage share each export category represents in terms of overall exports from the United States.
Machinery including computers: US$213.1 billion (12.8% of total exports)
Mineral fuels including oil: $189.9 billion (11.4%)
Electrical machinery, equipment: $176.1 billion (10.6%)
Aircraft, spacecraft: $139.1 billion (8.4%)
Vehicles: $130.6 billion (7.8%)
Optical, technical, medical apparatus: $89.6 billion (5.4%)
Plastics, plastic articles: $66.5 billion (4%)
Gems, precious metals: $63.8 billion (3.8%)
Pharmaceuticals: $48.4 billion (2.9%)
Organic chemicals: $40.2 billion (2.4%)
America’s top 10 exports accounted for over two-thirds (69.5%) of the overall value of its global shipments. Soybeans not in the top 10.
http://www.worldstopexports.com/united-states-top-10-exports/
These are the top trading partners.
Canada: US$299.8 billion (18% of total US exports)
Mexico: $265.4 billion (15.9%)
China: $120.1 billion (7.2%)
Japan: $75.2 billion (4.5%)
United Kingdom: $66.3 billion (4%)
Germany: $57.8 billion (3.5%)
South Korea: $56.5 billion (3.4%)
Netherlands: $48.7 billion (2.9%)
Brazil: $39.6 billion (2.4%)
France: $37.7 billion (2.3%)
Hong Kong: $37.3 billion (2.2%)
India: $33.5 billion (2%)
Singapore: $32.7 billion (2%)
Belgium: $31.4 billion (1.9%)
Taiwan: $30.6 billion (1.8%)
So exports to China represents 7.2% of 12.2% of GDP (not quite 0.9%… okay, I’ll be generous and round it to 1%). Significant, but not paramount.
http://www.worldstopexports.com/americas-top-import-partners/
@ Bruce Hall
I think the, uuuuh, “better half” (or is it better “one quarter”??) of commenters here have already figured out you’re a little dumb. But let’s just assume for the moment you’re not as dumb as we think—you DO know that when a bilateral trading partner’s currency gets devalued it effects more than just soybeans, right?? You DO know that much??
“a little dumb”. Brucie does act like a little boy and he sure is dumb!
“I’m really living in your head now, eh?”
That is a CoRev line. I guess you are his minnie me. You refuse to admit that you made an incredibly stupid statement when you claimed exports were not an important factor for the U.S. economy. No – instead you write one long winded irrelevant rant after another. Sorry CoRev’s minnie me but NO ONE is going to waste time reading your incessant whining and stupidity.
“I’ll agree with your assessment that the trade issues are “worrisome”. However, not all U.S. exports go to China.”
Oh wait Brucie boy does a complete flip flop with that first sentence. And I never said all of our exports went to China. Leave it to little Brucie boy to misrepresent what I said. He IS CoRev’s minnie me!
https://www.theguardian.com/business/blog/live/2019/aug/06/chinese-state-media-accuse-us-of-destroying-international-order-business-live?page=with:block-5d4938868f0896be8f8f41e0#block-5d4938868f0896be8f8f41e0
Using the same analytical lens, Chinese total exports around 18% of GDP, Chinese exports to US around 18% of total exports, so, 18% of 18% is, call it 3.5%.
Again, significant, but not paramount. Given the differential in the rates of US/Chinese economic growth (higher in China), and the different sensitivities of the two political systems to economic pressures from affected constituencies (higher in the US), I’d hazard that the amount of pain each country can cause the other is pretty comparable.
The real damage is in systemic spillover. And other stakeholders are already anticipating that–viz., central bank rate actions in India, New Zealand and Thailand. Taking systemic damage into account, the biggest stakeholder is likely to suffer the biggest damage, and given who that stakeholder is, I’m baffled by the Trump administration’s approach.
Market down 3% in a single day. MAGA !!!!!!!!
https://www.youtube.com/watch?v=ebanS7YL6V4
Jerome Powell, damn you’re a genius Bro. I take back everything I said about you being a complete suck-A$$, Jerome. I mean you ARE a complete suck-A$$, but I like you so much for what you did like 5 days ago which ended up in today’s action. You are AWESOME Jerome. jerome, I’m praying that Professor Hamilton makes an “event study” out of this week and sends you the results, and then you can put your initials on it “S. A.”.
Do it AGAIN Jerome!!!! Do it AGAIN!!!! Do it AGAIN!!!!
https://www.youtube.com/watch?v=rz5TGN7eUcM
“When one considers the backdrop to world wide trade, and the tradables sector, it’s pretty worrisome. We have slowing world trade growth, we have an incipient currency war between the US and China, …”
After today’s stock market collapse, this looks to be prophetic.
Looks like my timid prediction might be a little off. The choppiness in the economy means it is ready to go over the edge, or usually does. So here we go, sooner than I thought. Then again, I thought some of the asinine things Trump said would end his political career. Now, maybe he will get lucky again and his assinine policies, if you can call flailing around policies, won’t have consequences resulting in recession. But I doubt it.
https://www.youtube.com/watch?v=jGN6A5R8Ea8
https://www.youtube.com/watch?v=QjcDyYciyIg
I’m not sure if Menzie is taking a step back and re-evaluating (he would have that right, since conditions have somewhat changed in a pretty quick timespan). But I wanna say the drop in China’s currency exchange rate vis the USD (which I am not even sure meets the definition of “manipulation”, devaluation does not necessarily equate to “manipulation” here) only reaffirms my thoughts that the full tariffs will NOT be implemented on September 1 (or before that). And I feel very confident about that. Why?? The same reason I gave before. The orange creature’s survival instinct is very strong, and it is not going to slit its own throat on the late 2020 elections–which is what the full tariffs would do. We also know when donald trump is at his very weakest—-that is whenever his bluff actually gets called—which the Chinese government hierarchy has very wisely and astutely done here.
I would feel a little better to know Menzie is still standing near to the cliff edge with me on this September 1 prediction of non-implementation or non-enactment of the full tariffs on China. But I feel confident in that prediction either way.
should read above ” *via the USD “
Professor Chinn,
I keep trying to find some relationships related to recessions that are different from what has been presented in the financial press. If we divide new claims for unemployment (FRED series: ICSA) by the level of unemployed (FRED series: UNEMPLOY), I wondered if there could be some forecasting significance in the change of the ratio over time. I thought that perhaps the ratio may increase as we head toward recession, since folks may delay applying for unemployment insurance payments during relatively “good times”, thinking that the next job will be reasonably easy to find. Conversely, when times are starting to head toward a recession, unemployed folks may feel that the likelihood of finding a new job may be slim so it may be prudent to seek unemployment insurance payments.
Running a Probit model from 1981M01 to 2019M07 (463 included observations), the model shows a McFadden R-squared of 0.33. The resultant probability graph also looks pretty good, as far as the ratio being predictive of recession (perhaps a concurrent indicator). The ratio declined from about 2001m05, when the ratio stated in percentages was about 6.34%. The percentage bottomed at about 2013m09 at about 2.79%. The percentage has increased to about 3.5% as of 2019m07.
Interestingly, the probability graph does not forecast a current recession, which seems to agree with the interest rate inversion models that seem to be forecasting a recession perhaps next year. The recession probabilities do not score as high as the probabilities in interest rate inversion models, but do show dramatic upswings during three of the past four recessions. Disappointingly, the upswing is not as dramatic as one would hope to see for the Great Recession period.