The pre-benchmarked establishment survey suggests declining employment in key industrial states of Michigan, Pennsylvania and Wisconsin. Using the methodology I used to inferring the national establishment survey, can we anticipate the revision to manufacturing in these states?
First, here’s the establishment series (seasonally adjusted), and Quarterly Census of Employment and Wages (not seasonally adjusted).

I seasonally adjusted the QCEW series using Census X-12 over the 2010-2019M06 period, with log transform. The truncated sample is used because using the sample back to 2001 leads to substantial overprediction in the years 2015-16.
I then estimate a log-log specification 2010M01-2018M03 (when the last benchmark date is), and fit out to 2019M06 (last available QCEW data).
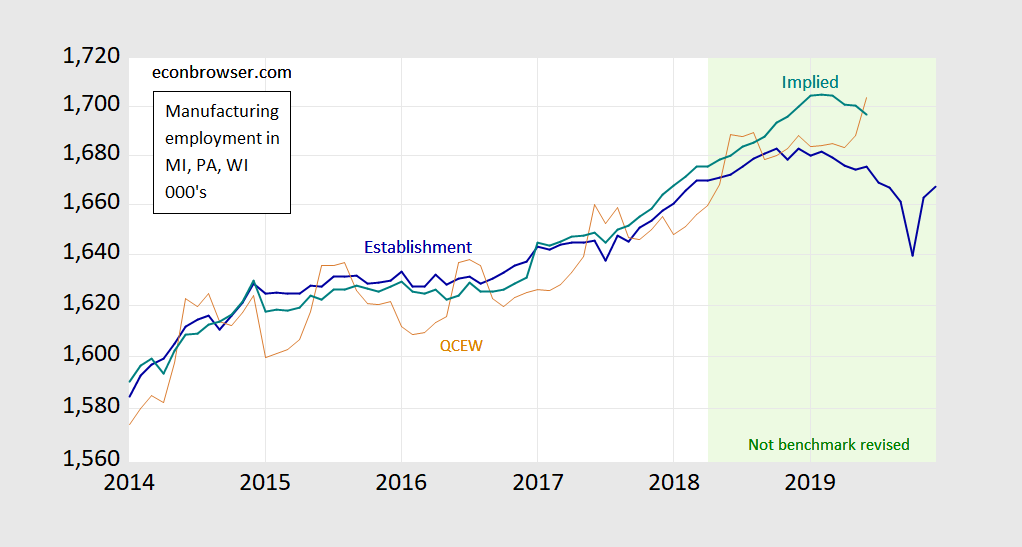
The implied level for 2019M06 is 21,600 more jobs, 1.3% higher than current BLS estimates. However, the trajectory since 2019M03 is downward, as it is for the pre-revision BLS series (downward since 2019M02).
Menzie Any theories as to why the manufacturing employment numbers look weak in MI, WI and PA but the state real GDP numbers for manufacturing look mildly positive for those three states?
https://fred.stlouisfed.org/series/WIMANRQGSP
https://fred.stlouisfed.org/series/MIMANRQGSP
https://fred.stlouisfed.org/series/PAMANRQGSP
I can’t give you as good as, as knowledgeable as, or as thorough answer to this (or many things) as Menzie can, however I can attempt a stab at the darkness in hopes it helps extinguish the mystery:
https://research.stlouisfed.org/publications/economic-synopses/2012/05/18/the-relationships-among-changes-in-gdp-employment-and-unemployment-this-time-its-different/
I think what this is really saying on a basic level is, there is often a time lag between two things, even when those two things are directly related. Or another way to say it is the cause and effect are not timed synchronized. Yes, the reason why the ball hit the ground is you released the ball from your hand, but it didn’t hit the ground at the same time it left your hand.
2slugs,
Looking at manufacturing employment in PA
https://fred.stlouisfed.org/series/PAMFG
PA real state GDP per manufacturing employee has increased since 2005Q1 at about a 1.2% annual rate using a log regression and finding the log growth of the slope.
I did not look at MI and WI yet, but assume similar output increases.
Do you have real state GDP by sector so you can break out manufacturing output.
Comparing real GDP to manufacturing employment is adding craps and apples to get crab apples.
Hi Spencer,
Sorry I was not clear. I used the manufacturing GDP supplied by 2Slugs and manufacturing employment to do the regression so, I think I have apples and apples.
https://fred.stlouisfed.org/series/PAMANRQGSP
https://fred.stlouisfed.org/series/PAMFG
AS Well, this is weird. Employment numbers are down. Output is up slightly. And average hours worked are gradually drifting down.
https://fred.stlouisfed.org/series/SMU55000003000000007SA
https://fred.stlouisfed.org/series/SMU42000003000000007SA
https://fred.stlouisfed.org/series/SMU26000003000000007SA
To sum up: fewer workers working slightly fewer hours producing slightly more output. And employers crying about a tight labor market. Whatever. Maybe the small sample sizes at the state level are to blame.
So it’s the green line/number you’re crunching out using log-log etc?? Hopefully I can do this someday. I got an econometrics hardcopy text here in the last couple days, so hopefully that will help. I now have 3 books on R but only one that relates it directly to econometrics. One of them is focused on Data Science, but I actually think that might me good for me, because the Data Science “approach” will focus on the actual problem solving and setting up models for data and “tidying” and “wrangling” the data. So, I think I have enough materials going back now after my other computer broke down on me.
My only problem is the same problem as always, making the efforts and committing the time.
https://detroitmi.gov/news/first-city-detroit-forecast-projects-faster-job-growth-state-michigan
I don’t know how much cheerleading is going on here, but still I thought it was interesting in relation to Menzie’s post.
One could make a good argument there was “no place to go but up” for Detroit.
It is good to see Detroit going up, but there was no guarantee it would. Some urban areas simply go down and keep going down until they disappear, although in the US that usually only happens to smaller “ghost towns.” But note in history that the first city ever to exceed 100,000 population and the world’s largest for several centuries came to cease to exist and not with a bang but with a whimper. That would be Babylon.
@ Barkley Junior
What’s your source that says Babylon was the first city above 100k ??? Please don’t say Quora. Also, could the Virginia based PhD inform us what his idea of “several” centuries would be here?? “Several” to me implies more than 2.
Hey, super-bloviating PhD guy in Virginia, are you excluding Chinese cities in these numbers?? Asking for a friend:
https://www.theguardian.com/cities/2016/dec/06/world-largest-cities-mapped-through-history-data-viz
MH,
Will grant that Babylon probably not the first to be over 100,000, although certainly one of the first. However, several sources have it being world’s largest in both 600 and 500 BCE, not just in 500 BCE as your source says (neither source Quora; both are ones provided on Wikipedia, which does not provide your source; google “world’s largest cities in history,” easily found).
As it is, city sizes are one of the most disputed and fuzzy numbers out there, especially as we go back far into history way before there were any censuses. Thus if you google “world’s largest cities” right now you will find competing lists that have lots of disagreement with each other, assuming we are talking about “metropolitan area.”
All sources agrees that Tokyo is the largest in metro area population, but who are the next four on the list? Scanning across five different sources easily found by googling I found 11 such candidates for the next four in population, including
Shanghai
Delhi
Jakarta
Mumbai
Mexico City
Karachi\
Sao Paulo
Manila
Seoul
Chongqing
Guangzhou.
As it is, my main point certainly holds: Bablylon was once the world’s largest city and later went all the way to zero in population. So the claim I criticized that a once large city has been declining (Detroit) means it must “hit bottom” and turn around is simply not true. It can go to zero just as a city did that was once the world’s largest. Are you disputing that Babylon was once the world’s largest metroplolitan area and that it later went to zero in population where it remains even today?
Ah, it was you that made the silly argument about Detroit, wasn’t it, Moses? No wonder you are going nuts.
As it is, even your main claim I granted is up in the air. I have checked further on which was the first city to reach 100,000, and, yes, there is a lot of debate, and, yes, one source even says it was Babylon.
So, Quora says either Avsris, in Egypt or Nineveh in Mesopotamia, probably around 1600 BCE.
Modelski says it was Ur in Mesopotamia (in 2100 BCE, earlier than anybody else’s claim)
Chandler goes with Avaris around 1650 BCE
Morris says Babylon in 500 BCE.
Take your pick, and, oh, want to apologize for losing it again. Probably one of these others (not in China) beat Babylon, but it was probably world’s largest for at least two centuries, and it certainly went to zero a long time ago and has stayed there.
Want to apologize for going off the rails yet again, Moses, and making an ass of yourself?
Oh yes, and I do see you argue that “several” means more than two, which is correct. Well, yet another source, Businessinsider, says Babylon was world’s largest in 700 BCE,, so that puts it up to three centuries possibly.
you just went wildly overboard with your claims on this matter, quite aside from being just completely wrong on the main point. Deal with it, Moses.
@ Barkley Junior
I’ll have to learn to control myself when correcting your false statements on historical “firsts”. As the regulars here are accustomed to you making Sh– up out of thin air, I do this mostly for Menzie’s newbies, who might assume a man with a PhD would avoid making false statements about famous historical cities. Or even would assume that he just avoid making false statements in general. Your progression from quoting Quora gives your former students less shame to admit they took your class though, and sets a more positive example on how an academic might source their information.
Moses,
Just looked at your Guardian source again. It has Ur the first to get 100,000 in 2100 BCE followed by Avaris in 1650 BCE. First Chinese city to make it is Yinxu in 1300 BCE. It has Nineveh top dog i 650 BCE and Babylon top in 500 BCE, but Babylon is t 200,000, the firs to make that size.
Moses,
Your own source has it that Babylon set a new high in urban population when it became the world’s largest city, with it saying it was 200,000 rather than 100,000, although it may have been the latter. These numbers are very fuzzy, but it is agreed that Babylon set a new high when it became the world’s largest urban area. And then somewhat over a 1000 years later it ceased to be a city.
You were the one who made a ridiculous statement: That there was “no way for Detroit to go but up.” As I noted it is good that it has gone up, but that was not at all a given. Like Babylon, it could have continued to go down and could be doing so right now.
Brad DeLong reminds us of this 1994 paper by the late great Milton Friedman entitled “Free Floating Anxiety” as the 4th paragraph on page 3 is yet another take down of Judy Shelton.
https://miltonfriedman.hoover.org/friedman_images/Collections/2016c21/NR_09_12_1994.pdf
If you have positive productivity growth you would expect output growth to exceed employment and/or hours worked growth.
So output expanding with labor contracting is not abnormal.
On a cyclical basis employment usually lags, so you get falling productivity in a downturn and expanding productivity in a recovery.
Back in the day of the four year cycle productivity was generally strongest in the first year of a recovery and slowed in the following years.
That was why productivity growth was such a great leading indicator — it leads real GDP growth by two quarters. That pattern still exist, but it is much weaker now.
spencer I don’t think that explains what we’re seeing here. The kind of cyclical productivity growth that you have in mind is driven by increased demand. I don’t think that’s the story here. Firms will tend to hoard labor during downturns and assign BS tasks or “make work” jobs until demand picks up. We’re long past that point. What seems to be happening here is increasing output with fewer labor inputs. Firms are shedding jobs and labor hours. If manufacturing output is increasing because of increased demand for goods produced in PA, MI and WI, then we would not expect firms to shed labor, ceteris paribus. If firms are shedding jobs and hours, then presumably those firms are getting productivity growth from either more capital inputs or some increase in worker effort. But yet NIPA data does not support a claim for increased investment in manufacturing equipment. So I don’t know what’s going on here. Are we seeing greater dollar value output as a result of a greater price setting power for certain industries common to those three states? Are firms better able to intimidate non-union workers?
Maybe we are seeing some kind of statistical noise.
I can’t speak to Wisconsin and Pennsylvania, but since Michigan’s manufacturing employment is tied closely to the automotive industry, it seems these data might be relevant: https://www.bls.gov/iag/tgs/iagauto.htm
The data that is not seasonally adjusted gives more detail. Oddly, while vehicle manufacturing employment has increased slightly, parts manufacturing employment has decreased significantly. And employment in the wholesale and retail end of the automotive industry is healthy. So, the question is: does the decline in parts manufacturing employment reflect a future (anticipated) downturn in vehicle manufacturing or are the parts manufacturing employment the result of an odd, temporary disruption, or even a faulty survey? Usually, parts manufacturing is less prone to wild swings because the output is split between vehicle manufacturing and replacement parts (which have a more stable demand) and tends to show larger declines when there are protracted vehicle manufacturing declines (including strikes).
How is a little detail that you must have missed. Retail trade employment rose but manufacturing employment fell. Huh – that is totally inconsistent with some nonsense we saw a while back from that fellow we call Single Statistic Bruce “no relationship to Robert” Hall. I think you know this fool so say hello to him for us!
pgl, I didn’t miss the point that manufacturing in fell. I simply pointed out that vehicle manufacturing (which is >20% of Michigan’s economy) didn’t fall, but the parts manufacturing for vehicles fell significantly which I found to be odd (explanation in my original comment).
So, are you just in a foul mood or did your boyfriend leave you? Speak to the data, please (and try reading the comment before you reply).
Lord Bruce – gay jokes now? Hey – it is not my fault that your comments are almost always stupid. I guess that MAGA hat of yours has had the same effect on your brain as it has had on everyone else’s brain who dons it.
pgl: Homophobia, misogyny, racism, xenophobia are the typical refuge of those who cannot debate on the basis of data and theory.
@Menzie
Are you certain Bruce Hall isn’t just repeating the Republican Party platform now??
https://www.theguardian.com/books/2013/may/04/niall-ferguson-apologises-gay-keynes
https://images.app.goo.gl/77pMa9euCEkSyg8g6
Menzie, you are correct; I should not have stooped to pgl’s level. I apologize.
Bruce Hall: I have not conducted an exhaustive review, but I do not recall any specific instances where pgl has made a racist, misogynistic, homophobic or xenophobic remark. Please provide an example and URL for instances where he/she has.
“a faulty survey” is Bruce Hall’s explanation for less employment? Like he knows more than the economists at BLS? And we mock Judy Shelton for this type of intellectual garbage!
From Jan. 2019 to Jan. 2020 BLS reports total motor vehicle manufacturing employment fell by 24.9 thousand, which appears to be more than the fall in parts manufacturing. Of course Bruce Hall likely is misrepresenting the BLS table or maybe he does not get what it is showing as he is confident that more people are being employed making new vehicles. Hey – he cites BLS but he cannot even read what it says. And then he has the audacity to suggest BLS is reporting faulty data.
No Brucie – it is your brain that is faulty. And don’t blame anyone else especially the good folks at BLS for your own stupidity.
Bruce Hall vehicle manufacturing (which is >20% of Michigan’s economy)
Where did you get that statistic? According to BEA data all durable manufacturing, of which vehicle manufacturing would be a subset, only accounts for 14.3 percent of Michigan’s state GDP.
Bruce does get ahead of his skiis a lot. Note he made a BIG deal out of a tiny increase in a subset of employment data over a short period of time – totally unaware that this data was not seasonally adjusted. Of course if the data does not fit Bruce’s MAGA hat wearing view – he accuses the BLS of providing “faulty” data.
I might have been looking at some older data:
From 2018: Manufacturing comprises 19 percent of Michigan’s economic output, compared to 11.8 percent nationwide. https://www.bridgemi.com/economy/michigans-economy-bigger-ever-now-time-diversify
USNews reported it at 18.8%. https://www.usnews.com/news/elections/articles/2019-12-18/the-declining-economic-impact-of-manufacturing-no-longer-made-in-america
The GM strike last year may have had a large impact on overall vehicle manufacturing in Michigan, but that should be a temporary situation.
The point is that vehicle manufacturing in Michigan is well above the national average and the detail that I referenced (which was so badly maligned by the “group”) showed an unusual disparity between vehicle and vehicle parts manufacturing which led me to question the data because my 30-years in the automotive industry tells me that parts manufacturing is less volatile than vehicle manufacturing since a good portion of parts are used for repairs.
Bruce Hall If you’ll check the BEA tables for state GDP, you’ll find that your 18.8% number represents total manufacturing; i.e., durable and non-durable. Durable manufacturing represents 14.3 percentage points of total manufacturing. And of course vehicle manufacturing would be some fraction of that. I don’t dispute that the auto industry is a big player in MI, only that it’s nothing like 20%.
pgl, by the way, I kind of like Bob Hall’s view of things. For instance:
“If we don’t have a tax cut, there will be that much more room for pouring money down rat holes.” Hall, Robert, 1981. “The Reagan Economic Plan – Discussion,” Supplement to San Francisco Federal Reserve Bank’s Economic Review, May, pp. 5-15. https://fraser.stlouisfed.org/files/docs/publications/frbsfreview/rev_frbsf_19810501_seminar.pdf
“We should make a list of all the rat holes that the government is pouring money into today, and we should eliminate them.”
So, while I’m not Bob, we are aligned. Only I’d go one step farther: don’t dig new rat holes.
BTW clicking on those green boxes brings up an entire decade of employment data by month. It is very clear that you were either too lazy or too dumb to do so. When i clicked on these boxes, I saw a lot of volatility in the data which is readily explained by the note under all of these series such as this:
“All employees, thousands, motor vehicles, not seasonally adjusted”
I guess you do not get what “not seasonally adjusted” even means here. Come on Bruce – we know you are dishonest. We also know you are beyond dumb. But damn – can you make this so incredibly easy!!!
pgl, seasonal adjustment is irrelevant when looking at yr/yr for the same month.
i know its off topic
https://www.cnn.com/videos/politics/2020/02/18/peter-navarro-debate-job-growth-numbers-nr-harlow-vpx.cnn
i apologize to those who have worked with peter navarro, and there might have been a day when he was a respected economist, but this guy has become a total hack job. there is nothing worse than seeing a guy completely throw away his credibility in defense of garbage. the sad thing is, i think peter is beginning to actually believe the garbage he just spewed in this interview. he and donald may be living in the same fictional universe.
Poppy? Poppy? Come on Poppy stop confusing me with facts damn it. I loved it with Navarro complained about using “Keynesian tools” to reverse the Great Recession.
I have to admit when I started watching this clip I thought – who is this blonde bimbo? But Poppy wiped the floor making Navarro look like a total nitwit. Go Poppy!
its a replay from our old friend peakloser. he used to complain that the obama recovery was simply horrible, and the trump recovery was tremendous. and yet the obama numbers were better than trump. funny how the “new normal” was acceptable under trump, but not obama. how do you hold a serious conversation with such hacks?
He wouldn’t shut up. Probably because everything he said was either wrong or misleading. What a putz!
Navarro was trying to ManSplain TrumpNomics to Poppy but it wasn’t going too well.
Kinda depressing:
https://www.nytimes.com/2020/02/15/world/asia/mekong-river-dams-thailand.html