It’s the method described in this intriguing paper, by William Kinlaw, Mark Kritzman, and David Turkington. From the abstract:
The authors introduce a new index of the business cycle that uses the Mahalanobis distance to measure the statistical similarity of current economic conditions to past episodes of recession and robust growth. Their index has several important features that distinguish it from the Conference Board’s leading, coincident, and lagging indicators. It is efficient because as a single index it conveys reliable information about the path of the business cycle. Their index gives an independent assessment of the state of the economy because it is constructed from variables that are different than those used by the NBER to identify recessions. It is strictly data driven; hence, it is unaffected by human bias or persuasion. It gives an objective assessment of the business cycle because it is expressed in units of statistical likelihood. And it explicitly accounts for the interaction, along with the level, of the economic variables from which it is constructed.
I have never used this metric myself (I seem to recall there used to be a stats blog with the name). To save you the trouble of googling “Mahalanobis distance”, here is Wikipedia’s description:
The Mahalanobis distance is a measure of the distance between a point P and a distribution D, introduced by P. C. Mahalanobis in 1936.[1] It is a multi-dimensional generalization of the idea of measuring how many standard deviations away P is from the mean of D. This distance is zero if P is at the mean of D, and grows as P moves away from the mean along each principal component axis. If each of these axes is re-scaled to have unit variance, then the Mahalanobis distance corresponds to standard Euclidean distance in the transformed space. The Mahalanobis distance is thus unitless and scale-invariant, and takes into account the correlations of the data set.
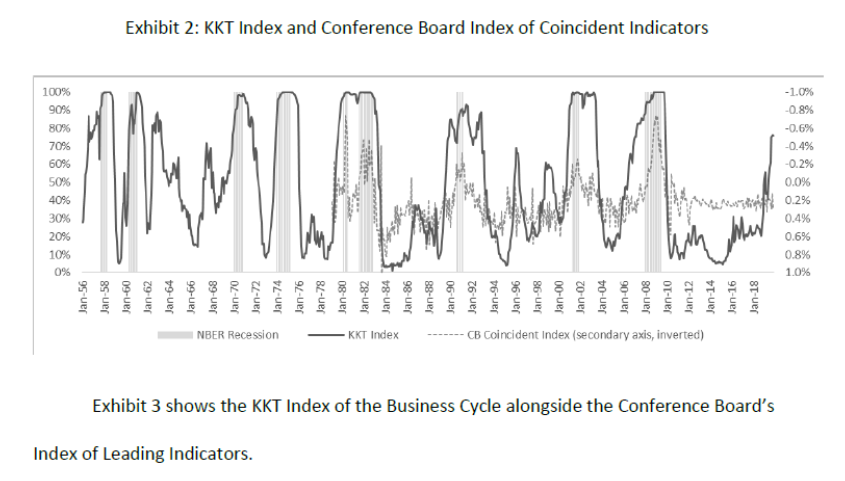
The KKT index over time is shown here:
The last observation in the data sample used is November 2019; the KKT index value for that month is 76. Using the below table:
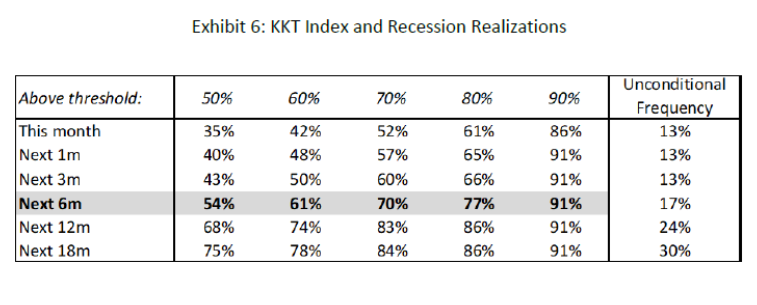
On finds that the implied recession probability in the six months after November 2019 is 70%, and for the 12 months after is 86%.
The paper includes a comparison to the yield curve (they use 10yr-Fed funds instead of 10yr-3mo as I do). It would’ve been useful (for me) to see what is the optimal threshold to use, as would a receiver operating characteristics curve indicate, or barring that, other summary information about false positives in a format recognizable to those who work on recession prediction.
(Also useful to note that yield curve slope is one of the divergent signals, so to the extent that “this time is different” because of a negative term premium, one might want to caveat the conclusions. In other words, we are assuming historical correlations hold true now.)
The Mahalanobis distance version used in the paper (without square root) shows up a multivariate normal pdf and shouldn’t be something that is too fancy. It has been used in outlier detection for a long time. This paper even notes the connection between the distance metric and the multivariate normal pdf in Equation 3. The only way the Mahalanobis distance even matters in this paper is really as part of a multivariate normal pdf…
There is still some interesting stuff there, but I wouldn’t emphasize the Mahalanobis distance per se.
John Hall: Yes, I agree, although the idea of principal components-ish approach to inferring a recession is atypical.
Menzie,
I agree on main points here. Probably the main reason to expect the actual probability to be lower than estimated by this measure is the likely much weaker importance of the inverted yield curve, as Jim H. has discussed.
OTOH, for this purpose I think the use of principle components is valid, and I have long thought that economists have been too averse to using this and related methods, viewing them I think as somehow atheoretical and used to much by sociologists and other “low life” economists sneer at. But then, VAR is as atheoretical as one can get, and it and its many offshoots gets used all the time.
A good check against the atheoretical nature of a principal components model is to ensure you can provide an intuitive understanding of each synthetic component. If you can’t satisfy yourself with some intuition for each component, then I’d be leery of using principal components.
I agree, 2slug. As it is, we do not know what is going on with this particular study or how much sense they make. I do know, however, that there is a bias in economics journals against using principal components, especially as compared with VAR and its relatives, which are all over the place and even used by the Fed. Economists rarely even bother to try using pc because of the entrenched bias.
Barkley Rosser PCAs are rare as hens teeth in econ. Most of the studies I’ve seen that use PCAs are in psychology or sociology. That might be due to the fact that economists rarely have enough observations to support having enough variables to justify PCAs. Also, psychology and sociology tend to use cross-sectional descriptive data, whereas economists tend to use time series analysis. Running a time series regression using the synthetically generated principal components is inherently less convincing than using PCAs to describe cross-sectional data.
John Hall,
You are simply wrong and 2slugbaits is right. Principal components is very rarely used in economics, although it is occasionally. 2slug is also right that is much more relevant for cross-section studies. It gets used in cluster analysis, also. These approaches tend to be atheoretical. One has some variables one thinks interact with each other and affect something in some way or other so one uses PC as a way to set up a way for them to interact in an orthogonal manner, which may not actually reflect reality.
Also, Mahalnobis distance most definitely does use principal components. Read the bloody Wikipedia entry that Menzie provided. It says so right there. What is your source for claiming otherwise?
Sorry I did not check back sooner. Thank you for your reply, but I disagree.
First, I would not describe an approach using principal components as atypical. Maybe it is not as common as simple probit models, but there is a whole literature, going back to at least Stock and Watson (1989), that uses factor modelling to extract coincident or leading indicators from economic data. These indices can then be used to predict whether the economy is either in a recession or will be in a recession.
Second, I would not describe the paper as using a PC-ish approach. I would describe it as a type of classification algorithm. Its basically calculating the likelihood of some data using two sub-samples (expansions and recessions) and scaling that to give a probability of recession. Nothing about this uses principal components. You could probably use the coincident or leading indices extracted from a factor-based approach and then perhaps apply a univariate version of the classification algorithm used in this paper. But that’s not what the paper does.
John Hall,
See my comment now above yours, which I misplaced. It belongs here. In any case, you are simply wrong that PC is widely used and also that it is not part of Mahalanobis distance.
PCA and other factor modelling strategies are very commonly used in econometrics when dealing with big data issues. Granted, when extending problems to handle missing data or data with different frequencies, then some more advanced techniques are required. However, the same insight of PCA is often used. Also, finance is a sub-field of economics, and finance uses PCA a lot. See also my response to Menzie.
On Mahalanobis distance and PCA, the Wikipedia article is explaining Mahalanobis in terms of PCA. That doesn’t mean that Mahalanobis uses PCA as part of its calculation. Rather, PCA is a very common tool for thinking about covariance matrices, which are an important input into the calculation. Let me repeat, the formula for Mahalanobis distance takes the data, the mean of the data, and the covariance matrix of the data and spits out a number. It does not require an eigenvalue or eigenvector to be calculated at any point. It does not require a singular value decomposition. It does not require PCA at all. However, to the extent that you can understand a covariance matrix with PCA, then it can help you understand what the Mahalanobis distance is telling you.
John Hall: Thanks; Stock and Watson were both teachers of mine, so I take whatever they say seriously. But it does seem to me this KKT paper is doing a *static* (not dynamic) modified principal components approach to characterizing the data, then saying whether it matches or doesn’t expansion/contraction. I thought SW used more for characterizing the growth rate than saying we’re in a recession or not (but then I haven’t read all the SW papers on this subject).
I consider it a very simple extension to go from characterizing the growth rate to saying we are in a recession or not. I also meant to imply that the SW paper was very influential for a whole literature of papers that use factor models in econometrics. This includes models that use PCA as well as the Bernanke et al 2004 factor-augmented VAR paper that I believe used a Kalman Filter to accomplish something similar.
This may come as a surprise to Menzie, as I consider myself better than the average American at math (given, an extremely low bar for comparison) I don’t meet my own standards on what would be considered being very good at math and at least at this moment after I have forgot some of my college learning, rather inept. But it is these more math intensive posts of Menzie’s which are often my very favorites. I am hoping we will get more of this juicy exotic fruit in the next few months as Menzie is teaching his course which I believe is probably more conducive to these math intensive posts and we will be the beneficiaries of Menzie teaching this class at his Uni.
East Indians (or are we so ultra-sensitive now I have to say East-Asians to avoid someone wetting themselves??) tend to be good at tech and math. I’m certain this Mahalanobis knew what he was doing (aside from the fact of if this technique works for this specific application, it’s an interesting ponder either way).
It’s hard to get an un-gated version of the paper (not necessarily a complaint, just a statement of fact). This paper is the closest I seem to manage. He gives a couple references also, and I may try to hunt those down today:
https://www2.gwu.edu/~iiep/assets/docs/papers/Sinclair_IIEPWP2012-03.pdf
This mentions Mahalanobis, on pages 5 and 6, but not sure how much it assists in the explanatory department:
https://core.ac.uk/download/pdf/6608717.pdf
I CANNOT attest to the safety of this download link just below. It will immediately download once you click the link. However it does appear to be a real publisher of open access journals. So I would say 80% this download is safe, and have actually gone ahead and used it myself. But you have been warned that I cannot 100% attest it is a safe link:
http://www.redfame.com/journal/index.php/aef/article/download/511/497
The latter link relates more to finance than economics, but still might help in grasping the Mahalanobis concept.
Off topic, but, Mose, would you likke to admit now that we have reached the end that your sneering at “the Mormon” was completely misplaced as I warned you of and you sneered at?
@ Barkley Junior
Do you really think I am the type of person to do such a thing as admitting personal error?!?!?!?! I follow the code of the Virginia based Puh-huds: “Never admit to being fallible.”
Unlike you, Mose, I readily admit and agree when I have been shown to be wrong here (and elsewhere) when that occasionally happens as it does.
Can you give examples?? We’re all dying to know. When you finally figured out you weren’t perfect doesn’t count as one.
Mose,
I agreed I was wrong that Kamala Harris would be a major contender. There have been quite a few times when I have been off, usually on pretty minor things. But you saying I have never been so is as false as the sort of stuff Trump was spewing in his SOTU, and, no, I am not interested in strolling through my worst hits. You, OTOH, have yet to admit you were wrong about some big matters such as your stuff about skewed distributions, which you keep bringing up, even though numerous people have pointed you are completely wrong about, not just me.
In any case, this is you again: you are wrong, but do not want to admit it and want to focus on me. Is this Trump trying to change the focus to Joe and Hunter Biden? Yes, it is. Deal with it and grow up.
@Barkley Rosser
Yes, [ clears throat] you have only ever been wrong about “minor things”. It’s funny every time on here you tell me “multiple people” took your side on your false claim on the skewed distribution (does this include the authors of the paper, who never used the word skewed in the entire paper. Which, said paper, I had to rhetorically pistol whip you into naming the paper, and then I had to provide the blog the link for??). Commenter “Baffling” to date is the only person who took your side on this, and when I asked multiple times for Menzie to state it was what you labeled a “skewed” distribution (I must have asked him 30 times by now) each time he refuses. You’re also an imaginative little PhD, which is rather cute at your stage of life.
@ Barkley Junior
BTW, if you weren’t so incredibly busy trying to convince us all your 3 inch dick was a 3-foot dick, you’d notice this comment made over 72 hours prior, in the same thread (imagine!!!) where we had the disagreement on Romney’s “great moral fiber”:
https://econbrowser.com/archives/2020/01/disposition-of-forces-in-donbass-region-ukraine#comment-234016
Mose,
It was quite a few people besides baffling, but they did so way back when all this first was discussed, so I do not blame them for not repeating it the many times you have continued to drag this out with still no idea how flagrantly and stupidly wrong you have been on the matter.
As for what you sent me too, I do not open your links, most of which are pointless irrelevant garbage.
In the meantime, again, all this is a distraction from the fact that you totally messed up on Romney and have not come clean on it. Do it. You also still owe me at least two apologies for having made flagrantly false statements about me, but we get it in general that like Trump you do not do apologies and do not admit you are wrong (I think on one of those you did admit you were wrong, but did not provide an apology, rather made an apology conditional on me running around chasing down some irrelevant data).
@ Barkley Junior
Why don’t you provide the links to those, other than commenter Baffling, who said the paper’s data related to European Americans with Native American ancestry was “skewed”?? That’s a rhetorical question, because the reason Barkley Junior doesn’t provide such a link is because it doesn’t exist. ANYWHERE on this blog. And you (like some non-college Virginia redneck) think that if you keep repeating the sky is red, then that makes it a fact, when you know it’s a LIE. And I know you so badly would like to provide that nonexistent link, but just like the original research paper you quoted I had to provide the link on this blog, after asking you about 5 times to put the link up because it presented data and statements contradictory to the way you represented the paper’s data.
Why do you keep making demands that I waste a lot of time tracking down stuff that everybody who pays attention here knows is there when you should be admitting you made idiotic attacks on Romney, not to mention offering ever longer overdue apologies?
Oh, while he stayed away from commenting on the underlying issue, I note that at one point not too long ago when you dragged up this silly stuff about skewed distributions, one person who noted that you were making some inaccurate comments was Menzie himself. No, not going to go dredging around to find it, but he did, and I do not wish to name others who said you were full of it because I do not wish to have you getting on their cases. But, really, Moses, you need to just stop bringing this up because all it does is remind everybody how wacked out you have been on this matter from the beginning. Nobody has ever supported you on it at all, while many have criticized you.
I thought that was the code of the orange guppy from Queens.
In the ego department?? —->> same difference
To those assembled reading this wonderful blog
It has now been a full 4 days since I made the blog comment conceding I was wrong about Romney’s vote on the witnesses, in the original thread. You’ve heard of “selective hearing’?? Apparently the Virginia based PhD is selectively illiterate.
I will put the link here, once again. Feel free to check the time stamp:
https://econbrowser.com/archives/2020/01/disposition-of-forces-in-donbass-region-ukraine#comment-234016
OK, Mose, you are off the hook on the Romney one. I did not see that post by you before.
Can’t fault former Massachusetts governor too much. Romney voted no on article about “abuse of congress”.
I wonder whether the inputs to the index – industrial production, employment, stock market returns and the yield curve – have the same predictive power now as in prior cycles. Didn’t the yield curve predict a recession some time ago? Is the stock market a reasonable input to the model, when the net purchase of equities in recent quarters has all been from buy-backs? I’m not aware of that ever happening before. I vaguely recall that employment is a pretty good predictor of recession, but IP was a red herring in the oil-patch head-fake during the mid-teens.
These same inputs end up in lots of other recession models. The statistical technique used here is different, and may be a statistician’s dream, but is that reason for confidence given the inputs to the model? The authors reported reason for their choice of inputs is that they differ from the ones used by NBER and can be used to create an index that worked in the past. No economic judgement required. If this cycle is different – the yield curve’s failed earlier prediction suggests it is – then this is a cool math exercise, but may not add much to our ability to look into the economic future.
He lived to be 103 years old. We all need to find out what Issur Danielovitch ate for breakfast every morning:
https://www.greensboro.com/kirk-douglas-rediscovers-his-jewish-roots/article_f0089879-de13-59f2-abc1-2df9e4dddb55.html
In his latter years he read and studied the Talmud avidly. A proud member of “the Tribe”:
https://www.nytimes.com/2020/02/05/obituaries/kirk-douglas-dead.html
Woody Strode was also a great actor, and held his own in any film you saw him in. Strode also had a memorable part in “Once Upon a Time in the West”. Strode died over a quarter of a century ago:
https://www.youtube.com/watch?v=zCLyLBrugD0
If it’s not too “cruel” or “troll-like” thing to say, Woody Strode was 50 times the actor say a Jamie Foxx is today, and would have buried Jamie Foxx in any toe-to-toe film scene. That concludes tonight’s episode of “Memory Lane Film Trivia”.
Here’s a better way to remember him. A great way to go.
https://www.youtube.com/watch?v=LClTjcyNJSI
I am a lazy SOB, I’m pecking around to see if I can find a site where I can kill my lack of econometrics knowledge and learn “R” at same time, instead of the proper way, learning Stock and Watson and then going to “R” after getting my econometrics base. So, I’m actually having better luck than I thought I might. Does anyone know anything about a site related to “R” called “SciencesPo”??? I’ve only read the introduction but the intro sure does seem to fit what I am looking for. Anyone ever tried this or have good or bad to say about “SciencesPo”??
Thanks for this article and the links. I did read the pdf version of the paper. While I can’t critique the statistical methods, I can comment on the substance in terms of the use of economic indicators.
First, the negative:
1. Although you didn’t show it, the authors include a graph comparing their method with the Index of Leading Indicators, concluding that the latter is really coincident. I don’t know how else to put it, but that’s just wrong. They don’t label how they are measuring the LEI Index, but it appears that they are presenting the YoY% change – which eliminates the leading aspect. By the time it turns negative YoY, a recession is usually happening. But when we measure it absolutely, the LEI Index clearly leads. Look at graph #2 in the link below:
https://www.advisorperspectives.com/dshort/updates/2020/01/23/conference-board-leading-economic-index-down-in-december-annual-revisions
2. I also have a problem with their probabilities over time. This is because, for any value of any economic variable, the chance that a recession will occur thereafter increases with time. That’s because, over most of our history until the 1980s, recessions have happened every 4 years or so. So over, e.g., a 48 month time horizon, there is an excellent chance that there will be a recession by then, no matter what you are measuring.
3. Historically, there have been two economic booms in the US in the past 60 years: the 1960s and the late 1990s. This model, like the similar Deutsche Bank model (which projects what is likely to happen to the yield curve in the near future), shows recession probabilities of 50% or more during much or most of those two time periods! A bad sign for an economic forecasting method.
Now, the positive:
What I see happening here is a simple metric composed of one pretty good (but not infallible!) long leading indicator (the yield curve), one pretty good (but not infallible!) short leading indicator (stock prices), and the two premiere (but, etc.) coincident indicators (industrial production and payrolls). So,
1. I like the “economy” of the model, i.e., its K.I.S.S. nature.
2. The best way to use indicators over time is, once long leading indicators turn, we want to see if the short leading indicators follow suit. Then we want to see if the coincident indicators follow suit. This model accomplishes that in one number. When the yield curve inverts, the chances of recession increase. If the stock market turns negative YoY, and the yield curve is still inverted, the chances grow considerably. If the two premiere coincident indicators then weaken to near negative YoY, a recession is almost certainly imminent. I like this approach. I think it might benefit, however, from separately computing the two leading components and the two coincident components graphically. I’ve done that preliminarily and it looks like a good way of presenting the data.
This year, 2020, is going to be a very good test of this model, because several other excellent long leading indicators: housing (permits, and as a share of GDP), corporate bond yields (which have a 100 year record and just made new all-time lows), and real money supply; have all turned much more positive over the past 9 months. In short, they lead to the opposite conclusion of this model about the economy in the second half of this year. In that vein, it would be interesting to see what the authors’ model looks like if they increased the number of long and short leading indicators as inputs.
Nothing personally, but your corporate bond ratings are “Triple A”. Those ratings don’t mean much as they will follow all ratings. Subprime corporate and consumer debt is ugly, it can be ugly for years before it implodes interestingly enough. I think Census spending is giving the economy a boost, much like it did in 99-00. But the hangover really showed later in the year into 2001. The current debt bubble is up to 16 trillion. Not as big yet as the 94-07 bubble, but adjusted for population growth, pretty close. At some point, no matter how much “Fed liquidity” debt servicing overtakes growth which causes a asset collapse, which further hurts the economy. Its a bad spiral.
I suspect real final demand flattens for a year before recession at least. We have only been flat since August. We got imo another 6-12 months of flat real final demand before problems arise.
I wish they had not written this sentence: “It is strictly data driven; hence, it is unaffected by human bias or persuasion.”
Nothing humans do is unaffected by human bias or persuasion. The data measurement can be affected. Sort of like a survey question. Where the “data” can be driven by the order of the questions and how the question sentence is structured.
Picky picky but that’s all I got.