Today, we present a guest post written by Jeffrey Frankel, Harpel Professor at Harvard’s Kennedy School of Government, and formerly a member of the White House Council of Economic Advisers. A shorter version appeared in Project Syndicate May 28th and The Guardian.
The World Bank on May 19, as it does every six years, released the results of the most recent International Comparison Program (ICP), which measures price levels and GDPs across 176 countries. The new results are striking. It is surprising that they have received almost no attention so far, perhaps overshadowed by all things coronavirus.
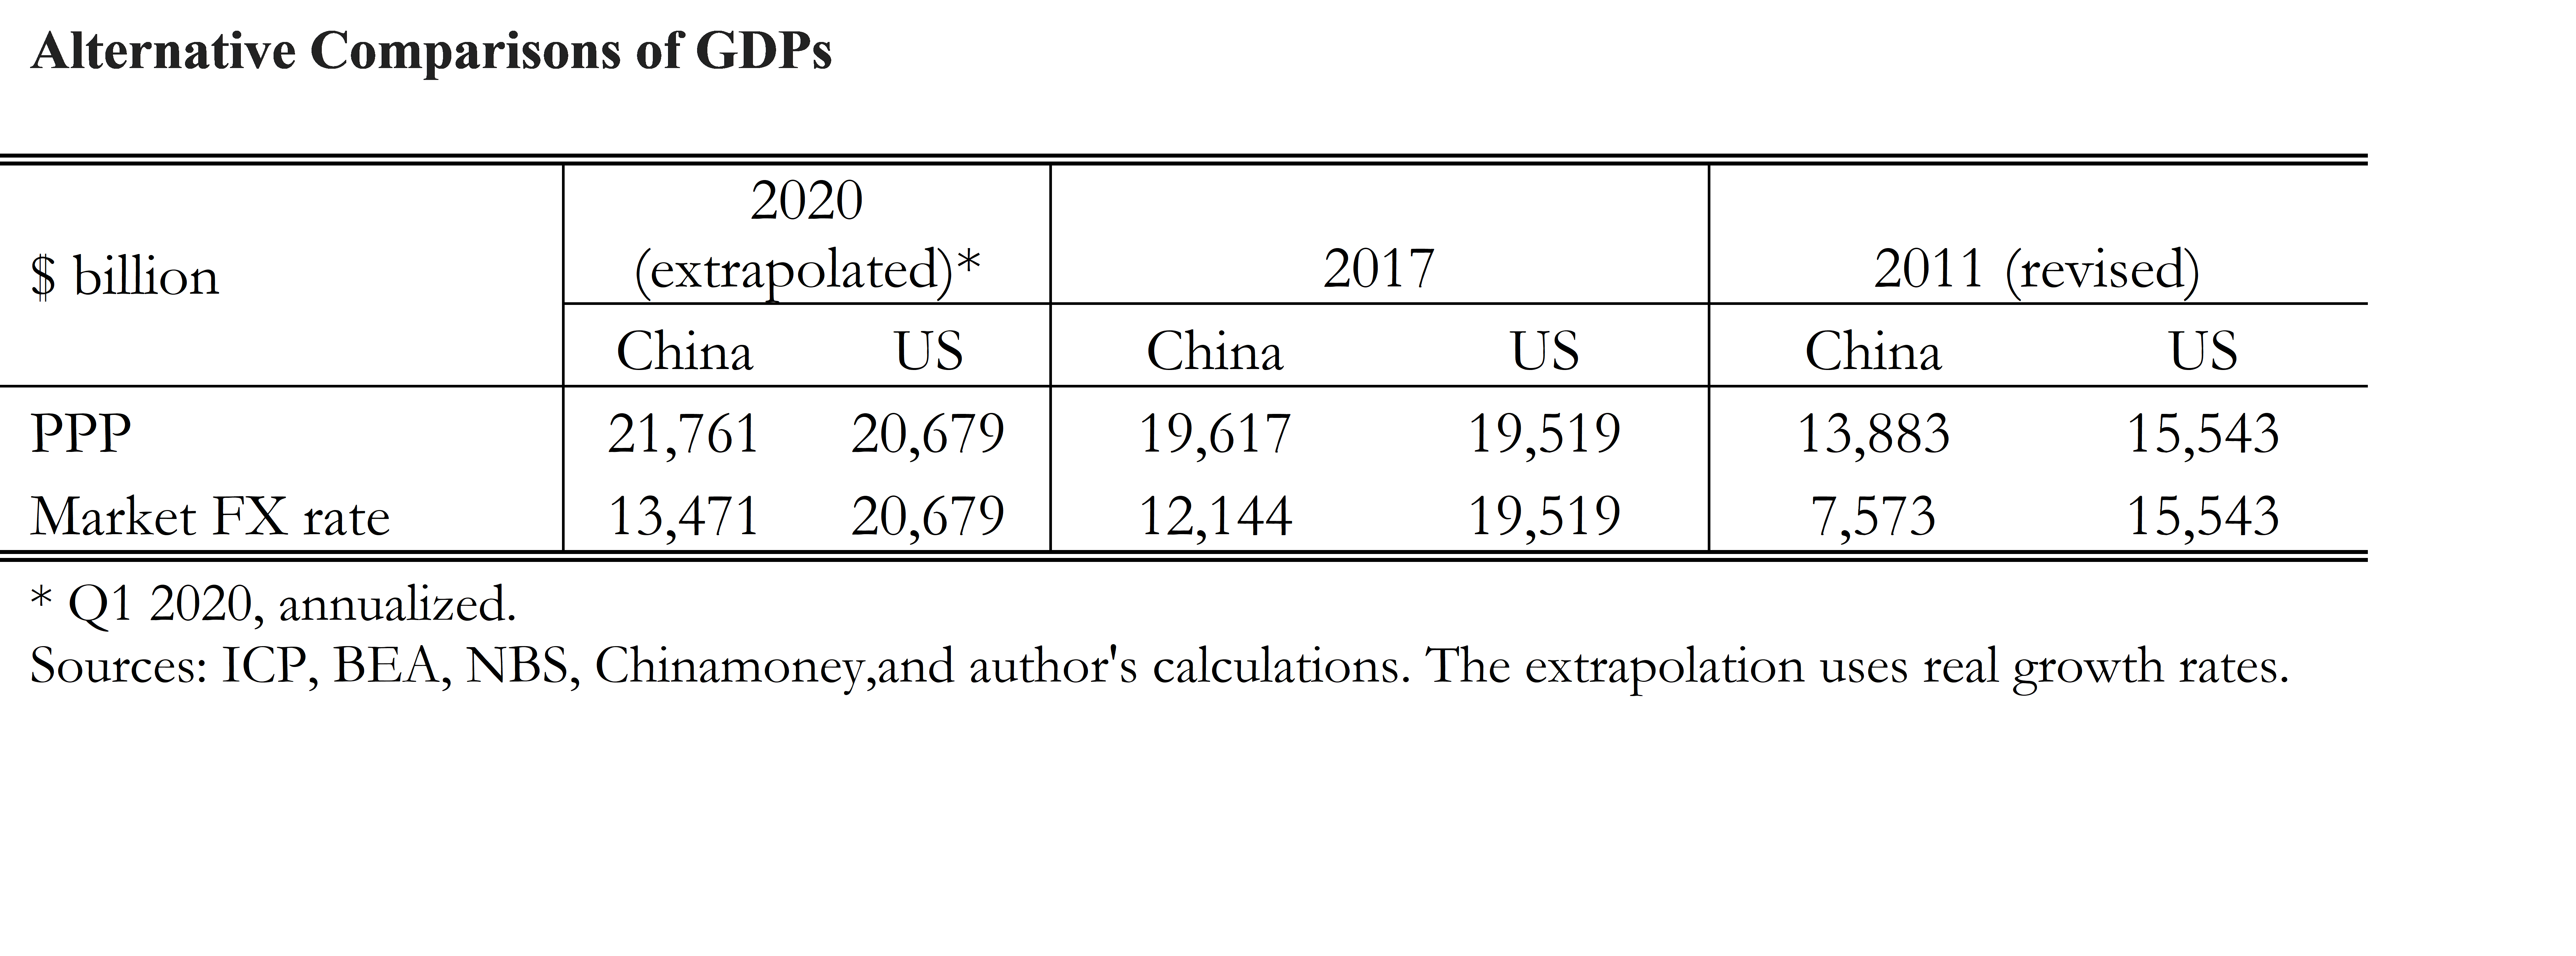
For the first time, the ICP shows China’s total real income as slightly larger than the US. It reports that China’s GDP was $19,617 billion in 2017, in Purchasing Power Parity (PPP) terms, while the United States’ GDP stood at $19,519 billion.
Income per capita
On the other hand, when China’s income is divided by its population, it is revealed to be still far from a wealthy country: its income per capita has pulled ahead of Albania and Egypt, but remains behind Brazil, Thailand, Mexico, and Botswana. China’s standard of living is still below the global mean, $10,858.
The two concepts — the total size of the economy and the level of income per capita — each have major possible implications. One must be careful to keep them apart, however, and to use the right measure for the right purpose.
China wants to be considered a developing country. For example, although the country had to give up many of the concessions traditionally accorded developing countries when it acceded to the WTO, it has not given up all of them. The ICP statistic for income per capita indicates that China is indeed still a developing country.
Total GDP
But it is the total size of the economy that matters for topical questions of great power rivalry and China’s appropriate weight in international institutions. Here the right answer is less clear. The contribution of the ICP enterprise is to compare countries’ incomes on a PPP basis. This is the right way to do it when computing income per capita. But I would argue that for questions of geopolitical power, it is better to compare national GDPs at actual exchange rates, not PPP exchange rates. At actual exchange rates, the US economy remains far ahead of China.
The ICP statistics released this month pertain to 2017. (The three-year lag in processing the numbers is typical.) China’s growth since then, though well down from the glory years of 1980-2010, has exceeded US growth. Thus, it would remain true in 2020 that the Chinese economy is bigger than the American economy, when compared on a PPP basis. But China is still far behind when compared by actual exchange rates.
The preceding ICP report
The question whether to compare national incomes by means of PPP or by means of actual exchange rates is familiar to international economists. This annoying but unavoidable technical problem arises because China’s output is measured in its currency, the renminbi (RMB), while US income is measured in dollars. How should one translate the numbers so that they are comparable? The obvious solution is to use the contemporaneous exchange rate: Multiply China’s RMB-measured GDP by the dollar-per-RMB exchange rate, so that it is expressed in dollars. By this calculation, the American economy remains more than half again as big as China’s, according to the latest figures. In 2017, US GDP was $19,519 billion, while China’s GDP translated to $12,144 billion.
Where does the PPP version come in? If one wants to measure the standard of living of Chinese citizens, one has to take into account that many goods and services are cheaper on that side of the Pacific. One yuan goes further if it is spent in China than if it is spent abroad. True, some internationally traded goods have similar prices in both countries. But haircuts and housing, services that cannot readily be traded internationally, are cheaper in China than in the US. For this reason, if one wants to compare income per capita across countries, one needs to measure local purchasing power, as the ICP does.
What does it mean to use PPP for the comparison?
The question whether to compare national incomes by means of PPP or by means of actual exchange rates is familiar to international economists. This annoying but unavoidable technical problem arises because China’s output is measured in its currency, the renminbi (RMB), while US income is measured in dollars. How should one translate the numbers so that they are comparable? The obvious solution is to use the contemporaneous exchange rate: Multiply China’s RMB-measured GDP by the dollar-per-RMB exchange rate, so that it is expressed in dollars. By this calculation, the American economy remains more than half again as big as China’s, according to the latest figures. In 2017, US GDP was $19,519 billion, while China’s GDP translated to $12,144 billion.
Where does the PPP version come in? If one wants to measure the standard of living of Chinese citizens, one has to take into account that many goods and services are cheaper on that side of the Pacific. One yuan goes further if it is spent in China than if it is spent abroad. True, some internationally traded goods have similar prices in both countries. But haircuts and housing, services that cannot readily be traded internationally, are cheaper in China than in the US. For this reason, if one wants to compare income per capita across countries, one needs to measure local purchasing power, as the ICP does.
What is the right way to measure economic size?
The PPP measure is useful for many purposes. It is right for computing income per capita, so as to know which governments have been successful at raising their citizens’ standard of living and whether they should be classified as developing. But not for questions of geopolitical power in particular. There is a fascination with the question how China’s economic size or power compares to America’s, and especially whether the challenger has now displaced the reigning champ as #1. PPP rates are not the best ones for making this comparison.
Why do we consider the United States the incumbent number 1 power in the first place? Partly because it is rich; but not just that. If income per capita were the criterion, then Luxembourg, Qatar, Norway, and Brunei would all rank ahead of the US. If you are choosing what country to be a citizen of, you might want to consider one of these richest countries. But we don’t consider Brunei and Luxembourg to be among the world’s leading economic powers, because they are so small. What makes the US the #1 economic power is the combination of having one of the highest populations together with having one of the higher levels of income per capita.
When we talk about size or power, we are talking about such questions as the following. From the viewpoint of the International Monetary Fund and other multilateral agencies, how much money can China contribute, and how much voting power should it get in return? From the viewpoint of countries with rival claims in the South China Sea, how many ships can its military buy? For these questions and most others where the issue is total economic heft, it is better to use GDP evaluated at current exchange rates. It is how much the RMB can buy on world markets that is of interest, not how many haircuts or other local goods it can buy back home. True, the Chinese government can pay more soldiers or sailors with one million RMB than the US government can pay with the equivalent sum of US dollars. But the productivity of the US military personnel is higher.
What does the IMF say?
Commentators such as Allison assert that the IMF says that the PPP basis is the right way to make the comparison and that it reports on this basis that China is larger than the US. It is true that the database for the IMF’s World Economic Outlook includes statistics that measure the weights of countries’ GDPs in PPP terms. It does this by extrapolating between the six-yearly-ICP measurement of GDP, based on separately measured real growth rates in each country. For arbitrary reasons of tradition, the IMF’s WEO has emphasized the PPP method when computing the weights to aggregate nations’ growth rates together, while the World Bank emphasizes the use of actual exchange rates in its own aggregation (which is ironic, in that the ICP numbers come from the World Bank).
But the IMF, in fact, has no official position on which economy is bigger or what is the right way to make the comparison. The closest it comes to an official position is the formula that guides the assignment of quota shares to member countries. The formula puts a weight of 50% on economic size, i.e., a GDP measure, and the rest on other indicators such as trade openness). The formula’s index of GDP itself assigns a weight of 60% to GDP measured at market exchange rates and only 40% to GDP at PPP rates.
The IMF takes the quota sizes seriously. For one thing, if China were to attain a higher quota than the US, the Articles of Agreement say that the Fund would have to move its headquarters from Washington DC to Beijing, as then-Managing Director Christine Lagarde noted in 2017.
For now, the weight of China’s influence at the IMF remains far behind the US. But under its current president, the US is rapidly giving up influence in multilateral organizations such as the WTO, NATO, and – even in the midst of the global COVID-19 pandemic — the World Health Organization. One can expect that China will fill the vacuum.
International relations are not a zero-sum game, especially in the coronavirus age. For 75 years the US has had the best of both worlds: a stable multilateral rules-based system and hegemonic perks such as the special role of the dollar. The US does not lack the economic or financial power to sustain its leadership of the international order. But under President Trump, it lacks an understanding of why it is important.
This post written by Jeffrey Frankel.
“The PPP measure is useful for many purposes. It is right for computing income per capita, so as to know which governments have been successful at raising their citizens’ standard of living and whether they should be classified as developing. But not for questions of geopolitical power in particular. ”
Geopolitical power includes military power, in this field a PPP measure sets of course the relevant bar. China (or Russia) get for one dollar spent much more than the USA or other western countries.
Several lmonths ago when he was still putting posts on his “Beat the Press” blog (silent for some time now unfortunately), Dean Baker claimed that China’s PPP GDP is 30% greater than that of the US. I do not know what his source for that claim was, but it suggests that there may be more than one entity out there making these calculations.
Menzie, or anybody else: does anybody know of other competing ssources of these estimates that Dean might have been drawing on for such a post? He has in general been someone fairly reliable about data reporting. He had the US still ahead on a nominal exchange rate GDP comparison, but much closer than the numbers Menzie reports here.
Barkley Rosser: To my knowledge, the underlying source for both Penn World Tables and World Development Indicators measures of constant value PPP measures is the ICP. However, how the series are interpolated between benchmark years differs between PWT and WDI. World Economic Outlook of IMF reports PPP (only at current values), so really only these two alternatives exist for many countries, over a long span of time.
It was on 11/28/19, and Dean said that China surpassed the US in PPP GDP in 2015 and “is not more than 25 percent larger” in PPP GDP. He does not provide a source for these claims. It appears in (sure this will not link properly, but…) counterpunch.org/2019/11/28/china-has-hugely-outgrown-us-under-trump . I note this did not initially appear in his usual blog, Beat the Press.
Barkley Rosser: Easiest to download is IMF WEO (April 2020) PPP (current I$): 2014 18205 vs 17527 bn China vs. US. Using a different series could easily give different crossover year, since data has to be interpolated between ICP benchmark years.
Re: Baker
Just went to “Beat the Press” and found this: https://cepr.net/trump-veto-student-loan-debt-relief-measure-will-save-government-0-02-percent-of-projected-spending/
Dated 30 May
Maybe you meant Bernstein?
All of this assumes, of course, that China tells the truth on its stats. But I know, even raising this issue is kinda delicate, because so many people, starting in Harvard, are willing to believe anything that China claims. But again, even asking the question is (to say the least) delicate.
Manfred: “…so many people, starting in Harvard…” Ever been to Harvard? You better check where Peter Navarro got his PhD.
It doesn’t really matter anyway. It’s just numbers. Based on debt and ponzi debt.
Surrounding the George Floyd case, I often heard the phrase “99% of the police are good.” I was dubious. After all what are the odds that 4 bad cops show up on that scene? Well those odds are 1E-8 or 1 in 100,000,000. Pretty suspect that 99% of the police are good, right?
Well I found the number of arrests per year is approximately 14,000,000,000, so over a 5 year period there are 70,000,000 arrests. So if over a 5 year period, 1 of the such egregious arrests were to occur the odds are 1.43E-8, so close the the 99% number claimed.
sammy: Would your view change if each incident that *did* occur had as a victim a person named “sammy”, or shared exactly your personal characteristics?
If you want to personalize it, I have had my share, probably more than my share, of contacts with the police and, in the majority of those contacts, I would not characterize the actions of the police as professional as I would expect (but did not rise to the level of those in Minneapolis). I can only imagine that it is much worse as a profiled person. So I am not a fan of the police in general.
So I was incredulous of the “only 1%” of the cops are bad phrase, bad rising to the psychopathic level of Minneapolis, particularly since 4 out of 4 psychopaths were involved in the incident. So I ran those numbers.
Kaepernick raised the issue four years ago. Peacefully. Result? He was fired and ignored. Trump bashed him for peaceful civil protest. Now trump wants to shoot protesters. Private bone spurs lacks any integrity or leadership qualities.
sammy the number of arrests per year is approximately 14,000,000,000
Sure about that? I’m guessing that you’ve got a few too many zeros.
I often heard the phrase “99% of the police are good.”
I grew up in the Chicago area. I can’t say that I ever heard anyone ever say that.
what are the odds that 4 bad cops show up on that scene? Well those odds are 1E-8 or 1 in 100,000,000.
You’re assuming that the goodness or badness of each cop is independent of that cop’s partner and department. That’s not a good assumption. You’re also assuming a cop’s goodness or badness is time invariant, which is almost certainly not true. There are other problems with your statistical model, but I’ll let you think about it as a homework problem.
“You’re assuming that the goodness or badness of each cop is independent of that cop’s partner and department. That’s not a good assumption. You’re also assuming a cop’s goodness or badness is time invariant, which is almost certainly not true. There are other problems with your statistical model, but I’ll let you think about it as a homework problem.”
Statistical analysis was never Sammy’s forte. My city has well over 30 thousand police so if Sammy’s totally made up 1% were accurate – we are talking about 300 bad cops. And those cops are not patrolling the Upper East Side. Most of this police brutality seems to happen in poorer neighbors and to minorities. A fact not factored into Sammy’s “analysis”.
Oh, almost forgot to mention the U.S. response to the Covid outbreak. China lied but shut down an entire region, saving countless lives and preventing even worse economic slowing. The U.S. government lied and interfered with efforts to prevent the spread. All the world saw it happen.
This follow-up comment belongs a little lower in the que. Oops.
Frankl notes that “great power” questions rely more on economic size than on per capita income – standard geopolitical stuff. Economic output is a base from which to build, not the end of the story.
China’s economy grows faster than the U.S. economy most of the time and has been accruing economic influence in the world relative to the U.S. (and EU). The U.S. spent $732 billion on its military in 2019 (according to SIPRI: http://www.sipri.org/publications/2020/sipri-fact-sheets/trends-world-military-expenditure-2019), while China spent $261 billion. U.S. military spending is down about 15% from ten years ago (a decline which reflects reduced military action abroad, among other things), while China’s is up about 85%. The U.S. is the world’s largest importer, China is third if you count the EU as a single entity, second if not. China is first, the U.S. second in exports. The U.S. has vast international financial power, far more than has China, though China has shown itself to have considerable impact on global financial markets when it changes domestic financial policies.
How are the two countries making use of there respective powers? The U.S. is withdrawing from some international organizations, ignoring some and criticizing many. The U.S. has engaged in trade battles with geopolitical rivals and allies alike, on a scale which I’d guess could compare to the embargoes and trade restrictions of the Cold War era, though that’s just a guess. Nothing like it in the intervening period. Efforts at coordinated trade action have paled next to unilateral action and have alienated allies who in some cases were overtly asking for coordinated action – Chinese intellectual property infringements are the obvious case here. The U.S. has threatened to withdraw from mutual defense agreements.
China has its own problems, the result of expansionist intentions in and around the South China Sea and the result of continued violation of trade norms (mostly of western origin), but is working to build new regional trade and economic alliances to supplant or at least offset the post-WWII order devised largely under the U.S. aegis. China imports are vast, and tie other countries together in supply chains, same as the U.S., but economic trade activism both allow China to gain more influence from its imports than orders alone would do.
All of which is to say (you saw this coming, right?) that the U.S. has truly smooched the pooch under Donald Trump’s leadership, surrendering influence hand over fist at a time when China’s overall economic size rivals that of the U.S.. I guess that’s making America great again.
“The U.S. spent $732 billion on its military in 2019 (according to SIPRI: http://www.sipri.org/publications/2020/sipri-fact-sheets/trends-world-military-expenditure-2019), while China spent $261 billion. ”
But here it makes a huge difference when we use PPP, then suddenly the difference is not longer 3 times.
So is Prof. Frankel’s post about China’s PPP with respect to the US, or is it more of a (not so) veiled reference to his colleague Graham Allison’s “Thucydides Trap” thesis? I’m gonna say the latter.