With the release of personal income and sales figures today, we see the continued deceleration in economic activity continues, according to some key indicators noted by the NBER’s Business Cycle Dating Committee (BCDC).
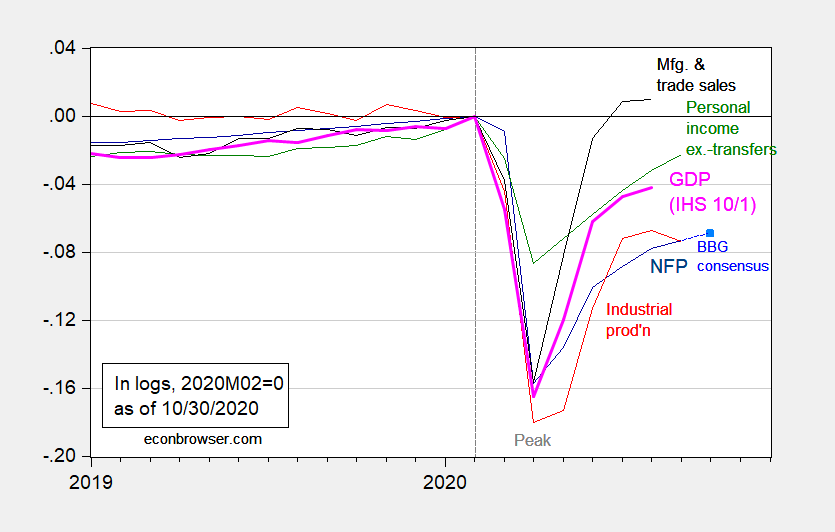
Figure 1: Nonfarm payroll employment (dark blue), Bloomberg consensus for October as of 10/30 (light blue square), industrial production (red), personal income excluding transfers in Ch.2012$ (green), manufacturing and trade sales in Ch.2012$ (black), and monthly GDP in Ch.2012$ (pink), all log normalized to 2020M02=0. NFP observation for October is based on Bloomberg consensus as of 10/30. Source: BLS, Federal Reserve, BEA, via FRED, Macroeconomic Advisers (10/1 release), NBER, Bloomberg, and author’s calculations.
Manufacturing and trade industry sales were essentially flat in August, while personal income ex.-transfers rose. That being said, real disposable personal income is down 8.7% relative to 2020M04 peak. Employment is slated to further decelerate, with the Bloomberg consensus increase at 600K, down from 850K two weeks ago.
A lot of the dynamics at the monthly frequency are obscured at the quarterly, which was discussed by Jim yesterday in “Record breaking in GDP”. For instance the partial snapback in Q3 is probably dissipated at M05. Hence, it might be of interest to consider how monthly GDP moves relative to quarterly explicitly. Unfortunately, IHS- Markit hasn’t released its September figure. I use reported July and August figures and actual BEA advance Q3 to infer the September value.
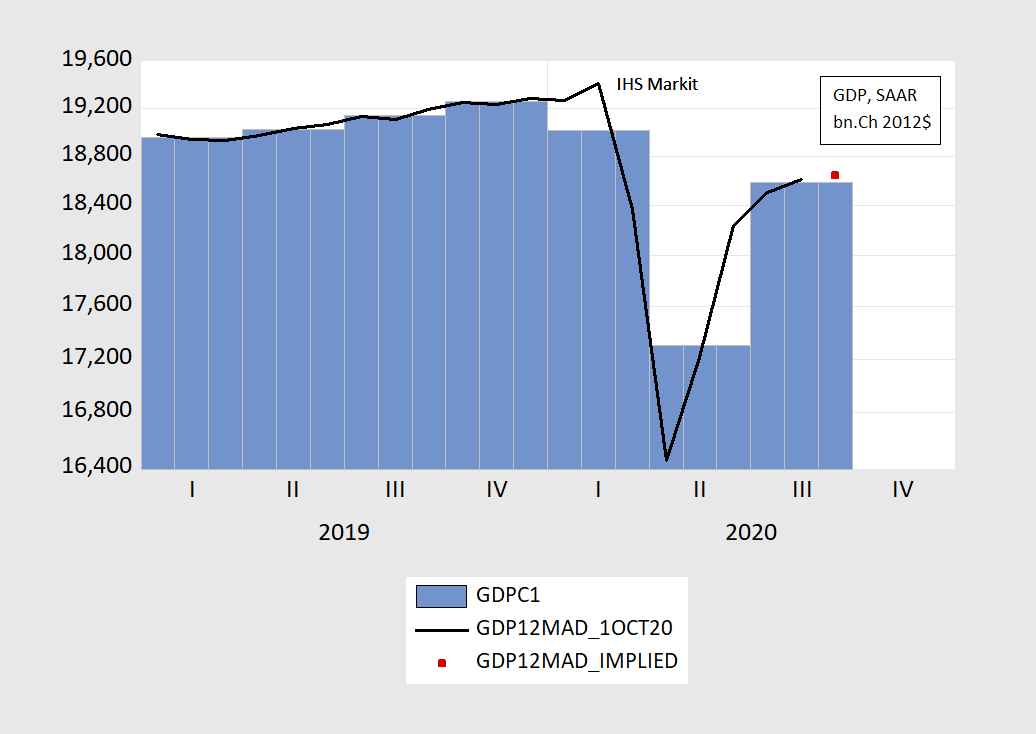
Figure 2: Quarterly GDP (blue bars), monthly GDP (black line), imputed September monthly GDP (red square), all in billions Ch.2012$ SAAR. Source: BEA 2020Q3 advance release, IHS Markit October 1 release, and author’s calculations.
Monthly GDP decelerates from 19% to 7% in July and August to (implied) 2% (SAAR) in September.
All this reinforces my view that — with no fiscal recovery package in sight and Covid-19 infections/hospitalizations surging — we are in for continued deceleration. The V ends here…unless and until a new competent administration is installed.
Droopy v
Menzie, your use of the description of V at the end of this post has to be one of your bigger disappointments to me (of a minute few). I have always appreciated your truthful straight-shooter style. The use of “V” here in this post reminds me of your placating someone calling what amounted to the “deadcat bounce” on a monthly consumption number (May’s) to make a semi-senile old man feel better about saying 2nd Quarter GDP is possibly going to be positive. This is not you Menzie, this is not you.
I drink and say wild things sometimes, my question to you Menzie is, what’s your excuse for the end sentence of this post?? Come on Menzie, you know I’m not in the habit of criticizing you. This is a letdown Menzie. Come on man……. You remember what it was like when you were a young kid and your family was struggling. Come on man,
We are still waiting for your forecast of the DP posttern shape, Moses,
Since you seem unwilling to put up, when will you just shut up?
Moses Herzog: I meant my statement to indicate it’s not going to be a “V”, the right-side upsweep being truncated. That means we are in (what I think I’ve been saying for months) a reverse-radical, possibly even double-dip.
https://www.youtube.com/watch?v=ayfFahVKVA0
That drummer died,similar to bonham (peoplealways feela need tto correct you when you say this drummer Michael Lee doed and go “no it was Bonhma” but both of them died ealry deaths, andf both were great guys and great drummers,or why would thhey have been THERE??
https://www.youtube.com/watch?v=6s-LQUHniWw
https://www.youtube.com/watch?v=REF61Kob2w0
https://www.youtube.com/watch?v=cpBSotov_4k
https://youtu.be/6ekhxIwBdOE?t=292
https://www.youtube.com/watch?v=2Iam0D5gEBg
https://www.youtube.com/watch?v=hHe8QLh4dTs
https://www.youtube.com/watch?v=ubXliC97n0E
https://www.youtube.com/watch?v=cpBSotov_4k
https://www.youtube.com/watch?v=JhASOgRA1SE
https://www.youtube.com/watch?v=_CIE041T954
https://www.youtube.com/watch?v=YbsYc3UNdZ4&list=RDYbsYc3UNdZ4&start_radio=1
https://www.youtube.com/watch?v=r7fMMcPByig
https://www.youtube.com/watch?v=8CdcCD5V-d8
https://www.youtube.com/watch?v=8CdcCD5V-d8
https://www.youtube.com/watch?v=8CdcCD5V-d8
https://www.youtube.com/watch?v=54sEMKGXq5Q
https://www.youtube.com/watch?v=9fapJOEAWc0
https://www.youtube.com/watch?v=UBPdJwibh6A
https://www.youtube.com/watch?v=DwCgn9KoaRM
https://www.youtube.com/watch?v=bdCyEBdUSTE
https://youtu.be/bdCyEBdUSTE?t=244
https://www.youtube.com/watch?v=uJsdxuZyi64&list=RDuJsdxuZyi64&index=1
https://www.youtube.com/watch?v=DHDHEFQqKvw
https://www.youtube.com/watch?v=6WvQxY0txWU
https://www.youtube.com/watch?v=Y_VFVkoIqYQ
https://www.youtube.com/watch?v=pEaGu7_J3oY
https://www.youtube.com/watch?v=kh0exWqvxeI
https://www.youtube.com/watch?v=3BB-PdHTQHg
https://www.youtube.com/watch?v=QUUGDRxJnFU
https://www.youtube.com/watch?v=2s0dHbbGPds&list=PL8D5935EF8A7A0F61&index=2
You know how this goes. If the economy turns south in the fourth quarter, the usual suspects (Bruce Hall, CoRev, sammy, Ed Hanson, etc.) will call it the “Biden recession” just as they call the Great Recession the “Obama recession.”
The recession that started in very late 1981 may have been caused by that tug of war between Reagan’s wreckless 1981 tax cut and Volcker’s overreaction to it but they had to blame it on Jimmy Carter as in those Morning in America commercials. Hey the 1929 stock market crash and the Great Depression was FDR’s fault. Always blame the Democrat – no matter what.
October 30, 2020
Coronavirus
US
Cases ( 9,316,297)
Deaths ( 235,159)
India
Cases ( 8,136,166)
Deaths ( 121,681)
France
Cases ( 1,331,984)
Deaths ( 36,565)
UK
Cases ( 989,745)
Deaths ( 46,229)
Mexico
Cases ( 912,811)
Deaths ( 90,773)
Germany
Cases ( 517,720)
Deaths ( 10,523)
Canada
Cases ( 231,999)
Deaths ( 10,110)
China
Cases ( 85,940)
Deaths ( 4,634)
October 30, 2020
Coronavirus (Deaths per million)
US ( 709)
Mexico ( 702)
UK ( 680)
France ( 560)
Canada ( 267)
Germany ( 125)
India ( 88)
China ( 3)
Notice the ratios of deaths to coronavirus cases are 9.9%, 4.7% and 2.7% for Mexico, the United Kingdom and France respectively. These ratios are high, but have been significantly higher, while falling recently as new cases are rapidly recorded.
https://twitter.com/paulkrugman/status/1322144736224956416
Paul Krugman @paulkrugman
So, if anyone is still impressed by the 7.4% US growth from the 2nd to 3rd quarter — do NOT use annual rates! — the Euro area grew 12.7%. In both cases it’s a partial snapback that still leaves us way down from pre-covid; in both cases rising cases bode very badly for the future
7:54 AM · Oct 30, 2020
“So, if anyone is still impressed by the 7.4% US growth from the 2nd to 3rd quarter — do NOT use annual rates! — the Euro area grew 12.7%.”
Oh wow – this will piss off Bruce Hall. Now he has to find some other means to spin Kelly Anne’s BS.
It will also probably tick off Moses Herzog, who has repeatedly said here that everybody must use SAAR all the time because that is how the US government reports the numbers. Since he is a big fan of Krugman’s, he will be especially unhappy that Paul is doing this probably just to “make a semi-senile old man feel better.” Shame on him, tsk tsk.
“The V ends here…unless and until a new competent administration is installed.”
Respectfully, I don’t think that a new administration will do the trick (however much I’d like it to be so). The yield-curve inversion (generally reliable recession indicator) first signaled recession in June 2019 (monthly data). That was long before the coronavirus ever appeared on anyone’s radar. JMO, but I’m wondering if the recession and coronavirus have more of a coincidental than causal relationship than is widely reported in the media and by pundits? Maybe the economy was much weaker all along but it took a serious stress-test to expose the underlying weakness?
And perhaps what we’re looking at now is, instead of a typical and more-enduring V-shaped recovery, more of a 1980-1982 type of brief recession>>brief recovery>>longer recession condition?
https://fred.stlouisfed.org/series/T10Y3MM
Just a thought.
Sebastian
Sebastian: You might take a look at this post, re: recession prediction and yield curve.
Very helpful, thank-you.:)
Sebastian
https://www.nytimes.com/2020/10/31/opinion/republicans-biden-taxes.html
October 31, 2020
Republicans, Not Biden, Are About to Raise Your Taxes
People making from $10,000 and $30,000 — nearly one-quarter of Americans — are among millions slated to pay more in 2021.
By Joseph E. Stiglitz
The Trump administration has a dirty little secret: It’s not just planning to increase taxes on most Americans. The increase has already been signed, sealed and delivered, buried in the pages of the 2017 Tax Cuts and Jobs Act.
President Trump and his congressional allies hoodwinked us. The law they passed initially lowered taxes for most Americans, but it built in automatic, stepped tax increases every two years that begin in 2021 and that by 2027 would affect nearly everyone but people at the top of the economic hierarchy. All taxpayer income groups with incomes of $75,000 and under — that’s about 65 percent of taxpayers — will face a higher tax rate in 2027 than in 2019.
For most, in fact, it’s a delayed tax increase dressed up as a tax cut. How many times have you heard Trump and his allies mention that? They surmised — correctly, so far — that if they waited to add the tax increases until after the 2020 election, few of the people most affected were likely to remember who was responsible.
Looking at the analyses of the nonpartisan Congressional Budget Office and the Joint Committee on Taxation at the time the December 2017 tax bill was enacted, we see very clearly how different income groups are affected by the Trump tax plan. And it’s disturbing.
The current poverty line for a family of four is $26,200: People with incomes between $10,000 and $30,000 — nearly one-quarter of Americans — are among those scheduled to pay a higher average tax rate in 2021 than in years before the tax “cut” was passed. The C.B.O. and Joint Committee estimated that those with an income of $20,000 to $30,000 would owe an extra $365 next year — these are people who are struggling just to pay rent and put food on the table.
Of course, the poor have never mattered much to the Republican Party, but those on the edge of poverty have been particularly hard hit by the pandemic and the recession its caused, so Trump’s planned tax increases seem especially heartless, and impractical, when you consider that their higher tax payments, while a huge burden for them, will add little to the budget.
By 2027, when the law’s provisions are set to be fully enacted, with the stealth tax increases complete, the country will be neatly divided into two groups: Those making over $100,000 will on average get a tax cut. Those earning under $100,000 — an income bracket encompassing three-quarters of taxpayers — will not….
Joseph E. Stiglitz, a university professor at Columbia University, is a 2001 recipient of the Nobel in economic science.
Neither Trump nor the Senate Republicans worry a bit over what most of us pay in taxes. As long as the mega rich get more tax cuts – MAGA!