Meanwhile, back in the real economy, the employment decelerates. Here’s the current outlook, using some key indicators noted by the NBER’s Business Cycle Dating Committee (BCDC).
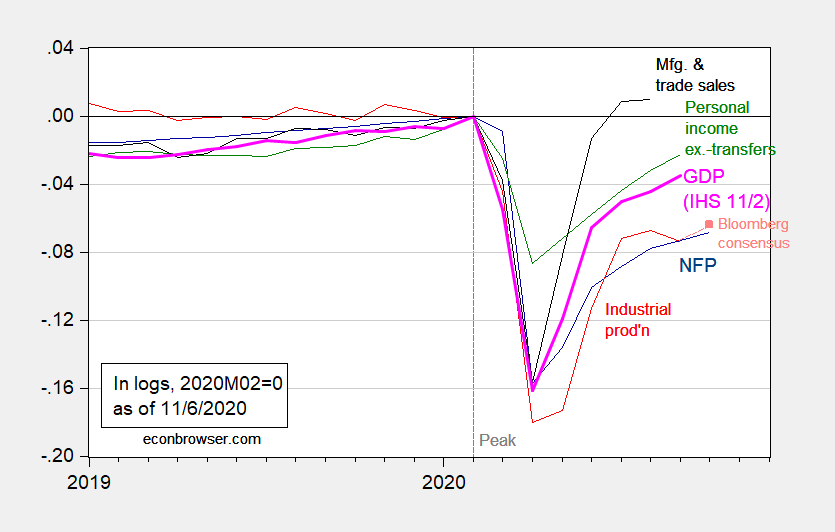
Figure 1: Nonfarm payroll employment (dark blue), industrial production (red), Bloomberg consensus for industrial production as of 11/6 (light red square), personal income excluding transfers in Ch.2012$ (green), manufacturing and trade sales in Ch.2012$ (black), and monthly GDP in Ch.2012$ (pink), all log normalized to 2020M02=0. Source: BLS, Federal Reserve, BEA, via FRED, Macroeconomic Advisers (11/2 release), NBER, Bloomberg, and author’s calculations.
With this employment gain (at 637K above the Bloomberg consensus of 600K), NFP remains 6.6% below the NBER peak at 2020M02 (6.8% in log terms).
NFP will be suppressed until the pannie ends. Nothing will change that until then.