The employment release confirms a deceleration in employment, presaging deceleration in the other macro indicators. Government employment is down, and not solely because of the winding-down of the decennial Census. Rather, state and local government employment is declining, and is now 6.8% below NBER peak level.
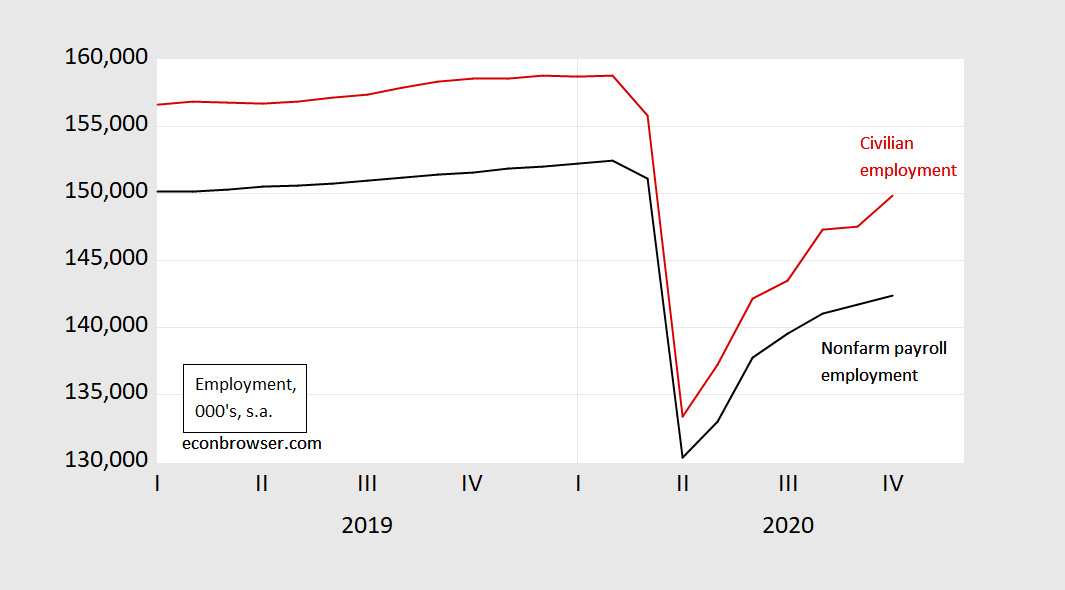
Figure 1: Nonfarm payroll employment (black), civilian employment (red), both in 000’s, s.a.. Source: BLS via FRED.
Civilian employment actually increased m/m in October, but that series is particularly volatile. Focusing on the nonfarm payroll number, m/m growth (not annualized, in logs) has fallen from 7% to 6% to 3% to 2%, from July to October.
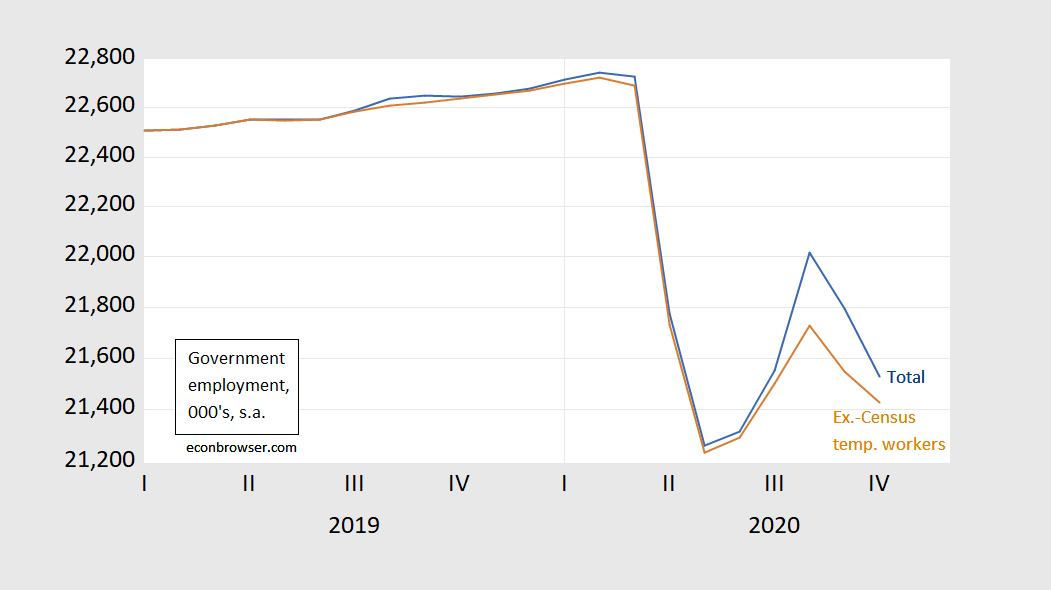
Figure 2: Government employment (blue), government employment ex.-Census temporary workers (brown), both in 000’s, s.a. Source: BLS via FRED, BLS, and author’s calculations.

Figure 3: Government employment at state and local levels (teal), in 000’s, s.a. Source: BLS via FRED, and author’s calculations.
In the wake of the 2007-09 recession, restrained government spending at state and local levels accounted for a lot of the slow recovery. We are at risk of repeating that sorry story, unless the Federal government provides further fiscal aid to the states and localities.
Just another indicator that certain policymakers, economically speaking, haven’t learned anything beyond the dogma of the eighties, and/or just don’t care about the economic suffering of us little people. Le plus ca change …
Was sad to read about this today. Will try to see if I can get my local public library to put her book on the shelves if they don’t already have it. What a great lady:
https://www.nytimes.com/2020/11/04/business/economy/helen-ginsburg-d.html