The CPI came in slightly above Bloomberg consensus (2.6% vs 2.5%), and above the WSJ April survey consensus (shown below).
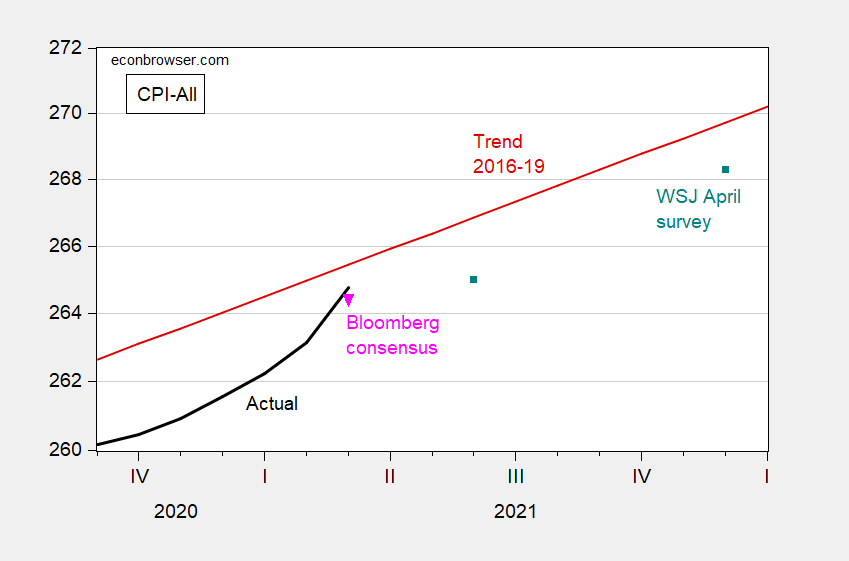
Figure 1: CPI All urban (blue), Bloomberg consensus as of 4/12 (pink inverted triangle), WSJ April survey mean implied by forecasted inflation rate (teal square), and 2016-19 trend line (red), all on log scale. Source: BLS via FRED, Bloomberg, WSJ April survey, and author’s calculations.
In other words, the March release is above the path implied by the WSJ survey that had only been taken a week or so earlier.
That being said, there is barely a blip in markets showing an increase in inflation expectations.
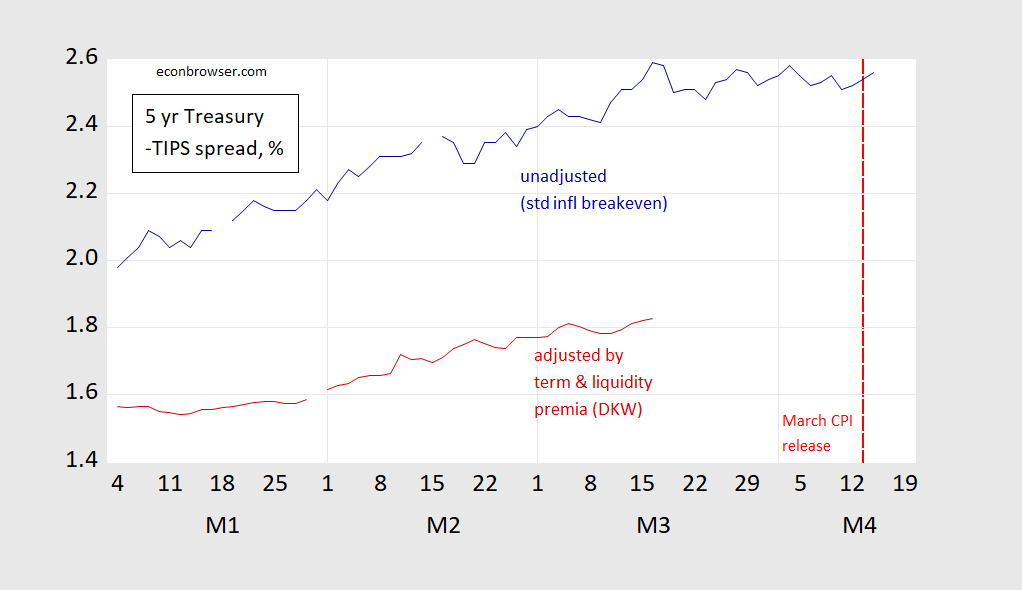
Figure 2. Five year inflation breakeven calculated as five year Treasury yield minus five year TIPS yield (blue), five year breakeven adjusted by term premium and liquidity premium per DKW, all in %. Red dashed line at 4/13, CPI release date. Source: FRB via FRED, KWW following D’amico, Kim and Wei (DKW), and author’s calculations.
Torsten Slok (Apollo Global Management) writes today:
Inflation for March came in at 2.6%, and the most likely scenario is that inflation in the second half of this year will move below 2% again. That is also what the consensus expects.
But there is a 25% probability that we will see a substantial overshoot where inflation will be above 2.2% for the rest of 2021.
One particularly troubling aspect of the inflation outlook is the fact that a very high number of companies are saying that they are planning to raise prices of the products they are selling
2.2% inflation for the year? Oh no! Hyperinflation – we are all doomed. Oh yea – I need to turn off Faux News as well as Stephanie Ruhle.
Any thoughts about the NY Fed Underlying Inflation Gauge?
April 2021: The New York Fed Staff UIG Measures:
The UIG “full data set” measure for March is currently estimated at 2.2%, a 0.5 percentage point increase from the previous month.
The “prices-only” measure for March is currently estimated at 2.6%, a 0.3 percentage point increase from the previous month.
The twelve-month change in the March CPI was +2.6%, a 0.9 percentage point increase from the previous month.
-For March 2021, trend CPI inflation is estimated to be in the 2.2% to 2.6% range. The width of the range is smaller than in February, with both bounds higher than they were in February. Note that the COVID-19 outbreak continues to impact data collection for the CPI release.
What evidence suggests the model is useful?
Compared with core inflation measures, the UIG:
• can use information about
subcomponent price changes from
the cross-sectional and time-series
dimensions;
can consider data beyond
subcomponent price changes
and incorporate a large number of
additional series;
has outperformed core inflation
measures in tests of forecast
accuracy over different time horizons;
provides a more timely and accurate
signal of turning points in inflation.
4. How do we interpret the output of the UIG model?
The UIG provides a current estimate of trend
inflation from 1995 through the latest monthly
CPI data release.
NY Fed Underlying Inflation Gauge link
https://www.newyorkfed.org/research/policy/underlying-inflation-gauge
Where I get station gas, it is nearly always cheaper than the national average. That being said, I can get gas now for $2.35 a gallon. I don’t think we’re going to be seeing “Princeton”Kopits’ $4.00 at the pump prediction any time in the year 2021, assuming no MidEast located wars.
Menzie, it may be a problem on my end but I can only see your KWW graph when I click inside of the box. Before I click on it, all I can see is largely blank with a small blue square in the center with a white colored question mark. I can get the graph when I click on it though, so it’s just a “user friendliness” kind of issue.
You know I’m a Torsten Slok fanboy Menzie, so thanks for including the quote snippet from Slok.
If Princeton Steve’s forecast of $100 a barrel for oil turns out, you will be paying $3.50 per gallon. Since Stevie is always saying oil prices keep rising, let’s check with FRED:
https://fred.stlouisfed.org/series/DCOILWTICO/
Price fell below $60? FRED must be some sort of commie liar. Fake news!
If you’re figuring that out based on my local prices that $3.50 may be very accurate, but I am thinking if it’s national that might very well push it over $4 on a national basis. I’m only doing the rough math in my head. But any way you slice it, outside of the context of a war, $4 at the station pump (a number Kopits quoted as credible in the relative near term, he was implying by December, or certainly within a year of his comment, is farcical.
Let’s put it this way, it would take a kind of “bidding up”, BItcoin style, of the price to bring that anywhere near the realm of possibility.
I have noted the following formula which is the lay person’s version of the great work by Dr. James Hamilton:
Price of gasoline/gallon = $1 + barrel price of oil/40.
The $1 is the combined effect of excise taxes, refinery margins, and distributors margins on a national average (likely less than $1 for your neighborhood). At the current oil price = $60/barrel, this comes to $2.50 per gallon of gasoline. My $3.50 assumes Princeton Stevie’s dumb forecast. To get to his $4 a gallon, the oil price would have to double from its current level.
All a simple calculation once one digests the excellent work from Dr. Hamilton. I have noted this many times to Princeton Steve but he still does not get it. And he claims to be an expert consultant for this sector????
Menzie –
You note that Slok states
“But there is a 25% probability that we will see a substantial overshoot where inflation will be above 2.2% for the rest of 2021.”
But an “overshoot” relative to what? Would 2.2% overshoot the committee’s 2% AIT framework? Do we know the averaging window being used by the committee? I don’t think this has been made clear.
On a quarterly basis, which is less noisy, prices rose 1.9% in 1Q21 versus 2.0% in 1Q20. Price increases have been fairly constant since 1Q17, never exceeding 2.7% over that period on a quarterly basis. https://fred.stlouisfed.org/graph/?g=gJ4#0
Jay Powell knows what he is doing.
Re: your last statement…
yes, as long as Chair Powell has Clarida by his side, he should be good 😉
@ Menzie
Menzie, are you taking radio requests for songs from your most degenerate, but ever-loyal reader?? On May 12, could you put up a post which is a very simple (simple for you, not me) graph?? Could you put 3 overlapping graph lines?? Your KWW number (the adjusted obviously), The Cleveland Fed inflation Expectations graph, then the actual inflation numbers. Then a separate graph, right underneath that graph, with some kind of “average” of the the Cleveland Inflation Expectations graph and your KWW adjusted graph (together as one graph line) overlapping the most “up-to-date” graph on actual inflation?? I was thinking it might prove interesting.
As I was reviewing some battle between the Spanish tax authorities and the almighty evil empire known as Microsoft, I decided to check its 10K to see about its worldwide tax rate which is basically 16%. The Cliff Notes version of how they got their rate this low goes like this. TCJA did two nice things for them: (1) top line rate on US income = 21%; (2) FDII lowers this 21% to 20%.
But over half of their income is sources with their Irish affiliates where the tax rate is only 12.5%.
Now I thought TCJA was going to encourage companies like Microsoft to source more of them income in the US. It looks like this goal failed at least with the mighty evil empire known of Microsoft.
I’m hoping Team Biden scraps all aspects of TCJA including FDII, GILTI, and decides to raise the tax rate to 28%. But this is not enough – the government has to go after good old fashion transfer pricing abuse. Of course I just pi$$ed off the mighty Microsoft. But hey I never liked Bill Gates anyway.
https://www.bls.gov/cpi/
In absolute terms, most price increases have not caused significant anguish among consumers. The increase in energy costs we are seeing have some large percentage increases from last year, but that’s because prices, especially gasoline, were very depressed. I could buy regular grade gasoline at a nearby Costco for less than $1 per gallon. Now it is around $2.45. Big increase, but still relatively low versus historical levels.
Natural gas, fuel oil, and some electricity prices have also increased noticeably in some areas.
The big increase in prices has been in homes and used vehicles, so if you’re shopping in those markets “inflation” seems extraordinary. A simple 2ft. 2″x4″x8′ piece of pine for framing costs nearly $7 which is almost twice what it was a few years ago. So, selectively, there are prices increases that shriek of “inflation”. But overall, inflation seems tame.
A sensible post. Now admit it – where have you caged Bruce Hall so he cannot write his usual BS?
Is it really a surprise?
For people who are real economists, and care for another type of analysis, check this out:
https://johnhcochrane.blogspot.com/2021/04/inflation-levels.html
https://johnhcochrane.blogspot.com/2021/03/inflation-outlook-at-nro-1970s-all-over.html
Manfred: See also John Cochrane’s prognostications on how the economy could adjust on its own (i.e., w/o tons more fiscal support), back a year ago. https://johnhcochrane.blogspot.com/2020/04/what-shape-recovery.html
Cochrane is a finance guy, not an economics guy~~~and he’s embarrassing his finance brethren when he attempts economics.
Now does Cochrane have a degree in Economics?? Well that’s what his CV says, but I have to tell you, neither his hardwiring or his brain’s “software” speaks to me of a man who knows jacksh*t about economics.
Moses Herzog: John Cochrane has a PhD in economics, and has 13553 google scholar citations since 2016. I’ve cited many of his papers (albeit earlier ones). So he “knows” a lot. I just don’t agree with much of what he writes which relates to macro and macropolicy (much like my issues with Fama).
I want to ask you a question which sounds like or reads like I am being a smart-aleck, or perhaps taking a swipe at economics. I am not, I respect the profession in a general way. But……. I ask the following question in a very straight and earnest matter. What exactly would be the point in getting a PhD in economics, for some individuals if they are writing a long screed in April-May 2021 about being “on the verge of reliving 1970s inflation”?!?!?!?!? Now you can say he left himself some”outs” in the blog post. But what Cochrane actualy did was pulled “a Barkley Junior” making an outlandish prediction, with every intent of saying “see I was right, and I was the only one, buhduh buhduh buhduh buhduh to predict this” but leaves himself 2 sentences as “outs” where he can later say “well, I never said thaaaaaaaaat“. He’s making a farcical prediction, but doesn’t want to face the music later when we find out inflation hasn’t averaged over 3% after he’s making equivalencies in April 2021 to a decade with a 6.8% inflation rate.
Moses Herzog: The point of getting a Ph.D. is to know what you don’t know for sure. Then people’s character gets in the way of incorporating that lesson into their (popular) writings.
He does know a lot but it gets lost in some of his blog posts – alas.
Then again Dr. John Taylor used to know a lot but somehow all that Bush43 Kool Aid has turned a prominent macroeconomist into a right wing shrill.
Maybe we should be thankful Trump hired few real economists given all the damage that would have done to our profession.
Fama is a good finance guy but why is he opining on macroeconomics?
John Cochrane: “we’re on the verge of reliving 1970s inflation.”
Beings that Menzie does not like vulgarity used on this blog I will not say what a ______ _______ ________ I think John Cochrane is. After that quote, circa 2021, the man should never be allowed in an economics classroom until the day he croaks. I thought “Princeton”Kopits was bad. WOW. I may send an email to Menzie, making a special request if exceptions can be made on vulgarity if the person’s commentary is dumb enough.
I had to review what I wrote about this latest Cochrane nonsense as my mom really hates profanity. Thankfully I restrained – this time. You are right – his post was absurd but then that is what Manfred thinks is real economics.
Oh gee – I just wasted a bunch of time reading 3 Cochrane blog posts hoping to see some real economics. I did see some data but for the most part I saw a lot of Cochrane’s usual ranting pretending anyone not as right wing as he is is not a real economist.
I have a question for Manfred – did you get your degree in babble speak because Cochrane’s rant was your usual NRO quality nonsense?
Menzie,
Oh my, a reminder that it was Cochrane who pushed that weird line that the Obama recovery was “L-shaped,” when in fact it showed a steady if not rapid rise, not a flat line after the bottom, which is what I think an L-shape ought to be. But then we have had a lot of wrangling here about what letter shapes are what.
Funny thing is that about the time Cochrane wrote that I think most of us here, including at least me and you, Menzie, agreed with Cochrane’s basic argument, if not his selection of the relevant letter. I certainly thought we would see precautionary saving and so a slow increase after the bottom to be followed later by a more rapid increase, whatever letter that is modeled by, not an L. I was wrong.
Again, although Moses Herzog thinks he is proving something here, in fact I was he first one here to call what did happen: a rapid bounceback, which I noted when the May consumption numbers came out showing a record monthly gain. That was when I first said we were likely to see something looking lke a V for a while before it would flatten, which is exactly what we got, although you, Menzie, and Not Trampis, insist one cannot call it a V unless it keeps gong at the same rate all the way back up to where it started, which I never said it would.
Of course, Moses never did accept that it looked like a V for awhile before it flattened out later last year, although he continues not to tell us what letter he said it would be.
As it is, even though I thought in early April last year it was reasonable to expect a slow bounceback due to the precautionary saving that did not happen, I always thought Cochrane’s calling it an “L” was ridiculous, and always thought this was part of an effort to make Obama look bad, in short a politically motivated call, of which Cochrane makes many.
Regarding Cochrane as an economist in fact he has about 43,000 GS cites, a substantial number, more than Menzie or me, but less than Jim Hamilton, and not much more than a tenth of his Nobel Prize winning father-in-law, Fama.
Looking at his professional stuff, it is mostly quite competent, and there are a few ideas he has played a major role in developing, especially integrating production theory, consumption theory, and finance, if under a fairly narrowly defined rubric. But unlike his father-in-law, none of this will get him a trip to Stockholm to shake a royal hand there.
Curiously enough his most cited work at over 6000 is his grad textbook on Asset Pricing, which is indeed highly influential. Funny thing is I have looked at it quite closely, although I have not looked at the latest edition. Maybe he has imprved it. But the edition I saw had nothing about kurtotic or fat tail returns. Those words did not appear in the index at all, which I found really weird since most finance practitioners are fully aware that most financial returns are kutotic and some rival taxts do deal with these matters, if in some cases not too extensively. But he did not at all, which I found really weird since his father-in-law dealt with such matters going back to his original work on Mandelbrot’s stuff.
I have heard that Cochrane says he does not need to have it in his book because “everybody knows financial returns have fat tails.” I do not know if that is a real quote (or maybe it is from Fama), but if it is from him I find it even weirder that he at least used to completely avoid the topic in him most cited work, his supposedly “authoritative” textbook. Talk about a joke. Gag, this is enough to make even Moses Herzog look almost on top of things.
Regarding the link that Manfred put here from Cochrane, two points, besides noting that his general argument is not really all that different from what we have heard out of Larry Summers, with Olivier Blanchard quietly supporting, except that Summers pointed to the late 1960s for his worry while Cochrance points at the 1970s as when scary inflation took off that we are now supposed to worry about maybe appearing.
One thing he mentions is oil prices, which in fact are moving up a bit again. But in the 1973 crude oil prices basically quadrupled and oil was also a much more significant input into our economy than it is today. All those oil price increases back then and later did lead to a lot of innovation and replacement so that we are now a lot less dependent oil than we were back then. And even if oil prices are moving up some, they remain below $70 per barrel. Even if Steven Kopits’s forecast of 4100 were to come to pass, which not too many are thinking will come to pass, that would not even be a doubling, indeed more like a 50% increase. We saw a peak in nominal terms back in 2008 at $147 per barrel for WTI, A quadrupling of prices would have nominal prices go way above that, like well over $200 per barrel. Not even Kopits is predicting that nor anybody else i am aware of out there. So this comment by Cochrane looks to be completely ridiculous. No way we are going to see anything like what happened in the early 1970s with oil prices soon, and if we did, it would probably not have the impact on the US economy that what happened in the early 1970s. I also note that Summers has raised the spectre of “stagflation,” that bugaboo of the 1970s. But to the extent oil prices were central to that, we are not likely to see anything like that anytime soon.
Another element that is missing now that was in place in the early 1970s, and is not mentioned by Cochrane, much less Summers or Blanchard to my knowledge, is that back then organized labor had much more power to demand wage increases than it does now. Back then many observers including even quite a few economists saw cost-push wage-price spirals as elements important in maintaining or even increasing entrenched inflation. That view was dismissed by monetarists then, and Cochrane is an heir of that view, but I think it is reasonable to look now to see if any short-run inflation spike now would lead to a push for substantially higher wages that would trigger further price increases that might lead to a short-run spike in inflation to become entrenched as happened in the 1970s. It is pretty clear that the power of organized, much less disorganized, labor to carry out such demands for higher wage increases due to higher costs of living as went on back then. This mechanism simply does not seem to be there, and even if it was, it usually takes a somewhat sustained increase in the rate of inflation to bring about such demands, not short-run price increases tied to temporary supply constraints.
Finally, a point that I find annoying in Cochrane’s post, and that I think may be part of what is behind both Moses and pgl wanting to use vulgarity in response to it, is the weird posturing by Cochrane that somehow he has great insight because he foresaw that when price spikes would come this year he knew such would be described as temporary by the administration. The problem with this pomposity on his part is that the people at the Fed has been making exactly this forecast for several months for now, a temporary increase in the rate of inflation this year associated with rising demand bangs against pandemic-induced supply constraints such as those present now for some time in global shipping even prior to the weird Suez Canal incident. I noted this back in January here after Jim Bullard of the St. Louis Fed came out with this forecast, noting that he has long been very influential at the Fed, although I think our Moses got all in a huff when I pointed this out. But it was not all that much later that indeed the entire FOMC led by Chair Powell adopted this view and publicized it. So saying that when the inflation rate did rise this year the administration would repeat this Fed forecast does not take all that much brilliance, although Cochrane is now preening about his having picked up on this. Gag.
So, Manfred, sorry, this post by Cochrane is not all that insightful and simply reinforces for me that reading his posts on any regular basis is just a waste of time, even though he does have a fairly impressive record of having been cited for his academic publications.
You call that “analysis”? OK these rants were of slightly higher quality than the intellectual babble we generally find at National Review but only slightly. I guess your degree is in babble speak because there was no economic modeling in any of the hysteria from Cochrane.
I wasn’t aware that the Hoover Institute has ever employed real economists. When did that change?
(Make soft pitches, do expect them to be hit…)
Careful. Milton Friedman spent some of his latter days at Hoover. But other than that – it is only one step above writing for the National Review.
Bruce Hall rarely provides us data worth anything but his latest is something you and Cochrane might want to pay some attention to:
“In March, the Consumer Price Index for All Urban Consumers rose 0.6 percent on a seasonally adjusted basis; rising 2.6 percent over the last 12 months, not seasonally adjusted. The index for all items less food and energy increased 0.3 percent in March (SA); up 1.6 percent over the year (NSA).”
Core inflation is only 1.6% and your boy Cochrane calls this the beginning of hyperinflation???
the pop in the CPI should hardly be a surprise…PPI final goods have been up 1.4, 1.4 and 1.7 percent over the last 3 months; final demand services has risen 1.3, 0.1, and 0.7 percent over the same period….
more where that is coming from:
intermediate goods up 1.7%, 2.7, 4.0% over 3 months
unprocessed goods: up 3.8%, 4.3% and 9.3% over 3 months and now up 41.6% YoY
(everything except coal, gravel and crushed stone up double digits)
intermediate services: up 1.3%, 0.7% and 0.4% over the last 3 months
I have long suspected that Bruce Hall is really Tucker Carlson and this confirms it:
https://www.mediamatters.org/fox-news/tucker-carlson-speculates-covid-vaccine-doesnt-work-and-theyre-simply-not-telling-you
Tucker looks at the advice that we continue wearing masks even after we received the vaccination and draws the inference that the vaccines do not work. Yes it is stupid claim but if his stupid viewers buy it – more people will needlessly die.
https://news.cgtn.com/news/2021-04-09/China-s-CPI-up-0-4-pct-in-March-ZjsXW5NwOs/index.html
April 9, 2021
China’s March factory gate prices jump on rising commodity prices
China’s producer price index (PPI), a measure of factory gate prices, jumped 4.4 percent in March due to rising international commodity prices, particularly prices for metals and oil, and ramped-up domestic production and investment, data from the National Bureau of Statistics (NBS) showed on Friday.
March PPI data beats a median forecast of a 3.5 percent rise polled by Reuters economists.
“Unlike previous cycles, this recent rise in PPI inflation was mainly the result of surging global commodity prices, which are mainly being driven by monetary easing and huge fiscal stimulus (especially in the U.S.) outside of China,” Lu Ting, Chief China Economist at Nomura told CGTN.
Affected by an increase in the price of imported iron ore, the price of ferrous metal smelting and rolling processing industry surged a yearly 21.5 percent, NBS data showed.
https://news.cgtn.com/news/2021-04-09/China-s-CPI-up-0-4-pct-in-March-ZjsXW5NwOs/img/574d2e89fc3d47a4974393d9aa096cce/574d2e89fc3d47a4974393d9aa096cce.jpeg
“International crude oil prices continued to rise, driving the increase in domestic oil-related industries,” said Dong Lijuan, a senior statistician with the NBS.
The oil and natural gas extraction industry rose by 23.7 percent in March year on year, while the chemical raw materials and chemical products manufacturing industry rose by 11.4 percent from the year before.
“Yet the cost increase in raw materials was mostly borne by midstream assembly manufacturers and downstream consumer goods factories. Particularly, prices of durable goods like cars even dropped,” Wang Dan, chief economist at Hang Seng Bank (China) told CGTN.
Wang pointed out that upstream raw material processing factories saw profit surge while mid- and low-stream manufacturers’ profit was significantly squeezed. “This is why the PPI for means of production jumped by 5.8 percent, while that for consumer goods only rose by 0.2 percent.”
“Such profit squeeze will bring additional liquidity pressure for mid- and low-stream manufacturers when monetary policy is tighter than the last year,” she said.
Wang expected that targeted monetary expansion from the second quarter will ease the debt burden for small producers.
https://news.cgtn.com/news/2021-04-09/China-s-CPI-up-0-4-pct-in-March-ZjsXW5NwOs/img/7028bbc6738d456cafa18ba6660b4e11/7028bbc6738d456cafa18ba6660b4e11.jpeg
China’s consumer price index (CPI), a key gauge of retail inflation, rose 0.4 percent from a year earlier in March, exceeding economists’ expectations of a 0.3 percent rise polled by Reuters.
“The still-low CPI inflation in March was largely due to the decline in pork prices,” Lu said….
What strikes me as important is the way in which the Chinese expressly focus on sectors in limiting producer or consumer price inflation. So that the recent limitation of pork supply and price increases was countered with drawdowns of a national pork reserve as well as by a broad-scale reorganization of domestic pork production with a heavy technology emphasis. The quickness of recovery in pork production has surprised me, but I have seen such successful technical interventions before.
ltr,
Oil has been doing a stop-go routine. They were moving up sharply for awhile, fitting with the prediction of Steven Kopits, which these figures reflect. But then they stalled and crude oil prices even pulled back for awhile after Brent grazed $70 per barrel down into the low 60s, with WTI even slipping below 60. But in the last two days they have suddenly been on the move again with various commentators now calling for them to go up more noticeably.
We shall see.
https://fred.stlouisfed.org/graph/?g=r9NV
January 15, 2020
Price of Oil, 2020-2021
https://fred.stlouisfed.org/graph/?g=nYqO
January 15, 2018
Price of Oil, 2017-2021
https://gabriel-zucman.eu/files/SaezZucman2021EP.pdf
April 11, 2021
A Wealth Tax on Corporations’ Stock
By Emmanuel Saez and Gabriel Zucman
Abstract
We propose to institute a new tax on corporations’ stock shares for all publicly listed companies headquartered in G20 countries. Every year, each company would have to pay 0.2 percent of the value of its stock in taxes. As the G20 stock market capitalization is around $90 trillion, the tax would raise approximately $180 billion each year. Because stock ownership is highly concentrated among the rich, this global tax would be progressive. The tax could be paid in-kind by corporations (by issuing new stock) so that the tax does not raise liquidity issue or affect business operations. In today’s globalized and fast-moving world, companies can become enormously valuable once they establish market power, even before they start making large profits (e.g., Amazon and Tesla). This tax would make them start paying taxes sooner. The tax could be enforced by the securities commissions in each country which regulate publicly traded securities and already charge fees on stock issuance and transactions.
Different but with a similar purpose as Dean Baker’s proposal to have the government own say 25% of this corporate stock.
https://www.cepr.net/instead-of-taxes-make-corporations-give-the-government-stock/
April 10, 2017
Instead of Taxes, Make Corporations Give the Government Stock
By Dean Baker – Los Angeles Times
President Trump and Congress will soon take up the job of reforming the tax code, with particular attention to corporate taxes. Since a substantial portion of the corporate income tax is paid by wealthy shareholders, many of us are concerned that “reform” actually means reducing the tax burden for the 1% — and leaving a larger burden for the rest of us.
But the need for true reform is real. Although the corporate tax rate is 35%, companies generally pay around 23%. Giant loopholes save companies money, deprive the government of money, and create money for people in the tax avoidance industry.
Exotic schemes to game the system are constantly in the news.
Take, for example, the corporate inversion strategy, in which a U.S. company arranges to be taken over by a foreign company in order to eliminate its liability on overseas profits. These takeovers generate large fees for the accountants and lawyers who engineer the process without improving the broader economy.
“Dead peasant” insurance policies, made famous by the documentarian Michael Moore, are another example. In that scheme, huge companies like Wal-Mart take out insurance policies on the lives of front line workers, such as checkout clerks, to smooth out their profit flows and reduce their tax liability. If a worker dies, the company gets the payout, not the individual or his family. Someone undoubtedly got very rich dreaming up dead peasant policies but, again, this financial innovation does not contribute to economic growth.
Perhaps the greatest scheme of all is the private equity industry, which loads firms with debt. Because the interest on that debt is tax deductible, private equity firms can make large profits even if they’ve done nothing to improve a company’s performance. Incidentally, many of the richest people in the country made their fortune in private equity, including folks like Mitt Romney, Pete Peterson, and many other prominent billionaires or near-billionaires.
If the tax reformers are serious, and I hope they are, here’s one simple way to largely eliminate the gaming opportunities that have made these people rich….
“The tax could be enforced by the securities commissions in each country which regulate publicly traded securities”
It is a good idea but there could be ways to avoid.
Pay out a lot in dividends now and financing the assets with a ton of debt as this is a tax on equity.
Migrating tax domicile out of the G20 (think corporate inversions).
Take the corporation private. Even if the rule applied anyway, we would have controversies on estimating the fair market value.
All of this could be managed I guess but it would complicate matters.
Parenthetically – as I’m sure most of you know, the most mentioned price of oil is based on West Texas Intermediate; a light sweet crude that is considered very high quality.
While using WTI (and Brent) as a benchmark may yield a rough idea of demand by the wealthiest customers. It is a bit like using the price and sales of say BMW’s 5 series as the benchmark for auto sales in general.
In other words, out in the real world, most folks buy relatively crappier but cheaper oil – and that does affect balances sheets…
More John Cochrane “wisdom” circa April 6, 2020:
“I have bad news. The government is also a limited resource. We cannot go on for months on end with the government paying half the bill of everything. Just who is buying all those government bonds? With what income? A trillion dollars a month adds up.”
https://www.cnbc.com/2021/04/15/us-bonds-treasury-yields-dip-ahead-of-jobless-claims-retail-sales.html
http://feedproxy.google.com/~r/zerohedge/feed/~3/nqBf6mvNeEY/record-jpmorgan-bond-offering-2x-oversubscribed
Gosh gee, who is going to buy those bonds??? A year and 9 days after Cuckrane wrote that crap, we’re all in complete bewilderment “who will buy the bonds??”
Krugman quotes this in his latest free newsletter. Would LOVE to hear anyone’s thoughts on it, including our benevolent blog hosts’ thoughts:
https://www.atlantafed.org/research/inflationproject/stickyprice/