Here’s a time series plot of 12 month moving averages of monthly global temperature anomalies for the northern hemisphere, both for land and ocean (blue) and land (red), (in degree C). Note: June is not included…
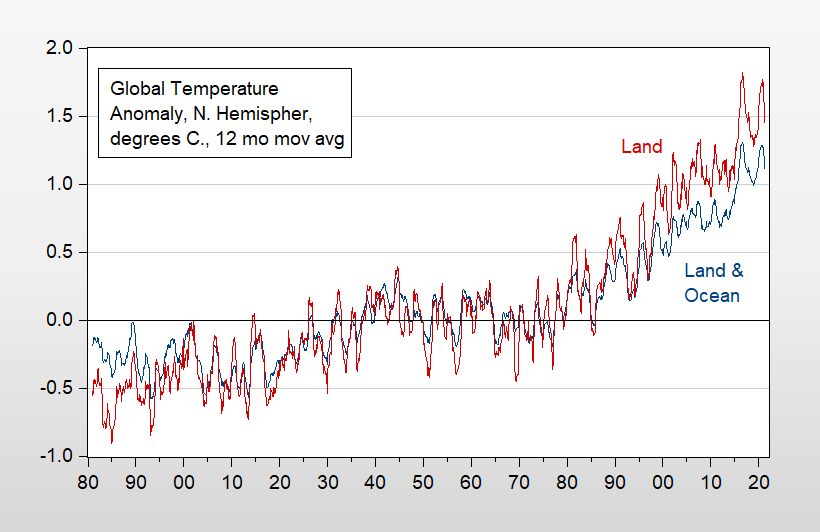
Figure 1: Global Temperature Anomaly for Northern Hemisphere, land and ocean (blue), and land (red), in degrees Celsius, 12 month moving average (through May 2021). Source: NOAA NCDC, and author’s calculations.
I expect the usual suspects to weigh in on how this is immaterial (CoRev, Bruce Hall, Steven Kopits), although some of the other skeptics of global climate change and/or anthropogenic sources (tj, cthomson, Ricardo aka Dick aka DickF) have seemingly dropped off the world.
“I expect the usual suspects to weigh in on how this is immaterial (CoRev, Bruce Hall, Steven Kopits), although some of the other skeptics of global climate change and/or anthropogenic sources (tj, cthomson, Ricardo aka Dick aka DickF) have seemingly dropped off the world.”
(1) I patented the term Usual Suspects; and
(2) This post will probably bring them roaring back!!!
I dunno. As Powell says, they have worked so long to finally get up to the target rate that they are going to let it run hot for a while to balance out. It’s transitory!
There’s got to be another HIATUS! just around the corner.
Satellite puts us back at late 1990s levels.
https://www.drroyspencer.com/wp-content/uploads/UAH_LT_1979_thru_June_2021_v6.jpg
Notice that you’re looking at Version 6.0. Are you familiar with how UAH “connects” satellite data from previous versions? I’d rather watch a butcher make sausage. And oh by the way, most of us don’t live in the lower atmosphere. Most of us live on the surface.
A problem that is well known, but draws remarkably little policy concern is the excessive use of water for agriculture in California. There are repeated articles in the likes of the New York Times on the overuse of aquifer water and a mix of crops that is especially water intensive with evidently little development of infrastructure designed to add to water supplies. Water prices go up enough, and farmers grind up almond trees but keep growing rice. I have no understanding of the matter other than the lack of planning sense.
https://www.nytimes.com/2021/06/28/climate/california-drought-farming.html
June 28, 2021
It’s Some of America’s Richest Farmland. But What Is It Without Water?
A California farmer decides it makes better business sense to sell his water than to grow rice. An almond farmer considers uprooting his trees to put up solar panels. Drought is transforming the state, with broad consequences for the food supply.
By Somini Sengupta
ORDBEND, Calif. — In America’s fruit and nut basket, water is now the most precious crop of all.
It explains why, amid a historic drought parching much of the American West, a grower of premium sushi rice has concluded that it makes better business sense to sell the water he would have used to grow rice than to actually grow rice. Or why a melon farmer has left a third of his fields fallow. Or why a large landholder farther south is thinking of planting a solar array on his fields rather than the thirsty almonds that delivered steady profit for years.
“You want to sit there and say, ‘We want to monetize the water?’ No, we don’t,” said Seth Fiack, a rice grower here in Ordbend, on the banks of the Sacramento River, who this year sowed virtually no rice and instead sold his unused water for desperate farmers farther south. “It’s not what we prefer to do, but it’s what we kind of need to, have to.”
These are among the signs of a huge transformation up and down California’s Central Valley, the country’s most lucrative agricultural belt, as it confronts both an exceptional drought and the consequences of years of pumping far too much water out of its aquifers. Across the state, reservoir levels are dropping and electric grids are at risk if hydroelectric dams don’t get enough water to produce power.
Climate change is supercharging the scarcity. Rising temperatures dry out the soil, which in turn can worsen heat waves. This week, temperatures in parts of California and the Pacific Northwest have been shattering records.
By 2040, the San Joaquin Valley is projected to lose at least 535,000 acres of agricultural production. That’s more than a tenth of the area farmed.
And if the drought perseveres and no new water can be found, nearly double that amount of land is projected to go idle, with potentially dire consequences for the nation’s food supply. California’s $50 billion agricultural sector supplies two-thirds of the country’s fruits and nuts and more than a third of America’s vegetables — the tomatoes, pistachios, grapes and strawberries that line grocery store shelves from coast to coast.
Glimpses of that future are evident now….
http://www.xinhuanet.com/english/2021-07/04/c_1310042779.htm
July 4, 2021
China’s water-saving irrigation area reaches 37.8 million hectares
BEIJING — China’s water-saving irrigation area had reached 567 million mu (about 37.8 million hectares) by the end of 2020 amid water-saving efforts in agricultural production, an official said.
High-efficiency water-saving irrigation measures, such as sprinkler and pipeline irrigation, had been adopted at 350 million mu of land as of last year, Chen Mingzhong, an official with the Ministry of Water Resources, said. He announced this at a water-saving forum Saturday.
China’s effective irrigation area has grown from 240 million mu in 1949 to 1.04 billion mu at present, making it the country with the largest irrigation area in the world, said Chen.
The irrigated land, which accounts for about 50 percent of China’s arable land, produces 75 percent of the country’s grain and over 90 percent of its cash crops, Chen said.
Chen also stressed the important role of water-saving irrigation in maintaining China’s agricultural water consumption’s general stability over the past 30 years, considering the expansion of irrigation areas, the rise of the probability of irrigation, and the steady increase of grain output….
Yes, the fact that the US grows rice at all is a testament to distortions sanctioned by “free” trade agreements, which leave US agriculture highly protected with high subsidies. But I’ll probably get labeled “protectionist” for pointing out flaws in the corporate-friendly managed trade agreements so widely celebrated by the usual suspects. Of course, the time to complain was 25 years ago, but the silence of the usual suspects was deafening.
WTF? Rice subsidies was not exactly the message of that story but rather the market for water is a serious issue not just for rice but for all of the West. Try watching Chinatown (1974) as it was a classic.
“Cadillac Desert” (by the late Mark Reisner) is a great read on western water history. The PBS series, same name, is also excellent. Mulholland and LA water are parts of a much larger story.
JohnH,
Most of US rice production is not in California but in a fairly concentrated area in northeat Texas and into Arkansa, around Texarkana. The area is pretty well suited to it. This really has very little to do with trade agreements.
About agriculture and concern with climate change, the Chinese have recognized the need to restructure agricultural production and policies are meant for just this purpose. China has both transformed the growing of traditional water intensive rice varieties, adding to the productivity of fields, and developed a variety of rice that is importantly less water intensive and even tolerant of saline soil. Also, China has develop a potato grown from seed that significantly adds to soil yields. Vegetable growing has been increasingly in green houses. Fruit growing is increasingly in green houses.
At this point I bet JohnH is going to bash the PRC for letting their farmers grow rice. I know it would be a stupid thing to say but that is what he does.
https://news.cgtn.com/news/2021-06-25/Chinese-scientists-reinvent-potatoes-to-solve-global-food-crisis-11nmIctElUc/index.html
June 25, 2021
Chinese scientists ‘reinvent’ potatoes to solve global food crisis
Chinese scientists have developed a generation of “pure and fertile potato lines” with genome editing technologies in a groundbreaking achievement.
The experiment, led by Huang Sanwen, a researcher with the Agricultural Genomics Institute at Shenzhen (AGIS) under the Chinese Academy of Agricultural Sciences (CAAS), used genome design to transform potato breeding from a slow, non-accumulative mode into a fast-iterative one.
Their study, * titled “Genome design of hybrid potato,” was published online in one of the world’s leading academic journals, Cell.
Unlike other crops, potato, the tuber crop is clonally propagated rather than seed propagated.
As a result, potato farming faces a range of problems, including long breeding cycles, low reproduction efficiency, diseases and pest attack, Huang, director-general of the AGIS, told China Media Group (CMG).
Moreover, due to the complexity of its genome, potato’s genetic improvement and the breeding process are very slow, Huang added….
* https://www.cell.com/cell/fulltext/S0092-8674(21)00707-8
The rice farmers in the Sacramento Valley have first dibs on the water. They are first come first served. The San Joaquin Valley west side farmers are last in the pipeline. That is where the almonds are being chipped.
As for the growing of rice, far more acreage is devoted to rice in California (mostly about the Sacramento valley) than in Texas.
Rice production in Arkansas is more than twice that in California. Arkansas is the top producing state. There is a bunch in TX, but it is indeed an extension of this areas the major part of which is in neigbboring Arkansas. That is the leading rice growing area of the US.
BTW, ltr, you should know better. It is production that matters, not acreage, although CA does beat TX on the latter, but way behind the AT-TX area I noted.
You have to admit, that global warming (yes my preferred terminology) is a somewhat difficult concept for some to grasp. I have seen many meteorologists (NO, they are not climatologists, but it is a science and loosely related) say that global warming is garbage. I strongly believe global warming is happening. My feeling is (and I know some will still deny it even after observing “said such”) that the best way to convince people of global warming and rising ocean waters, is to show them time-lapse video of the polar regions and ice caps and large icebergs melting into the ocean. To me, seeing is believing, and it’s powerfully convincing stuff.
https://www.youtube.com/channel/UCrbOu1VKjJinDig-0p2dZAw
https://www.youtube.com/watch?v=a7d_A60Hs7c
Kopits: “Satellite puts us back at late 1990s levels.”
Kopits never fails to deliver. If you make the mistake of clicking on Kopits link, you will see that he does the tried and true method of picking out a single point on a graph, 1998, which was an anomalous peak year, and comparing it to 2021. He completely ignores the big fat red line on the chart that shows the 13-month smoothing average which clearly shows an upward trend. (Why 13-months is a mystery but it is what it is.)
And then further he ignores the text accompanying the chart which states “The linear warming trend since January, 1979 remains at +0.14 C/decade.”
But the real joke is that Kopit’s chart is from the denialists’ favorite scientist Roy Spencer. Even Spencer says that the trend is upward, “+0.14 C/decade”. Which I guess makes Kopits a denialist denier? What has the world come to when you can’t even trust your own favorite deniers anymore.
Such misrepresentation has made Princeton Steve the chief economist for Fox and Friends.
By the way, since I had to go to Spencer’s site to check the context, because why would anyone trust Kopits, I stumbled on this interesting quote:
Spencer: “It is interesting to note that, even though carbon dioxide is necessary for life on Earth to exist, there is precious little of it in Earth’s atmosphere. As of 2008, only 39 out of every 100,000 molecules of air were CO2.”
Which means that the other 99,961 molecules are not CO2! Nothing to worry about here, folks.
And of course, that 2008 data is stale. We now have 42 molecules of CO2 per 100,000 — an almost 8% increase just since then. But that still leaves 99,958 other molecules that are not CO2, so still nothing to worry about.
Joseph,
Bingo! You’ve got it. CO2 is a trace element of the atmosphere. An 8% increase in an infinitesimal quantity is not significant enough to impact world climate.
Princeton Steve needed a little help in his disinformation campaign and THERE’s SAMMY – right on cue!
BTW Sammy – I guess your preK teacher failed you totally. 8% of infinity is still infinity.
@ pgl
Infinitesimal means small or very tiny. Milton Friedman never taught you that on the day he winked at you??
Got it – I’m glad you have teamed on with Sammy on this issue. Maybe he can also teach you how to better bash short basketball players who are not white.
sammy An 8% increase in an infinitesimal quantity
Where did you get this 8% figure? CO2 concentration has increased by ~50% since pre-industrial times. And just to put things in perspective, a 50% reduction relative to pre-industrial times would leave the earth as a solid block of ice. Also, CO2 is not uniformly distributed throughout the atmosphere.
And why do you think a number that sounds small in terms of parts per million cannot have a significant effect? There are plenty of toxins that will leave you quite dead with concentrations orders of magnitude smaller than CO2’s concentration in the atmosphere. This is really one of the stupidest comments yet. You clearly never went to college, so now I’m wondering if you even graduated from 11th grade chemistry.
“why would anyone trust Kopits”
Since Stevie pooh is a consultant, someone is making the mistake of paying him for his “analysis”. Like lawyers who want him to lie to the court.
Roy Spencer denies Exxon ever paid him for his climate change views but it does seem Peabody Energy paid him:
https://www.huffpost.com/entry/roy-spencer-peabody-energy_n_57601e12e4b053d43306535e
I bet Princeton Steve is jealous that he has not been given slush funds by Big Oil for his intellectual garbage.
Hey, Sammy. I can make you feel even better about it than an 8% rise in CO2 in 12 years. Another way of saying it is that the non-CO2 molecules have declined by a just 3 molecules in 100,000, a mere 0.003%, .
As a famous celebrity I’m sure you are familiar with once said “What — Me Worry?”
You might also recall that your ally CoRev is the guy who reassured us that CO2 couldn’t possibly cause long term global warming because photon interactions with CO2 molecules last only a nanosecond. Q.E.D. suckers.
This very well may take the prize of stoooopidest comment i have yet seen on this blog. And there have been many challengers for the title. Sammy, I certainly hope you are not as stoooopid in real life as you are on this blog.
Joseph and Baffled, do you dispute the science of the capture time of an IR photon in a CO2 molecule? Please explain.
CoRev Do you dispute the fact that photons are continuously bombarding CO2 molecules? Kind of makes the capture time of each interaction irrelevant, doesn’t it. You’ve raised this idiotic “point” before. Why can’t you learn?
2slugs, ” Do you dispute the fact that photons are continuously bombarding CO2 molecules?” NO! For a photon to be captured the CO2 molecule must have already released the past photon. That’s where the sub-sub second time frame is important. ALL THE WHILE THE CO2 MOLECULE’S VIBRATION FREQUENCY REMAINS UNCHANGED. Have you no understanding of physics.
Now for the inert molecules the photons do continuously bombard them changing their vibration frequencies. You and the others are showing your ignorance. Why can’t you learn?
“ALL THE WHILE THE CO2 MOLECULE’S VIBRATION FREQUENCY REMAINS UNCHANGED”
lets not go down this rabbit hole again. this comment really has no bearing on what is happening. corev, do you really think it is the vibration of the co2 molecule that is heating up the earth? really? here is a nice little article describing the physics of the greenhouse effect. you probably should take a refresher course
https://news.climate.columbia.edu/2021/02/25/carbon-dioxide-cause-global-warming/
Baffled and 2slug , please stop with your ignorance: Baffles claims: “do you really think it is the vibration of the co2 molecule that is heating up the earth?”
and
2slugs claims: “Do you dispute the fact that photons are continuously bombarding CO2 molecules? Kind of makes the capture time of each interaction irrelevant, doesn’t it”
From Baffled’s own article re: the importance “The radiative lifetime and collisional deactivation of vibrationally excited CO2 have important consequences for its ability to emit infrared radiation under atmospheric conditions. CO2 in its vibrational ground state may be excited to its vibrational excited state. ”
CO2 captures only those photons vibrating at similar rates to its own. It captures these photons for a sub-sub second time frame before emitting another photon at that vibrational frequency.
In 2slugs world, he seems to think that there is little or no emitting of photons from CO2. That is a complete reversal of how atmosphere temperatures occur. In 2slug-world temperature (for the ignorant vibrational frequencies denote a specific temperature) the higher in the atmosphere temperatures would rise due to more ever more frequent photon collisions with CO2 and other atmospheric GHGs.
A quick test of 2slugs understanding would be to consider climbing a mountain. At which level is the temperature usually the highest? Base or top?
Their understanding is idiotic?
“CO2 captures only those photons vibrating at similar rates to its own. It captures these photons for a sub-sub second time frame before emitting another photon at that vibrational frequency.”
it does not say the vibrating molecule heats up the atmosphere. co2 only captures photons with a frequency that allows the molecule to jump to its next highest eigenstate-its first mode of vibration. the frequency of photon that does this is in the infrared range. most other photons in other frequencies do not interact with the molecule. visible light is emitted from the sun and passes through the atmosphere unimpeded. the photon is absorbed at the surface, and energy is emitted as a photon in the infrared range. but this photon range cannot pass back through the atmosphere inertly. it is now captured by the co2 molecules, and the energy is emitted again back to the surface. this is how the energy is captured in the lower atmosphere for the long term. corev, your focus on vibration frequency and timeline is overlooking the actual mechanics of what is happening throughout this entire process. the vibration frequency is not trivial, as it is the key to understanding why the molecule absorbs the photon to begin with. but the heating process itself is not the mechanical vibration of the molecule. the co2 simply acts like a layer of insulation, keeping the photons of energy near the surface of the earth. the co2 does not let the photon (or energy if you will) return back to space. corev, this has been explained to you before, why are we going over the basics once again?
Baffled, your confusion is “why WE are we going over the basics once again?” Your explanation of the GHE is replete with exaggerations or misconceptions to illustrate your ignorance. No, solar energy does not “passes through the atmosphere unimpeded.” Read Joseph’s comment again. No. ” this photon range cannot pass back through the atmosphere inertly. …, and the energy is emitted again back to the surface.” Molecular photon emission is at random angles not directional to the surface.
No,” keeping the photons of energy near the surface of the earth. the co2 does not let the photon (or energy if you will) return back to space.” My whole point was that the keeping/capture time frames are in sub-sub second time frames.
No one has yet refuted that sub-sub second time frames.
“My whole point was that the keeping/capture time frames are in sub-sub second time frames.
No one has yet refuted that sub-sub second time frames.”
the energy is not stored in the co2 directly, so that sub-sub second time frame is not really an issue. the co2 forms an insulation layer that does not let the energy return to space. the increase in temps we see in earth are not an increase in temps (or motion of co2). it is of all the other objects on earth that eventually absorb the energy that the co2 does not let out. in fact, its the fact that the co2 itself only absorbs the photon for a very short period of time that this insulation behavior occurs. because it means that a single co2 molecule can interact with far more infrared photons. and from a probability perspective, fewer emitted photons will propagate through the layer of co2 into outer space than remain here on earth. if the co2 were to absorb and keep the infrared photon for an extended period of time, then it would not act as a very good insulator and more photons could escape the earths atmosphere. the short duration of absorption is why it takes so few co2 molecules to have this effect. some commenters on this site had questions about why such a low percentage of molecule could be so disruptive. it has to do with how active the molecule is interacting with the photons.
Baffled comment 1: ““ALL THE WHILE THE CO2 MOLECULE’S VIBRATION FREQUENCY REMAINS UNCHANGED”
… this comment really has no bearing on what is happening.”
Baffled comment 2: ” the vibration frequency is not trivial, as it is the key to understanding why the molecule absorbs the photon to begin with.”
Baffled, you sound really confused. From no bearing to key to understanding… try again.
This science stuff can be really hard, eh?
i keep forgetting who i am talking to, so things must be explained slowly.
it is not the fact that the molecule is vibrating that directly contributes to the warming. whether the molecule is vibrating in its first, second, third, etc mode of vibration in and of itself is not really the mechanism of concern. even at its ground state, the molecule is still vibrating. what you need to keep in mind is that a molecule cannot absorb any arbitrary amount of energy. only photons with energy (ie frequency) that is close to the change in energy between the ground state and say the first mode of vibration for the molecule are of importance, since these photons can be absorbed by the molecule. in the case of co2, this is in the range of the infrared photon. if a visible light or ultraviolet light photon approaches a co2 molecule, it will not be absorbed and most likely will not even interact with the molecule. only the infrared photon will be absorbed, and eventually released by the co2 molecule. this is why the vibration frequency has some importance, but the actual vibration is not really of great interest. heating is not due to the physical vibration itself, but helps to describe what frequencies can be absorbed. the co2 basically serves as a one direction insulation layer for the energy. corev, i am really surprised that a climate change expert like yourself does not understand this concept. this science stuff is really not that hard, if you have a background in science.
Baffled, I am shocked at your ignorance of what constitutes molecular energy, your failure to explain how capturing a photon and then re-emitting at RANDOMLY DIRECTIONS (not co2 basically serves as a one direction insulation) and most importantly refuted the importance of the sub-sub second time frames for photon capture. Moreover, you have ignored the fact that these interactions are occurring at light speed.
We both agree that the effect is to delay the release of a specific photon to space. Once captured by a GHG emission creates a different photon vibrating at a different rate. Up, down or lateral the direction of travel of the emitted photon is random. If up or lateral there is a high 99.9% opportunity, for that photon to pass through the atmosphere to space due to the slight density, 0.1%, of atmospheric GHGs. It gets even worse. GHGs are concentrated at the surface, so photons have fewer and fewer opportunities to be captured as they rise. That is true even for that 2 meter temperature gauge height
Realizing that use of “greenhouse and insulation” terms are totally inappropriate for the actual science. This science stuff can be really hard, eh?
corev, i do not argue that a photon is released in a random direction, and this would be easier to show you in a diagram, but here goes. the co2 forms a type of barrier that becomes one directional for the infrared photons, which are emitted from objects on earths surface and project up into the atmosphere. now it is true that the photon will be absorbed by a co2 molecule in the air, and emitted in a random direction. but if the photon is emitted in a random direction with a downward component, it will eventually be reabsorbed by an object on the surface of the earth and contribute to warming. on the other hand, if the photon is emitted in a random direction with an upward component, there is a distinct possibility they are once again absorbed by another co2 molecule (and the more co2, the more likely this is to occur). now again we have a random chance of emission with an up or down component. a down component returns the photon to earth’s surface. and an up component tries to move the photon towards space. on its way it gets absorbed by yet another co2 molecule, and the story is simply a rinse and repeat. it is a probability problem. the more co2 in the atmosphere, the more likely a photon is to be captured and returned to earth. if you follow probability theory, you will see the likelihood of a photon with multiple interactions all pointing up will be much smaller than the likelihood of a down motion within the first few interactions. it is more likely for the photon to stay in the lower atmosphere and near the surface of the earth than to propagate back up through the co2 infused atmosphere. this is how it forms an insulation layer, keeping energy on earth rather than radiating into space. this science stuff really is not that hard corev.
Ah yes, that scion of knowledge corev. The one who suffered a heart attack with quad bypass surgery, but refuses to acknowledge his responsibility for his situation. It was not the milkshakes, steaks and lack of exercise that clogged his arteries. It was an unspecified genetic mutation which interacted with an unknown prescribed medication that clogged those arteries. Forgot about him.
This reminds me of the scientific testimony in the Chauvin trial. Why the defense did not call Sammy as their expert is beyond me.
Forgive me for being the last person to know. Can anyone tell me what’s going on with Brad Setser lately?? Missing his commentary. With the exception of Michael Pettis I can’t think of anyone better than Brad Setser at breaking down USA-China bilateral trade, and really a lot of other trade issues.
Oh wait, because he is with Biden now he can’t give commentary?? Is that the idea?? I think maybe I just answered my own question
Moses Herzog: He is counselor to USTR, https://ustr.gov/about-us/biographies-key-officials/brad-setser-counselor
If that’s what Mr. Setser wants nobody deserves it more. Do miss the trade writing though. I’m sure he’ll be back at it again.
Brad is working for the Biden Administration which alas precludes him from blogging.
Menzie, you state “…have seemingly dropped off the world” but how do you know that they haven’t all burned into the ether? From this heat? Because in terms of heat it’s one of the hottest times ever. It’s an anomaly, this heat. lmk
EConned: I don’t know. All I’m stating is that they have rarely been sighted commenting on this blog of late. I am sorry if that observation offended you.
The reason is, since the orange creature squatting in the White House from Jan 2017 to Jan 2021 has now been shown to be a LOSER in the democratic process they’ve all lost interest and now find the orange abomination boring.
EConned is the last holdout. He’s like the college freshman at the frat party who has to pick up the mess off the floor and tell the campus police the guy who died from bingeing on alcohol only died from an epileptic seizure. They told him he’s “Little Sister of the Week” if the floor passes inspection.
Hahaha. Wait, what? I think that I’m following roughly 66% of your comment (and, if I must brag, that is medal-worthy achievement) but, for certainty, could you be clearer in exactly what it is I’m holding out over? And please refrain from utilizing YouTube for support.
@ EConned
You’re explaining your “joke” in long paragraph form, while telling someone else how discernible their comments are?? You’re so precious.
Do you often find yourself “explaining” jokes after no one laughs??
Moses Herzog – I was explaining to Menzie why he was wrong about my being “offended”. Note that your comment is another example of how emotional commenters are on this blog – it’s quite hilarious. Why are you so emotionally affected by my comments? Why are you concerned at all with responding to a discussion you weren’t a part of?
Interesting that you’re speaking about others having to explain things while I explicitly asked you to explain your word-[edited – MDC]-salad of a comment re: ”holdout”
EConned
Calm down Sally Field, the Academy loves you, they really really love you.
On a blog, you may have to debate with more than one person about a particular issue. If you’re too weak mentally to handle that, try a single-player game on PS4. Maybe gamers won’t need your 20 page footnotes for “jokes” that bomb. Or you can join a women’s book club. If they disagree with you on your take on the book you can tell them they are being “emotional” and everyone will hail your genius after ever having disagreed with you. We’re all pulling for you here “EConned”.
Moses – hahaha and what on earth do you think is being debated?
Hahaha – sorry for offending me? Why on earth would you think that I’m offended? You and other commentators on this blog are extremely emotional at times. I’ll clue you in (yet again)… I was merely making a joke. See, you created a post about warming. In that post you made a remark about no longer seeing specific commenters who you deem “skeptics of global climate change and/or anthropogenic sources” – that they “have seemingly dropped off the world“. As such, I found it funnier to think of their absence being due to the very heat that your post is about. I mean, you didn’t seriously think that they “dropped off the world” and I (seemingly) obviously wasn’t serious in suggesting that they “ burned into the ether… from this heat”. Although, given your comment it seems that you possibly took my ‘question’ rather seriously. But why in the world I be offended by your “observation” – unless possibly you’re projecting? Is it clearer now? lmk
If you have to explain your joke, then it was not funny.
I understand this common retort and I never claimed to be Chris Rock – but there’s certainly no reason to think, via my comment, that I was offended. However, deeming something “not funny” for reasons other than its funniness is the pits.
@ EConned
You’re much closer to TBN’s Huckabee monologue “humor” as far as I’m picking up. I’m still waiting for the funny part. Can you explain the part about the heat again??
It simply was not funny due to a lack of funniness. Nothing else. Econned, you seem to struggle with verbal and social cues.
And I thought Moses’s comments were long winded wastes of time. Geesh!
I’m always on your mind.
Econned does feel lonely a lot. I wonder why.
Still on pgl’s mind – thanks for the thoughts!!!
Statistically, it’s actually cooler than it’s been in recent months.
We had a heat wave here earlier this week but today the high was only 65. So by your metric, problem solved. Of course your metrics are transparent cherry picking that is beyond stoooopid.
“Cooler than it’s been in recent months”? What are putting in your iced tea?
Family in Boise saw triple digits all last week will do so again 9 of the next 10 days.
Here in the Sierra foothills it hasn’t been in the 60’s at night for two weeks. High 90’s, low 100’s during the day. 106 next weekend. 79 at night.
The new heat pump I purchased last fall is definitely paying off.
In Princeton Stevie’s world the Pacific Northwest does not count. After all – Biden carried more of the vote there so they must all be socialists.
Don’t know the global average, but another area seeing record heat in recent weeks was Moscow, unprecedented stretch in the 90s. Not all just the Pacific Northwwest with the records.
We have had the heat on all weekend here in Cape Cod.
Climate basics! If it warm at one place IT WILL BE COLD at another: its weather!
Steven Kopits Huh? It might have been cool in your own backyard, but globally the last few months have been well above the norm. And when Menzie refers to the land temperatures of the northern hemisphere, he is not just referring to Steven Kopits’ backyard. Asia in particular has been particularly hard hit over the spring months (March, April & May):
https://www.ncdc.noaa.gov/temp-and-precip/global-maps/202115?products%5B%5D=map-land-sfc-mntp#global-maps-select
http://www.esrl.noaa.gov/gmd/ccgg/trends/
January 15, 2021
Atmospheric Concentration of Carbon Dioxide, 1980-2020
(Parts per million by volume)
1980 ( 338.75) (Low)
1981 ( 340.11)
1982 ( 341.45)
1983 ( 343.05)
1984 ( 344.65)
1985 ( 346.12)
1986 ( 347.42)
1987 ( 349.18)
1988 ( 351.57)
1989 ( 353.12)
1990 ( 354.39)
1991 ( 355.61)
1992 ( 356.45)
1993 ( 357.10)
1994 ( 358.83)
1995 ( 360.82)
1996 ( 362.61)
1997 ( 363.73)
1998 ( 366.70)
1999 ( 368.38)
2000 ( 369.55)
2001 ( 371.14)
2002 ( 373.28)
2003 ( 375.80)
2004 ( 377.52)
2005 ( 379.80)
2006 ( 381.90)
2007 ( 383.79)
2008 ( 385.60)
2009 ( 387.43)
2010 ( 390.10)
2011 ( 391.85)
2012 ( 394.06)
2013 ( 396.74)
2014 ( 398.87)
2015 ( 401.01)
2016 ( 404.41)
2017 ( 406.76)
2018 ( 408.72)
2019 ( 411.66)
2020 ( 414.24) (High)
Of course Sammy calls this persistent increase “infinitesimal”. Yea I mistakenly read infinity which gave old Uncle Moses the chance to join Sammy in his intellectual garbage. At least he was not hurling his usual insults at black basketball players (so far).
Game 4 and Game 5 highlights from the man that pgl is calling “the next Stephen Curry”.
https://www.youtube.com/watch?v=Ocw3SB4KfJc
Die hard NBA fans call him Trae “The Flopman” Young because of his amazing ability to play dead after someone touches any part of his epidermis.
https://twitter.com/bleacherreport/status/1409336114549170176
Trae “The Flopman” Young did not make the NBA all-star list this year because of the NBA’s upper limit of an average of 90 flops per game.
http://www.esrl.noaa.gov/gmd/ccgg/trends/
January 15, 2021
Annual Mean Atmospheric Carbon Dioxide Growth Rate, 1980-2020
(Parts per million by volume)
1980 ( 1.68)
1981 ( 1.43)
1982 ( 0.86)
1983 ( 2.36)
1984 ( 1.51)
1985 ( 1.21)
1986 ( 1.47)
1987 ( 2.06)
1988 ( 2.24)
1989 ( 1.24)
1990 ( 1.20)
1991 ( 1.05)
1992 ( 0.49) (Low)
1993 ( 1.36)
1994 ( 1.95)
1995 ( 2.01)
1996 ( 1.24)
1997 ( 1.91)
1998 ( 2.97)
1999 ( 0.92)
2000 ( 1.62)
2001 ( 1.62)
2002 ( 2.51)
2003 ( 2.26)
2004 ( 1.59)
2005 ( 2.57)
2006 ( 1.69)
2007 ( 2.31)
2008 ( 1.54)
2009 ( 2.00)
2010 ( 2.30)
2011 ( 1.92)
2012 ( 2.65)
2013 ( 1.99)
2014 ( 2.22)
2015 ( 2.90)
2016 ( 3.03) (High)
2017 ( 1.93)
2018 ( 2.88)
2019 ( 2.48)
2020 ( 2.31)
Yup! It has warmed since ~1881 as the chart shows. So what? Can anyone point to a successful prediction of a Climate Catastrophe?
A reminder– there are 2 questions there.
CoRev: Welcome back! My inventory of case studies in faulty analysis to use for my stats class was running low.
At least we are making progress. It appears the little critter is no longer denying global temps are rising. Baby steps. Hopefully he wont regress back to his hiatus era.
You know deep down he loves you Menzie. He’s being very coquettish.
Menzie, speaking of faulty analysis answer the questions! I usually class these infrequent climate articles to “click bait” to increase readership/participation.
Yes, it has warmed since 1881. So what?
We’re you under anesthesia too long during surgery?
Yes, two questions.
I love your 1st question (so what) as that question should be posed after each and every one of your worthless comments.
https://www.scientificamerican.com/article/smoke-from-australias-bushfires-killed-hundreds1/
https://www.thejournal.ie/heatwave-canada-wildfire-5484685-Jul2021/
https://www.reuters.com/world/americas/dire-fire-warnings-issued-wake-record-heatwave-canada-us-2021-06-30/
https://www.bbc.com/news/world-australia-53549936
https://www.theguardian.com/world/2021/jul/02/canada-wildfires-british-columbia-heatwave
Is 3 Billion animals in Australia (not counting humans) and 700 human beings in western Canada enough of a catastrophe for you CoRev?? Or are you and sammy demanding stronger stuff?? Then we can get into the newly homeless returning back to black smoking ashes that used to be their homes.
But all that video of fires burning homes and large flames skipping over well-known highways must be part of the “liberal conspiracy” aye CoRev??? Are CNN liberals video taping this made up stuff at the same place NASA did the “pretend space landings”?? Or are they projecting fictional images of burning forests up on the wall of the basement of Comet Ping Pong??
@ CoRev
https://www.yahoo.com/news/postapocalyptic-movies-heat-wave-killed-140818297.html
http://www.xinhuanet.com/english/2021-07/03/c_1310041335.htm
July 3, 2021
Over 1.28 bln doses of COVID-19 vaccines administered in China
BEIJING — More than 1.28 billion doses of COVID-19 vaccines had been administered in China by Friday, the National Health Commission said Saturday.
[ Chinese vaccines are being administered domestically at a rate of 20 million doses daily. Internationally, more than 480 million doses of Chinese vaccines have been distributed. ]
Those Chinese vaccines worked out great for Brazil. Have they sent Xi Jinping a “thank you” note yet??
Alright, let’s take a look at the NOAA data per Menzie’s link. Here are a set of graphs: http://www.prienga.com/blog/2021/7/3/surface-temperature-anomalies
How one views the situation is a function of the time scale involved. As Figure 1 shows, current temperatures line up well with long term trends, with temperatures rising 0.9 degree C per century. This number is not contested by anyone, and there is no change in the long term trend. There is nothing new of note compared to the historical record. The R2 is also pretty good: 0.78.
But let’s take a shorter time frame, say, since 1970, that is, 51 years, which is shown in Fig. 2. This shows global surface temperatures rising by 1.8 deg C per century. If we start in 1960 (Fig 3), then the rate of growth drops to 1.6 deg C per century, but the R2 is a little higher, 0.81 v 0.80 starting in 1970.
Basically, I don’t see much difference in the R2 in Fig 1, 2, or 3, so it comes down to which time frame you feel is more relevant.
But here’s the fly in the ointment: Figure 4. If we subtract the Northern hemisphere temperature anomaly from the Southern Hemisphere anomaly, then we see an increasing and large divergence between the two series. The temperature anomaly in the north has growth by about 0.6 deg C more than in the south since 1980. At the current pace, over the course of a century, the temperature anomaly will grow 1.7 deg C more in the north than the south.
If you were looking at CO2 as the key driver, then you would immediately think that CO2 might not be crossing the equator, but, allowing for seasonal effects, atmospheric CO2 is essentially identical whether measured at Hawaii’s Mauna Loa, Tasmania’s Cape Grim, or Barrow Alaska. C02 is well mixed across the global atmosphere.
Therefore, we are speaking of hemispheric factors as the principal drivers of the temperature anomaly. The northern hemisphere has seen two key developments in the last forty years. The first of these is the fall of communism. When I first moved to Hungary, the sky was always cloudy with the garbage state-owned enterprises were throwing into the air. By the mid to late nineties, these blenching behemoths had closed and Hungary’s — and indeed, all of Central and Eastern Europe’s — air was much cleaner, and there were many more sunny days. Ending communism reduced air pollution, which was filtering out sunlight.
The second is, of course, the rise of China. Modern China emits lots of heat from industry, transportation, non-reflective bodies like asphalt, and side effects of residential and commercial activities like heating and underlying power generation. Further, bear in mind that many locations in China which were rural forty years ago now stand in the middle of great cities, where the recorded temperature could be as much as 3-5 deg C higher than the surrounding countryside.
Whether we are speaking of the northern or southern hemispheres, the NOAA data speak to gradually rising temperatures since the 1880s. This is not disputed by any skeptic. The divergence and northern and southern anomalies tell us, however, that the principal driver of increasing anomalies in the north is direct human-generated activity, rather than CO2 emissions.
Steven,
You are partly right here but way overemphasizing the fall of communism, which did not happen until almost 20 years after average global temperature began to rise again after a several decade period during which it declined slightly.
The larger more likely item, which the fall of communism was a later part of was the cutback in SO2 emissions as higher income nations enacted environmental laws in the early 1970s that put controls on SO2 emissions from coal burning and also on aerosols, but not on CO2 emissions. It was arguably a race between the two, but with SO2 and aerosols slowing down in the high income nations and then in Eastern Europe while CO2 continued to grow the balance shifted. As it is both SO2 and aerosols tend to cool things down.
As it was this also was tied up with the debate that went on among climatologists in the early 1970s, which has frequently been misrepresented by many people on various sides of the argument since. So it is a fact that in 1971, a point in time when global average temperature was actually slightly declining, the academic papers by climatologists were evenly split between those who said we were going to cool and thosw who said we were going to warm. Actually it was about a third for each of those positions with about a third saying no change. The debate was very much about the trends in SO2 and aerosols versus CO2.
Two things happened that changed all that so that by 1978 there were zero academic paper saying cooling was going to happen and near zero that nothing would happen. Warming as the forecast had totally won the academic debate. So the two things that happened were indeed the passage of those laws that began to limit SO2 and aerosol emissions while not CO2 and the other more imporant one that nobody has mentioned is how long these stay in the atmosphere. SO2 and aerosols fall out of the atmosphere quite quickly, whereas CO@ is very persistent and stays for a long time. This latter was the realization that led Stephen Schneider to change his 1971 position completely, with many other coming to the same realization. CO2 was going to win in the longer run, which it seems to have been doing, even as coal burning continues to increase in China and India.
Anyway, after the fall of communism in Eastern Europe, indeed most of those nations joined the eaelier ones in reducing thei SO2 and aerosol emissions as you noted while doing nothing to slow their CO2 emissions.
Steven Kopits The divergence and northern and southern anomalies tell us, however, that the principal driver of increasing anomalies in the north is direct human-generated activity, rather than CO2 emissions.
Why would you expect the two hemispheres to warm at the same rate? Look at a map.
Menzie,
There you go again. Another simple statistical fallacy.
We often see these temperature anomaly charts in news articles about climate change. The reader is supposed to see the upward trend and conclude that human beings are indeed causing the temperature to rise alarmingly by emitting GHG. The remedy of course is always some big government program, substantial new regulations, or higher taxes, all designed to further progressive political goals.
The problem with these charts, of course, is that the climate system has substantial natural variability in physical quantities such as temperature. How much of that upward move in temperature is a result of natural variability of the system and how much is due to GHG emissions? That’s very difficult to say. We know that temperature anomalies can follow trends over many decades or even centuries without any man-made causes. That point is obvious in the chart Menzie posted: the temperature anomaly trended up from 1880 to the mid-1940s, a time when human GHG forcing of the climate system was minimal.
Scientists have constructed temperature anomaly charts that go back to 1000 AD. When you look at those charts, you can see periods over many decades and sometimes centuries when the anomaly trended up and down, without any man-made influence. For example, the temperature anomaly trended down and stayed down from about 1450 to about 1850, the so-called Little Ice Age. Moreover, temperature anomaly charts that go back tens of thousands of years have also been constructed and they show the same internal natural variability of the temperature, with long episodes a very substantial variability. So, focusing on recent trends over just a few decades is insufficient to conclude that the anomaly trend is primarily human-caused.
To come to the conclusion that the temperature rise is caused by GHG emissions, you can’t just post a chart like this. That’s a simple statistical fallacy. Instead, you need to model the climate, which is indeed what climate scientists do to argue the rise in temperature has a significant human component. But here’s the problem. The earth is emitting about 240 W/m^2 and about 2 W/m^2 of that total come from human activities, about 1% of the total energy balance. Unless you understand the 99% of the energy coming from natural processes with a precision well below 1%, i.e. understand the internal variabllity of the climate very precisely, you really can’t say much about the effect of human activities on temperature without significant uncertainty. I’ve remarked at length in previous comments about the very significant uncertainty in cloud modeling, which are merely parameterized in climate modeling. Variation if the energy balance of clouds can be as big as human-caused GHG forcing.
Rick Stryker: I agree one graph is insufficient to address whether anthropogenic climate change is occurring. So, I look forward to your peer-reviewed rebuttal to Kaufmann, et al. (https://econbrowser.com/archives/2014/02/ex-post-historical-simulation-of-a-statistical-model-of-anthropogenic-climate-change ) which you have previously seen and commented on (but not to my knowledge rebutted in a peer reviewed journal). You could tell Jim Stock, at the same time, how he mis-specified the model.
Menzie, so which graph do you want us to refer to for a reference? Fig 1 1950 to 2008, or Fig 2 and 3 which cover 1998 to 2008? The reason I ask is because you have a graph showing results from 1880 through 2021. Comparisons of different time frames, different data, different data types measured temperatures with modeled temperatures. Which brings me to the “blind belief” of your comments reference “… how he mis-specified the model”. Please, please take another look at Fig 2 which does the model v measurements comparison for this brief period.
Your comment is clearly an egregious example of faulty analysis. Use it in class.
Menzie,
Well, the model is massively mis-specified. There’s a reason climate scientists build these gigantic physical models to model the climate. Simple linear approximations with just a few variables won’t cut it.
In any event, I don’t get paid for writing articles for peer-reviewed journals so it would be a waste of my time to write any such rebuttal.
Happy Fourth!
And even if you did write something – it would be a waste of time for any of us to read your utter gibberish.
Rick,
Funny you should bring up natural factors. This is one of the reasons why so many climatologists are convinced it is anthropogenic GHGs, which importantly include methane, not just CO2 as the main culprits in the rising temperatures of the recent decades. There is a long list of natural causes that affect global temperature and they are well understood. But the hard fact is that not a single one has been moving in a direction that would tend to heat things up. If anything since 2000 suspots have if anything gone in a direction that would tend to cool things off.
This “it could be natural causes!” story is just dead in the water. Not happening.
Barkley, “This “it could be natural causes!” story is just dead in the water. Not happening.” ENSO is man made? Go tell that to the climatologists, meteorologists, and oceanographers.
CoRev,
There is no trend in ENSO. It oscillates, but no trend. So it plays a tole in a lot of those shorter term fluctuations on the trend, but does not drive the trend.
Really, CoRev, you should have remained absent from here, even though Menzie welcomed you back. You just make a total fool of yourself.
Barkley again shows his arrogance and ignorance. “So it plays a tole in a lot of those shorter term fluctuations on the trend, but does not drive the trend.” The highlight was and has been my point many times.
Trends are interesting things with durations and end points. Is focusing on a mere 140+ year duration important to an ~ 20,000 year duration, the interglacials? Only the arrogant liberal mind thinks we will skip the next glaciation, and that the last ~140 represent a MAJOR change in what has happened in this and the past interglacial periods.
CoRev,
Wow, total babbling. One minute you bring up the ENSO, which is clearly a very short term fluctuation that indeed does influence global temperature, suggesting somehow that this is the natural cause that might be behind recent global warming rather than human activities. Then you shift to talking about 140 year trends and glaciation, which have nothing to do with ENSO.
Yes, CoRev, obviously over the long past natural causes have driven average temperature changes. The point is that in the last 45 years since global average temperature began to noticeably rise, there have been no trends in any of the natural causes we know affect global temperature, or to the extent there are any, they are moving to cool things off, but not succeeding at that.
Again, bottom line, ENSO is not trending. I have no idea why you brought it up. Another sign that you can be just astoundingly stupid on top of ignorant.
Kopits: “But here’s the fly in the ointment: Figure 4. If we subtract the Northern hemisphere temperature anomaly from the Southern Hemisphere anomaly, then we see an increasing and large divergence between the two series.
If you were looking at CO2 as the key driver, then you would immediately think that CO2 might not be crossing the equator, but, allowing for seasonal effects, atmospheric CO2 is essentially identical whether measured at Hawaii’s Mauna Loa, Tasmania’s Cape Grim, or Barrow Alaska. C02 is well mixed across the global atmosphere.”
No, only an idiot would think that CO2 is not crossing the equator. But any third-grader looking at a globe realizes that the global land area is highly asymmetric. There is twice as much land area in the Northern Hemisphere than the Southern Hemisphere.
You speak as the typical “amateur scientist” who thinks they have discovered some profound observation that all the real professional scientists have somehow overlooked.
But the fact is that the temperature asymmetry between Northern and Southern Hemispheres was recognized and studied over 140 years ago by Croll, among others. It’s not a new observation at all.
The reasons for the temperature asymmetry is complex but all are based on the asymmetrical distribution of land between north and south as observed by the third-grader. It involves seasonal insolation and albedo differences, but the biggest factor is oceanic heat transport from the southern to the northern hemisphere, primarily in the Atlantic Ocean. This is due to the peculiar orientation of the continents on either side of the Atlantic constricting and driving the currents. There is a net transfer of heat from south to north. So no need to invoke communism and Chinese asphalt as an explanation.
After this latest Princeton Steve long winded pile of misdirection, I though damn it will take me a long time to take it down. But of course you had already done the hard work for the rest of us. Thanks!
Joseph says: “The reasons for the temperature asymmetry is complex but all are based on the asymmetrical distribution of land between north and south as observed by the third-grader. It involves seasonal insolation and albedo differences, but the biggest factor is oceanic heat transport from the southern to the northern hemisphere, primarily in the Atlantic Ocean. ” So warming is NOT due to man or CO2,” but oceanic heat transport …insolation (sunshine) and albedo… (reflectivity-clouds, snow, ice, etc)?
CoRev Please improve your reading comprehension. joseph was explaining the asymmetric distribution of warming between the hemispheres; he was not saying warming isn’t due to CO2. Overall the earth is warming, but that doesn’t mean it’s warming uniformly.
https://news.cgtn.com/news/2021-05-14/Brazilian-town-armed-with-China-s-Sinovac-vaccine-is-beating-COVID-19-10fOd8EQQJG/index.html
May 14, 2021
Brazilian town armed with China’s Sinovac vaccine is beating COVID-19
Life in Serrana, a small town located in the southeast state of Sao Paulo, Brazil, is returning to normal while the COVID-19 pandemic continues raging across the country.
With a population of some 50,000, the town has seen a plunge in both its COVID-19 cases and deaths, thanks to China’s Sinovac COVID-19 vaccine, the Wall Street Journal (WSJ) reported * on May 7.
In a vaccination campaign known as Project S, all Serrana’s eligible adults, accounting for nearly 98 percent of its adult residents, were inoculated with the Sinovac vaccine named “CoronaVac” between February and April.
“Infections are down 75 percent from a March peak in Serrana, while there have been no deaths from COVID-19 among the people who were fully vaccinated, suggesting CoronaVac is also effective against the aggressive P.1 variant sweeping the region,” the WSJ reported citing town officials.
“The numbers speak for themselves,” Serrana Mayor Leonardo Capitelli told the WSJ. “It worked!”
The mass vaccination coincided with Brazil’s second wave of COVID-19 infections, especially in February and March, with the resulting saturation of hospitals, and record number of cases and deaths due to the virus.
“The second wave hit us hard amid the vaccination, with full hospitals and exhausted doctors. But since the second dose was completed, the flow of patients has declined,” Capitelli told Xinhua, adding that there have been no “serious cases” since April 11 when the last participants received their second dose.
Capitelli called it “a source of pride” to be part of the campaign which will contribute to “a before and after” in the town.
Looking into the future, the mayor voiced hope that the town’s status as a bulwark against the coronavirus will help attract more businesses to the bedroom community of mostly residential homes and create local jobs.
* https://www.wsj.com/articles/brazilian-towns-mass-vaccination-creates-oasis-of-well-being-11620392401
https://news.cgtn.com/news/2021-07-02/Chinese-COVID-19-vaccines-approved-in-over-100-countries-11zDG1AyMyQ/index.html
July 2, 2021
Chinese COVID-19 vaccines approved in over 100 countries
Chinese vaccines have won a good reputation in the international community, with their safety and effectiveness widely recognized. More than 100 countries have approved Chinese COVID-19 vaccines for use, said Chinese Foreign Ministry spokesperson Wang Wenbin on Friday.
Since the outbreak of the epidemic, China has insisted that vaccines are first and foremost a global public good, said Wang. The country has provided over 480 million doses of vaccines to the international community in spite of huge domestic demand and limited supply, making it the largest supplier of vaccines in the world.
Besides its vaccine assistance to nearly 100 countries, China has also announced to provide an initial 10 million doses to the global vaccine distribution initiative known as COVID-19 Vaccines Global Access (COVAX).
The Chinese vaccines are the first doses available to many developing countries, which have hailed them as a “godsend,” said Wang.
Appreciated by countries including Equatorial Guinea, Zimbabwe, Chile, Antigua and Barbuda, the Chinese vaccines are said to be safe and effective, and helped local people in containing the COVID-19 as well as in realizing herd immunity….
Importantly enough, since knowing what is effective in coping with the coronavirus epidemic is fearfully important, the Chinese were able to control the Covid-19 outbreak by April 2020. Since April 17, 2020 there have been 2 coronavirus deaths in China. Cases have been remarkably few these months and overwhelmingly imported. These last 11 days there has been no domestic case, only imported cases that are detected with testing and immediately isolated.
I have the daily records of Chinese cases, symptomatic and asymptomatic, from January 2020 through July 3, 2021. * So in recording the administration of 1.28 billion doses of Chinese coronavirus vaccines domestically as of July 3, while the coronavirus has been controlled through the country, there should be an understanding of overall effectiveness.
Internationally, there are repeated expressions of gratitude for the distribution of vaccines from China. The President of Bolivia, Luis Arce, on July 1 expressed gratitude for China providing for enough vaccine doses for all adults by August.
* Often recorded on Econbrowser.
Here is a chart of global temperatures and CO2 concentrations over time:
https://i0.wp.com/www.adividedworld.com/wp-content/uploads/2017/05/PhanerozoicCO2-Temperatures.png?fit=1024%2C628
1) CO2 levels are at historic lows
2) Temperature and CO2 concentration show no correlation
Change my mind.
@ CoRev
“Change my mind”
Ever try to convince a 6 year old girl that broccoli is good for her long-term health?? Who is going to waste time on you man?? I’d rather run a straight razor over my left eye pupil.
Ok Moses,
Based on this chart: https://i0.wp.com/www.adividedworld.com/wp-content/uploads/2017/05/PhanerozoicCO2-Temperatures.png?fit=1024%2C628
which of these two statements is incorrect?
1) CO2 levels are at historic lows
2) Temperature and CO2 concentration show no correlation
@ sammy
BOTH of the two statements are incorrect.
Against my better judgement, to humor you, I clicked on a link that had a graph which looks like something Barkley Rosser would have given to his students to show what a normal distribution looks like. Disregarding that graph, I can tell you the following sammy:
1) CO2 levels are NOT at historic lows, they are rising.
2) Temperature levels and CO2 levels have a relatively high/close correlation
https://yaleclimateconnections.org/2020/03/why-have-carbon-dioxide-levels-risen-and-fallen-in-the-past/
https://www.ncdc.noaa.gov/global-warming/temperature-change
Here are some more recent numbers with some detailed numbers, I will lift a verbatim portion of it:
https://research.noaa.gov/article/ArtMID/587/ArticleID/2742/Despite-pandemic-shutdowns-carbon-dioxide-and-methane-surged-in-2020
“The global surface average for carbon dioxide (CO2), calculated from measurements collected at NOAA’s remote sampling locations, was 412.5 parts per million (ppm) in 2020, rising by 2.6 ppm during the year. The global rate of increase was the fifth-highest in NOAA’s 63-year record, following 1987, 1998, 2015 and 2016. The annual mean at NOAA’s Mauna Loa Observatory in Hawaii was 414.4 ppm during 2020.”
It goes on to mention how the Covid-19 caused economic slowdown helped lower the rate of increase, which otherwise would have been the highest increase on record:
” The economic recession was estimated to have reduced carbon emissions by about 7 percent during 2020. Without the economic slowdown, the 2020 increase would have been the highest on record, according to Pieter Tans, senior scientist at NOAA’s Global Monitoring Laboratory. Since 2000, the global CO2 average has grown by 43.5 ppm, an increase of 12 percent.”
It mentions that the last time CO2 was as high as it is now was “around” 3.6 million years ago in the Mid-Pliocene Warm period (which is a period of time related to climate, which would be a small portion of the time period within the Tertiary period referenced in your graph, but Tertiary is a term that relates to geography rather than climate).
“The atmospheric burden of CO2 is now comparable to where it was during the Mid-Pliocene Warm Period around 3.6 million years ago, when concentrations of carbon dioxide ranged from about 380 to 450 parts per million. During that time sea level was about 78 feet higher than today, the average temperature was 7 degrees Fahrenheit higher than in pre-industrial times, and studies indicate large forests occupied areas of the Arctic that are now tundra.”
sammy I don’t think you are a dumb guy, I really don’t, I’m not being facetious. My guess is you’re about average IQ, or at least average for your typical American. But if you get caught up in ideology, with a minutely small amount of sources for your news (especially radio or video, vs print), you’re doing yourself a serious disservice. And I encourage you to get away from FOX news, conservative radio, and at least TRY listening and reading news sources which may give you a healthy does of discomfort reading them. Maybe just make those “liberal” sources of news 25% of your overall news consumption. Even if you’ve been told those “dirty liberals” are out to grab your last dime.
And now, I’m going to go scratch a straight razor on my left eye pupil and see if it actually does feel worse than trying to educate someone who I am well aware I am not going to change their viewpoint anyway after typing and copy/pasting all of this. You might say, as a former “pretend teacher” In China, it was a “labor of love” for humanity typing all of this comment sammy. Either way, have a good day.
*healthy dose of discomfort, excuse me.
I should apologize, I made an error in terminology. The Tertiary period relates to Geology–NOT geography as I incorrectly stated in my comment. Sorry for the error.
It almost makes one think I didn’t receive my tertiary education. But seriously…….
sammy Your horizontal scale is deliberately misleading because it compresses all of human history into a single pixel. To the best of my knowledge humans weren’t around hundreds of millions of years ago. And the earth’s oceans and continents looked very different than they do today. The sun also produced less energy. As to your claim that there is no correlation between CO2 concentrations and temperature, get off your butt and try a simple lab experiment. The relationship between triatomic molecules and temperature is well understood both in the lab and at the quantum level. What you need to try and explain is how it is NOT possible to see increasing temperatures as CO2 concentrations increase.
At least his little graph has this clear caption “millions of years ago”. Now when we ask Econned to clearly label his graph, he gets all emotional and quite angry.
Maybe we can get Sammy and Econned to write a paper on the effects of tax cuts a million years ago on today’s economic growth rate!
I label graphs properly – I cannot helping the reader is innumerate/illiterate. Thanks for always being a fan of my work!
2slugbaits,
I’m not saying that increased CO2 does not enhance heat trapping. I am saying that this effect is insignificant compared to the other myriad and much more powerful forces that impact global temperature. After all, the Earth has had wide swings in temperature long before Al Gore and Leonardo DeCaprio were taking private jet flights. Researchers have correlated temperature with the sun’s intensity, solar winds, ocean currents, Earths orbit and axis, cloud cover, volcanic activity, changes in magnetic fields, snow cover etc. etc. but not CO2, until the last 50 years of the billion or so.
CO2 is an insignificant variable, both in quantity, and the historical temperature record.
sammy Those previous “swings” occurred over time scales that dwarf humanity’s time on earth. And they all had natural causes. And most of those other historical forces ought to be pushing the earth towards cooler temperatures today, not warmer temps. CO2 traps heat. The more CO2 we pump into the atmosphere the hotter it will get. CO2 concentrations of 420ppm might sound like a small number to you, but that’s just because you’re basing that on your intuition formed by your everyday experiences. That’s a bad way to approach science. A good rule of thumb is that anything that sounds intuitive is probably wrong. That’s why we need experts; to correct our faulty and unreliable intuitions.
But since you don’t think increasing CO2 concentrations are responsible for the coincidental industrial era rise in both GHGs and temperatures, let’s hear you explanation. And just blithely babbling some nonsense about unexplained natural variability isn’t an answer. That’s just a case of magical thinking. It’s like saying God did it. Specifically, let’s hear your explanation in detail.
“CO2 concentrations of 420ppm might sound like a small number to you,”
It is a small number for anyone.
PPM stands for Parts Per Million. So for every Million molecules in the atmosphere there are 420 CO2 molecules. So it’s a sea of 999,580 white balls to 420 black balls. That is an increase of 40 black balls in a sea of 999,540 white balls at 380 ppm. You think that an extra 40 black balls will determine global temperature?
sammy That’s not small. Here’s an example of a very small number that makes you very dead. For a typical 175 pound man a lethal dose of A-230 Novichok is only one part in 3.85 billion. Again, my advice is to ignore what your intuitive gut tells you is a small number.
And oh by the way, the difference between an ice covered earth and pre-industrial society is less than 100ppm.
2slugs, wrong again! “The relationship between triatomic molecules and temperature is well understood both in the lab and at the quantum level. What you need to try and explain is how it is NOT possible to see increasing temperatures as CO2 concentrations increase.”
If that were true the Climate Models would predict/project temperatures with some precision. They do not!
Answer my two questions. They are easy if the science is correct. You do believe in the science?
Oh gag, Sammy.
Two points on this.
1) While the data further back is very noisy, there does in fact appear to be some correlation, although imperfect.
2) Did you notice the time scales you have there? 100 million years covers a small part of the far right of your graph. So, sorry it does not remotely pick up that CO2 and temperature have been rising over the last century and a half or so.. You are simply wrong that both are at all time lows. This is one of the stupidest comments made on this thread so far.
“This is one of the stupidest comments made on this thread so far.”
It is stupid but far from being the stupidest – Moses tirades on the NBA playoffs take this title! Oh wait – that was another thread!
Stryker: “Unless you understand the 99% of the energy coming from natural processes with a precision well below 1%, i.e. understand the internal variability of the climate very precisely, you really can’t say much about the effect of human activities on temperature without significant uncertainty.”
This is similar to a claim that you really can’t call thermodynamics a science unless you can account for the movement of all of the gas molecules in a cylinder. Or Spencer’s claim that only there are only 42 CO2 molecules per 100,000 in the atmosphere, so no big deal.
Small differences can be measured and can be modeled and there are decades of science supporting it.
Joseph: “Small differences can be measured and can be modeled and there are decades of science supporting it.” Explanations for the “Small differences” in temperature can be HYPOTHESIZED, but when those hypotheses can not accurately predict/project, they must be modified. Except for climate change hypotheses, which are never critically analyzed.
CoRev Speaking of predictions, for years…no decades, you’ve been predicting that the earth was just about to enter a cooling phase any day now. Your climate predictions are about as good as your soybean price predictions. The fact that CO2 will raise temperatures is not a mere hypothesis. It’s testable and has been tested in the lab. That part of climate science is not in dispute and hasn’t been in dispute for over a hundred years. The tricky part is modeling the rate at which the earth will warm given complicating factors like heat sinks, lags, economic activity, volcanic activity, etc. To the extent that climate scientists have missed their predictions, it’s almost always been because temperatures rose faster than predicted. You on the other hand have a perfectly consistent record of being wrong every time.
2slugs, argue with what I said and not what you think I said. Also: “To the extent that climate scientists have missed their predictions, it’s almost always been because temperatures rose faster than predicted.” Not just wrong but actually opposite of what history shows. Temperatures as measured have been dramatically lower than those PREDICTED/PROJECTED by the models.
Please do your due diligence of research. I’ll help: https://iopscience.iop.org/article/10.1088/1748-9326/ab9af7
“…first, the modeled tropospheric trends are biased warm throughout the troposphere (and notably in the upper troposphere, around 200 hPa) and, second, that these biases can be linked to biases in surface warming. As such, we see no improvement between the CMIP5 and the CMIP6 models….”
And
https://agupubs.onlinelibrary.wiley.com/doi/10.1029/2020EA001281
“4 Conclusions
The literature drawing attention to an upward bias in climate model warming responses in the tropical troposphere extends back at least 15 years now (Karl et al., 2006). Rather than being resolved, the problem has become worse, since now every member of the CMIP6 generation of climate models exhibits an upward bias in the entire global troposphere as well as in the tropics. …”
This last study shows how the models’ are tuned to the back cast temperature conditions, but then diverge HIGH NOT LOW from contemporary temperature soon after they are start to predict.
Really? Another piece of garbage written by McTrickster?
I wonder if CoRev regularly take small doses of cocaine products. I’m sure this would have no impact on his well being.
If you look at Fig. 4, Slugs, you’ll see that the temp anomaly from 1900 to 1980 is relatively constant. It only really starts to diverge after 1980. So after 1980 you need some sort of hemispheric explanation or something to do with measurement, or both. Remember, these are surface temperatures, ie, taken from land measurement stations. If these stations have not moved, then I would expect to see material temperature gains in China simply due to heat island effect. Here’s a nice video on China’s urbanization: https://www.youtube.com/watch?v=ndrQSqtrmgo
I’d also add that I think the historical sea temperatures are essentially worthless, maybe a bit better in the last twenty years or so. It’s 5000 miles of open ocean from India to Antarctica; 4200 miles from Madagascar to Australia; 2000 miles from Australia or South Africa to Antarctica; 8,000 miles from Australia to Peru. In some of these vast areas, there is very little shipping. So how good are ocean surface measurements anyway? And if we go back fifty years, ocean temps have to be little more than a guess.
That’s why I prefer the satellite data. It’s taken uniformly, regularly the same way over most of the globe. It’s apples to apples, in most cases.
http://www.prienga.com/blog/2021/7/3/surface-temperature-anomalies
Gee Stevie self promotes his own blog. But wait a set of graphs with a clear upward trend. OK – time to read Stevie’s little interpretation of his own graphs. What? He wrote nothing? Nothing at all. Odd since he is normally such a long winded gas bag.
Steven Kopits Sorry, but the satellite’s position relative to the weighted geometric center of the atmosphere is anything but constant. One reason among many as to why you should take satellite data with a grain of salt. And the way the sequential satellite data is spliced together makes any measurement errors with ground based measurements look trivial. You really need to learn a lot more about how satellite data is constructed before putting too much faith in it.
As to the strong divergence emerging after 1980, you shouldn’t be surprised. There are lots of reasons why you see that. The most obvious is that over that 80 year period CO2 concentrations only increased by about 40 ppm. Over the next 40 years CO2 concentrations increased by about 60 ppm. And as Barkley pointed out, back in the bad old days we used to pump a lot of sulfur dioxide into the atmosphere, which tended to cool the earth’s atmosphere.
2slugs, Climate Change occurs in the troposphere and is only measured at the surface. If you are 2slugs I guess you think that a hurricane only happens at 2 meters, the surface height of ground climate stations.
It is for this reason along with the wider coverage of the satellite that I prefer satellite data.
CoRev,
Apparently neither you nor Steven Kopits seems to be aware of the problems due to orbit decay regarding satellite data. It has been shown that it is understating warming. Most serious climatologists have been correcting for the urban heat effect for some time, despite your claims to the contraty.
See carbonbrief.org/major-correction-to-satellite-data-shows-140=faster-warming-since-1998 .
I note 2slug made a mention of this. I happened to personally know the late Fred Singer, father of the weather satellites and long a global warming skeptic. But even he recognized this problem before he died.
I would guess, Barkley, that those receiving millions of dollars every year to operate the satellite system have some sense of calibration issues. Indeed, I am pretty sure that, if you cared to check, there are plenty of papers written on the topic, including how the satellite data is adjusted to compensate for these factors.
Steven Kopits Here’s one of the RSS scientists who is at least honest enough to talk about the problems with satellite data. Even he believes surface instruments are more accurate.
https://www.youtube.com/watch?v=8BnkI5vqr_0
Steven Kopits It’s not just calibration issues, which are formidable in and of themselves. The bigger problem is that the height of the troposphere (i.e., what the satellite is supposed to measure) changes with the seasons and the latitude. Since the troposphere contains about 85% of what we call the atmosphere, that means satellites even in a fixed position have difficulty measuring the weighted geometric center of the troposphere because that geometric center moves around.
Actually, Steven, it took them a long time to figure this out, for all the millions you think they get. Again, it took Fred Singer a long time to admit there was a problem. They have been working on making those adjustments, but then others have been working on making the adjustments to deal with the urban heat bias problem, which has been known about for a lot longer than the problem with the satellite data.
Then we should end satellite measurements, if they are so unreliable.
seal level is a pretty good indicator that the energy content of the earth is increasing yearly.
Baffs –
Sea level has been rising by one foot per century since at least the late 1800s. It still is.
https://sealevel.nasa.gov/understanding-sea-level/global-sea-level/overview
Baffled: “seal level is a pretty good indicator that the energy content of the earth is increasing yearly.” So what? Good or bad? If bad can it be changed?
steven, i fail to see how your comment in any way contradicts what i said. please explain.
Steven Kopits Quick high school geometry question. What happens to the volume of a sphere if the radius of a sphere grows linearly?
Well, when did man-made global warming start, Baffs? If it started in 1880, then temperatures are increasingly at the pace of 0.9 deg C. That’s indistinguishable from a recovery from the LIA. If it started in 1980, then why was sea level rising at the same pace in 1880?
steven, you are going to need to lay out your argument a little more clearly if you want a response. i am simply not following exactly what your point is.
i will mention that sea level rise will lag a bit from temperatures, especially when it comes to the impact from ice shelf melt. it takes some time for the water to melt and move to the ocean.
but i also will point out what 2slugs said. while it is an approximation, you do realize that it takes more water (or increased thermal expansion) for sea levels to rise each year due to the incremental increase in the radius of the sphere (measured as the sea level). each additional 1 foot layer of sea level requires a larger volume than the previous 1 foot sea level rise. so if you are measuring sea level yearly, and it appears to be a linear trend from one year to the next, that means that each year the volume of water (and heat) has grown more than the previous year. this indicates the global warming issue is getting worse, not staying constant. a steady increase in sea levels is problematic to begin with.