An increasing amount of GDP is accounted for by counties with rising fatalities, a slight change from a couple weeks ago.
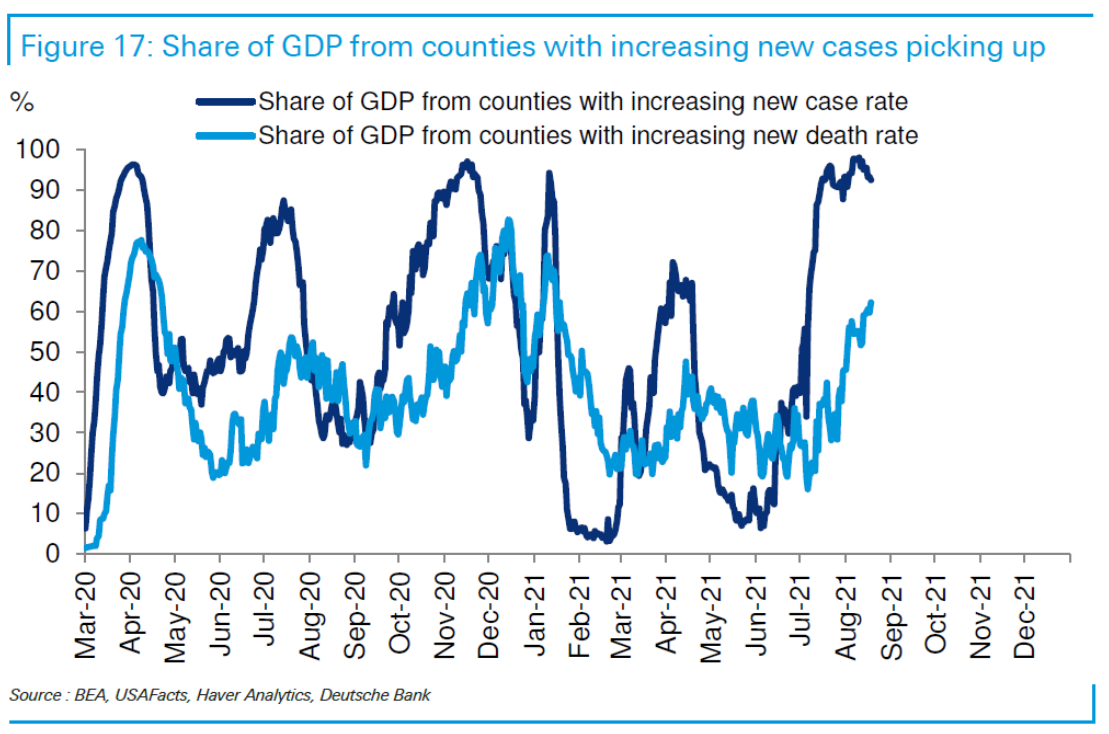
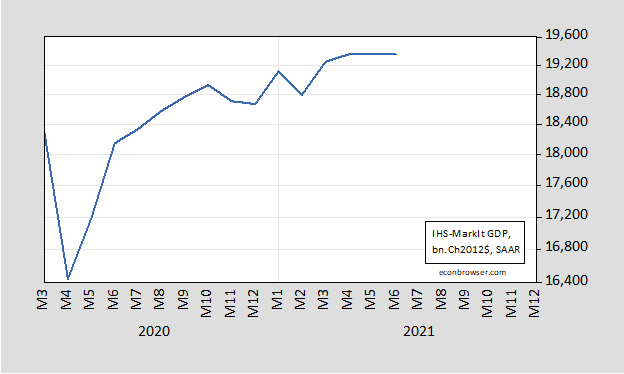
Top: Share of GDP coming from counties with rising new cases (dark blue), deaths (light blue). Bottom: GDP in billions of 2012$, SAAR (blue). Sources: DB, Covid Impact Tracker , 19 August 2021, and IHS-MarkIt, release of 2 August 2021.
I’ve placed stacked the two graphs so that one can get some idea of how the waves correlate with the pace of recovery. It’s hard to see a clear pattern, except in the first wave where the decline affected counties correlates with a very rapid recovery in economic activity as measured by monthly GDP as estimated by IHS-MarkIt.
On 8/18, Goldman Sachs downgraded Q3 growth estimates from 9% to 5.5%, partly on delta variant concerns. Yesterday, Wells Fargo observed:
Delta Variant Clouds the Outlook
The Delta variant in the United States has cast a cloud over the outlook. New daily cases continue to move higher and are at their highest level since February. Hospitalizations are on the rise, too, amid the more virulent strain, and this week brought reports that some states are nearing full capacity for intensive care beds. From an economic perspective, it remains to be seen how activity evolves during this latest outbreak, with the surge in cases beginning in late July. High-frequency measures on seated diners and the number of people through TSA checkpoints suggest service activity has plateaued but not materially deteriorated thus far (see chart). The sideways move in activity, in conjunction with weaker-than-expected retail sales in July, suggests some downside risk to our personal spending estimates for the third quarter.
So far, the implications are for modest reductions in predicted growth rates, rather than large.
As of August 19th, the annual growth rate implied by the (13 week average of the) Weekly Economic Index (WEI) is 9.53% for a hypothetical quarter ending August 14th. That’s still strong growth, nationwide.
Our economic recovery depends in large part to our ability to defeat this virus. Which means the most important things we can do is NOT take cuts for the rich or freedom (whatever that means) BUT getting everyone vaccinated and social distancing/masking up. OK Faux News viewers – call me a Socialist for simply pointing out the obvious.
https://www.youtube.com/watch?v=ujU27CD-mtM
Carlos Santana went on in the early part of the Central Park concert – so he was not caught up in that rain storm. Enjoy!
http://www.xinhuanet.com/english/2021-08/22/c_1310141841.htm
August 22, 2021
Over 1.93 bln doses of COVID-19 vaccines administered in China
BEIJING — More than 1.93 billion doses of COVID-19 vaccines had been administered in China as of Saturday, data from the National Health Commission showed Sunday.
[ Chinese coronavirus vaccine yearly production capacity is more than 5 billion doses. Along with over 1.935 billion doses of Chinese vaccines administered domestically, another 800 million doses have been distributed internationally. A number of countries are now producing Chinese vaccines from delivered raw materials. ]
https://news.cgtn.com/news/2021-08-22/Chinese-mainland-reports-32-new-confirmed-COVID-19-cases-12VuTjtHyvu/index.html
August 22, 2021
Chinese mainland reports 32 new COVID-19 cases
The Chinese mainland recorded 32 new confirmed COVID-19 cases on Saturday, with 4 being local transmissions and 28 from overseas, the latest data from the National Health Commission showed on Sunday.
In addition, 19 new asymptomatic cases were recorded, while 508 asymptomatic patients remain under medical observation.
This brings the number of confirmed COVID-19 cases on the Chinese mainland to 94,631, with the death toll unchanged at 4,636.
Chinese mainland new locally transmitted cases
https://news.cgtn.com/news/2021-08-22/Chinese-mainland-reports-32-new-confirmed-COVID-19-cases-12VuTjtHyvu/img/29840a9d901e4ea685f9f6ff7b0117ac/29840a9d901e4ea685f9f6ff7b0117ac.jpeg
Chinese mainland new imported cases
https://news.cgtn.com/news/2021-08-22/Chinese-mainland-reports-32-new-confirmed-COVID-19-cases-12VuTjtHyvu/img/695556b917914c4b9342e09eae3e9875/695556b917914c4b9342e09eae3e9875.jpeg
Chinese mainland new asymptomatic cases
https://news.cgtn.com/news/2021-08-22/Chinese-mainland-reports-32-new-confirmed-COVID-19-cases-12VuTjtHyvu/img/a5a1e9196dc74aeab92b5b26d82b8331/a5a1e9196dc74aeab92b5b26d82b8331.jpeg
https://www.worldometers.info/coronavirus/
August 22, 2021
Coronavirus
United Kingdom
Cases ( 6,492,906)
Deaths ( 131,640)
Deaths per million ( 1,928)
China
Cases ( 94,631)
Deaths ( 4,636)
Deaths per million ( 3)
I am not sure what this means, when pretty much the whole country has increased new cases and deaths. If you go from a smaller chunk of the country to a larger chunk of the country you expect to cover more of the total GDP.
This time around the GDP will not likely take as bad a hit as spring 2020. Sectors like entertainment and restaurants will take a hit – but otherwise people have learned to do consumptions on line.
The wild card is schools. When opened with no precautions they will almost certainly produce a lot of quarantined kids/parents. That could force a lot of adults to stay home (taking care of kids or themselves). Some places seem to have given up on quarantine of exposed kids which is an interesting and unapproved experiment on human subjects.
Agree with everything.
Re your first paragraph: I think this is a case where we need to pay attention to levels as well as changes, or at least the size of the changes. IIRC,
two weeks ago, the county where I live suddenly went from 5 cases per day to 20, in a population of roughly 200,000. Yes, it’s an increase. A 300% increase looks alarming yet is still a minuscule share of the population, and likely an infinitesimal part of our local GDP.
Of course, since then case rates have increased, and we’ve resumed a daily death count. We’re a blue island in a sea of an ungovernable tribal region, so I would classify our situation as concerning, not alarming, so far. I am not optimistic about the next few months, either locally or, especially, nationally.
That increase is alarming if your vaccination rate is low. Since the virus spreads in an exponential way, small numbers quickly become large numbers unless mitigation efforts are deployed. This is where vaccines and masks can impact that exponential spread effectively.
https://watson.brown.edu/costsofwar/files/cow/imce/papers/2021/Costs%20of%20War_Bilmes_Long-Term%20Costs%20of%20Care%20for%20Vets_Aug%202021.pdf
August 18, 2021
The Long-Term Costs of United States Care for Veterans of the Afghanistan and Iraq Wars
By Linda J. Bilmes
Summary
Between 2001 and 2050, the total costs of caring for veterans of the post-9/11 wars are estimated to reach between $2.2 and $2.5 trillion. This includes the amount already paid in disability and related benefits and medical care, as well as the projected future cost of lifetime disability benefits and health care for those who have served in the military during these wars. This estimate is double the author’s previous projections in 2011 and 2013. Several factors account for this dramatic increase. These include: extraordinarily high rates of disabilities among this cohort of veterans, greater outreach by the federal government to inform veterans of their eligibility for benefits, more generous eligibility and benefit compensation, as well as more advanced and expensive medical care, and substantial investment by the Department of Veterans Affairs (VA) to process and administer claims and benefit programs and deliver health care. Federal expenditures to care for veterans doubled from 2.4 percent of the U.S. budget in FY 2001 to 4.9 percent in FY 2020, even as the total number of living veterans from all U.S. wars declined from 25.3 million to 18.5 million.
Yet the majority of the costs associated with caring for post-9/11 veterans has not yet been paid and will continue to accrue long into the future. As in earlier U.S. wars, the costs of care and benefits for post-9/11 veterans will not reach their peak until decades after the conflict, as veterans’ needs increase with age. This time around, veterans’ costs will be much steeper. More than 40 percent of the troops who have served in Iraq, Afghanistan and related locations have already been approved to receive lifetime disability benefits.
This paper provides evidence of the strain that veterans have borne during this conflict. These young men and women have served longer tours of duty, been exposed to more raw combat, and suffered much higher rates of disability, than during any previous U.S. war. The author warns that the United States risks defaulting on our financial obligations to this generation of veterans; one solution would be to create a Veterans Trust Fund to track and set aside funds for these commitments. Additionally, the federal government can make simple changes that would significantly reduce the burden on troops as they transition to veteran status; for example: to automatically enroll all veterans in VA healthcare within 60 days of discharge from active duty.
Linda J. Bilmes is the Daniel Patrick Moynihan Chair in Public Policy and Public Finance at the Kennedy School, Harvard University.
https://watson.brown.edu/costsofwar/files/cow/imce/papers/2021/Costs%20of%20War_Bilmes_Long-Term%20Costs%20of%20Care%20for%20Vets_Aug%202021.pdf
August 18, 2021
The Long-Term Costs of United States Care for Veterans of the Afghanistan and Iraq Wars
Estimated Budgetary Costs for Post-9/11 Veterans Care
Current Projections for costs 2001-2050 *
Veterans Medical ( $853 – 903)
Veterans Disability and Benefits ( 1,228 – 1,497)
VA Administration ( 100 – 106)
Social Security Disability ( 50 – 69)
Total ( $2,231 – 2,575)
* Billions of dollars
Federal expenditures to care for veterans doubled from 2.4 percent of the U.S. budget in FY 2001 to 4.9 percent * in FY 2020, even as the total number of living veterans from all U.S. wars declined from 25.3 million to 18.5 million.
* 4.9 percent of 6.6 trillion dollars = 323.4 billion dollars
i don’t know how Goldman can figure 5.5% third quarter growth….i figure real PCE goods to be down 1.8% in July, putting them 1.5% lower than May and 3.9% lower than April…if real PCE services is anywhere close, that’s gonna be a pretty big hole for GDP to climb out of..
rjs: For what it’s worth, as of today, IHS-MarkIt estimates Q3 PCE at 2.1% SAAR, as part of their 6.0% nowcast for GDP.
they must be assuming a pretty big inventory build…with PCE ~70% of GDP, for GDP to grow 6.0% with a real PCE growth of 2.1% we’d have to see nearly 15% growth in the rest of GDP…
Couple of things –
1) Retail service consumption jumped in July, but not enough to offset the drop in vehicle sales and online sales of goods. The drop in durables You’ve identified may exaggerate the drop in overall PCE.
2) The NY Fed nowcast for Q3 is 3.5%. St. Louis Fed nowcast is at 6.1%. Methodological differences are driving bit differences in forecasts right now. Both Feds report model results without adjusting for information that is not among the model’s standard inputs. You are allowed to adjust. Right now, adjusting the model’s output probably makes for a better estimate.
As was observed in earlier waves of infections, the economic outlook depends on the course of the pandemic and the pandemic’s course is uncertain.
The policy response is a big deal. Unemployment benefits filled a huge gap in prior waves, but that seems unlikely this time. Local policy matters and positions have hardened.
I’ve seen analysts talking of a mini-recession in late August. I think the point of such talk is that as growth slows, a brief (2 week?) contraction becomes likely. It’s not clear to me that a 2 week contration is is all that important for welfare or the economic outlook, but it sells analysts letters.
I still think September brings the big hiccup. The coincidence of ending supplemental unemployment benefits and a school-induced acceleration in infections ain’t good.
Is recent information shutting up the Inflation Chickenhawks? My news feed is filled with scare stories about bubble-this, bubble-that. The only real story seems to be Delta and how fast we can get the South vaccinated. And supply chain problems that international in scope and will probably extend through 2023.
Supply chain? Here’s The Shipping News (apologies to Annie Proulx).
Bloomberg reports optimism regarding the port at Ningbo because five container ships have berthed there in the past week. That amounts to between 5 and 10 TEUs in a week’s time for a port which last year handled 28.7 million TEUs. Shipping company CMA “thinks” normal operation will resume in a couple of weeks, but as long as Covid is calling the shots, nobody really knows. Optimism springs eternal?
And there’s this: “The pressures on global supply chains have not eased, and we do not expect them to any time soon,” said Bob Biesterfeld, the CEO of C.H. Robinson, one of the world’s largest logistics firms.
Not all the shipping news is bad. The Port of Houston, where Pacific Rim shipments account for only about 15% of traffic, set a new record for total activity ( in TEU terms) in July, up 27% from a year earlier (note caution is needed in with y/y comparisons right now).
By the way, China accounts for about 85% of shipping container production (if memory serves). When Chinese exports slow, containers become scarce anywhere that container trade is roughly balanced. Vietnam, for instance, but not the U.S. Container prices are up between 15% and 300% from earlier in he year, depending on where you look.
macroduck,
Something not right …
“five container ships have berthed there in the past week. That amounts to between 5 and 10 TEUs in a week’s time”
Not by a long shot. Five standard (…) ships might together hold 100,000 to 150,000 TEUs.
In Ningbo, typical turn-around time might be 2 days, maybe less.
Yikes, big mental error. Of course. Five ships, not five containers.