Today, the BEA released estimates for the US net international investment position (NIIP) — the difference between what assets US residents (including the government) owns abroad and what US assets foreign residents and governments own. The decline in the value as a share of GDP has has stopped, and despite being a large negative number, US net income — income received from assets owned by the US minus income paid on assets owned by foreigners — remains positive. A new CBO working paper (Fried, “CBO’s Model and Projections of U.S. International Investment Holdings and Income Flows” ) tackles the reasons for this seemingly paradoxical phenomenon, and the prospects for its continuation.
First, the Q2 figures.
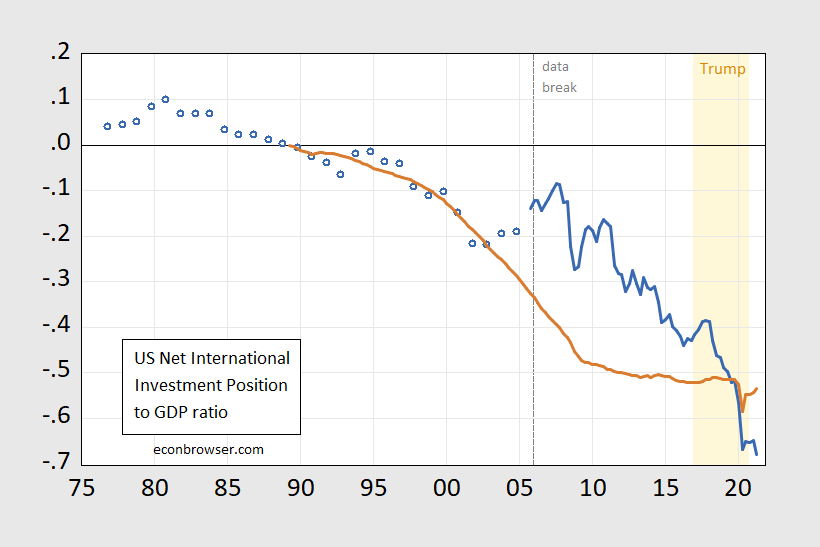
Figure 1: US net international investment position (blue), an cumulative current account balances since 1989Q3 (tan), both as a share of US GDP. Current account figures are on NIPA basis. Light orange shading denotes Trump administration. Source: BEA via FRED, and author’s calculations.
As discussed in previous posts (e.g., [1]), the US NIIP has deviated substantially from the cumulative current account, largely because of valuation effects (exchange rates, market values of stocks, bonds, fixed investment), as shown in Figure 6 in CBO’s Model and Projections of U.S. International Investment Holdings and Income Flows. Those valuation effects have been working against the US lately, so that the NIIP is now substantially below the cumulated current account.
Now despite the US having an enormous net negative position, net income has been — and remains — positive. This is shown in Figure 24 from the working paper:
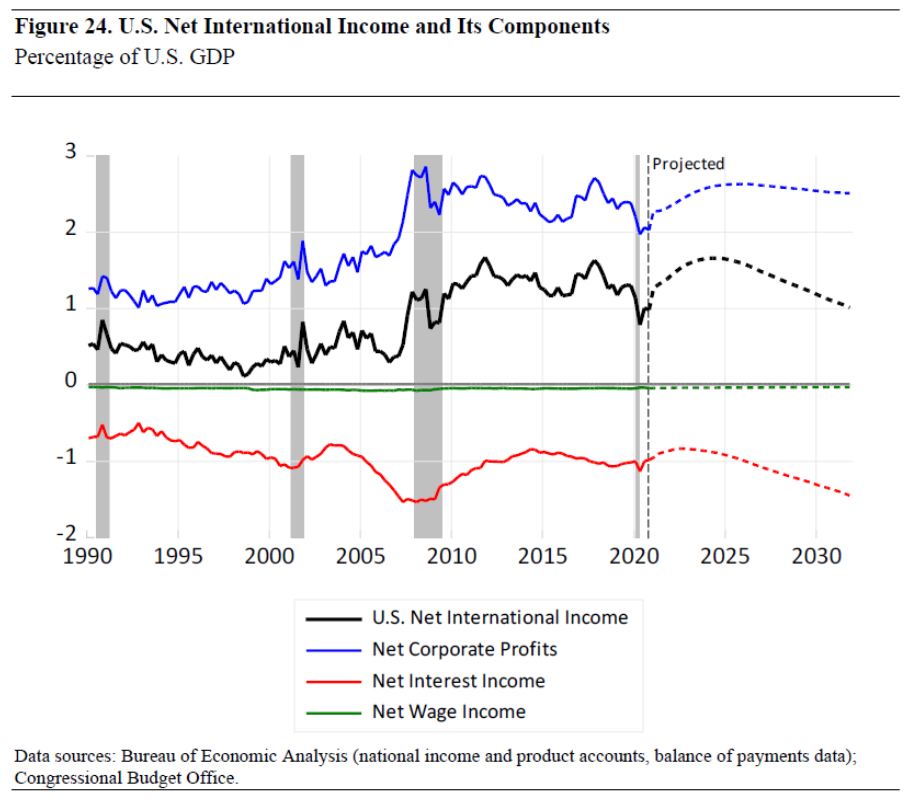
Source: Fried (2021).
Why this outcome? From the abstract:
Since 1982, growth in the value of foreign investments in the United States has exceeded growth in the value of U.S. investments abroad and, as a result, the U.S. net international investment position has been negative and trending lower. Even though the value of foreign investments in the United States has exceeded the value of U.S. investments abroad, the total income earned by U.S. investors on their foreign asset holdings has historically exceeded the total income earned by foreign investors on their U.S. holdings. The United States is able to earn positive net international income despite its negative net international investment position because the average yield on U.S. investments abroad has exceeded the average yield on foreign investments in the United States.
The Congressional Budget Office uses its international financial forecasting model to project international capital and income flows. It includes two types of forecasting equations: those that project international asset positions and those that project the income generated by those assets. Over the 10-year forecast period, growth in the value of U.S. holdings of foreign assets is projected to exceed growth in the value of foreign holdings of U.S. assets; consequently, the U.S. net international investment position is expected to rise modestly. In addition, the international yield differential is projected to remain high and roughly steady over the next decade. As a result, net international income is expected to rise as a share of U.S. gross domestic product through 2023 before declining through 2031 (because of higher interest payments on U.S. federal debt held by foreign investors). [emphasis added]
The US is projected to retain this positive net income flow. The calculations are carefully laid out in the working paper, which is well worth reading if one is interested in how the US might continue to enjoy this situation.
Those who are interested in how these calculations might link up with the ability of the Federal government to finance deficits can refer to this section.
Official Holdings of U.S. Federal Debt. CBO projects growth of foreign official holdings of U.S. federal debt assets as a residual from its projections of the current-account balance, projections for all other asset classes, and the relationship between the current account and changes in the NIIP. This variable was chosen as a residual because it is driven by factors that are hard to measure. For example, it is difficult to explain the growth in official debt holdings in the late 1990s and early 2000s as a function of existing model variables.
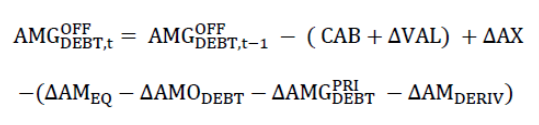
The equation used to project official holdings of U.S. federal debt exploits the relationship between the current account and changes in the NIIP. Changes in the NIIP can be explained by two factors, net purchases of international assets and changes in asset valuations:
In that equation, the U.S. current-account balance, CAB, is a measure of net capital flows into a country (if positive) or out of a country (if negative).26 The CAB is also equal to the sum of the trade balance (exports minus imports), net international income, and net unilateral transfers. When U.S. imports fall, the U.S. trade deficit also falls. That decline in the trade balance necessitates fewer capital outflows to pay for that smaller U.S. trade deficit; those changes increase both the U.S. CAB and the NIIP. When U.S. net income from abroad rises, that change in income is a capital inflow; it increases the U.S. CAB and the U.S. net international investment position.
Projections of the current-account balance are driven by changes in national saving and investment. Increases in domestic saving (relative to domestic investment) reduce a country’s reliance on foreign capital to fund domestic investments and increases the country’s NIIP. CBO projects future valuation changes ΔVAL as a function of the long-run average of past valuation changes as well as projected changes in the trade-weighted value of the dollar. Then, based on the forecasts for all other international asset variables, CBO projects foreign official holdings of federal debt using the following equation:
In CBO’s model, projections of foreign official holdings of U.S. federal debt depend on projections of all other international asset and income variables. For example, those holdings will be sensitive to changes in the U.S. trade balance.27 Holding all else equal, CBO estimates that a growing trade deficit will increase the current-account deficit and, in turn, foreign holdings of U.S. federal debt. In addition, those holdings will grow with increases in U.S. holdings of foreign assets but will decline with increases in all other foreign holdings of U.S. assets, CBO projects. To the extent that projected valuation changes are not reflected in changes in the value of other international assets, those changes will flow through to CBO’s projected foreign official holdings of U.S. federal debt.
One observation relevant for those of us used to a seemingly endless appetite for US Treasury debt on the part of the foreign official sector (i.e., central banks, SWFs) — the appetite seems to have moderated.
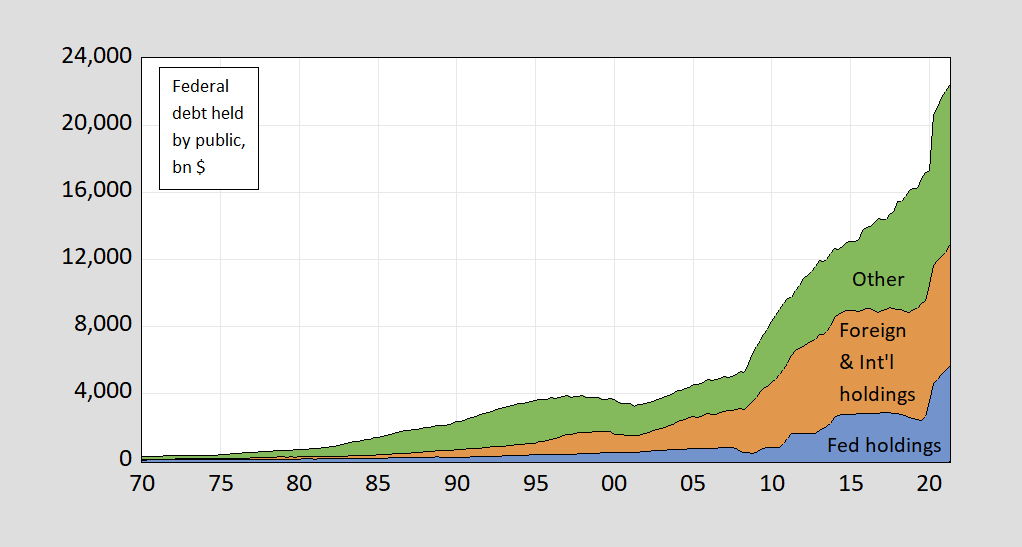
Figure 2: Holdings of US Treasury debt held by the public, by Federal Reserve Banks (blue), by foreign and international organizations (tan), and by all other (green), all in billions of dollars, nsa. Source: Treasury via FRED, and author’s calculations.
This has long been quite the apparently paradoxical phenomenon. What strikes me looking at this post is that while the US net investment position was substantially getting more negative during the period after the Great Recession, the net investment income of the US actually rose quite noticeably to be well above what it had been over the first decade of the 21st century, although it has slipped back somewhat more recently.
@ Barkley Rosser
You say: “What strikes me looking at this post is that while the US net investment position was substantially getting more negative during the period after the Great Recession, the net investment income of the US actually rose quite noticeably to be well above what it had been….. ”
I agree with you it is paradoxical and somewhat surprising. I think “counterintuitive” is actually the best way to describe it. But not that terribly surprising when you stop to think about it some more. Think about how foreign money comes rushing into American government bonds when America has a financial crisis or when global risk rises. Or how America’s trade deficit rises simultaneously with an American economic upturn. Those counterintuitive phenomena aren’t terribly different than what Menzie/Fried/CBO describe above.
Think about how the entire trump administration (at least in its public stances) didn’t see that a “strong dollar” will contribute to increasing the trade deficit. Now that’s not as good an example as the ones in my first paragraph just above, but it still to a lesser degree illustrates the point that if you just go 1 step down from the surface things that are “surprising” really aren’t that surprising.
Would you believe me if I told you this is the first link that popped up on “my replacement for using my brain”= Google search
From the man all the women love: Brad Setser
“But the U.S. (famously) runs an overall surplus in the investment income account. And that is thanks to the excess return American firms earn on their direct investment abroad.
Some call this dark matter and find it mysterious. I tend to think it is a fairly straight-forward reflection of tax arbitrage—the return differential goes away if you net out the excess profits U.S. firms report in obvious low-tax jurisdictions—and thus fairly prosaic.”
https://www.cfr.org/blog/understanding-us-investment-income-balance-wonky
Don’t you hate those damnded durned smart guys who don’t have to Google (like I do) to find answers but do it on their own?? Damnded durned Setser. May all his ancestors 15 generations back eat maggots for dessert.
Yes, like pgl and I and various others, Brad has been posting on this stuff for a long time. What is surprising now, as I noted in my comment above, is that it seems that the scale of the net positive flow has increased in recent years even as this net indebtedness has continued to expand. One would sort of expected it to have narrowed, but it didn’t. Has gone the other way until very recently.
Oh, I was slightly off in my comment. The big surge in net payments immediately preceded the 2008 crash, after which it briefly declined, but then went back up again pretty quickly and continued to increase for some time. This particular more recent development still remains unexplained to me by either this post or anything else I have seen.
Brad did write that Dark Matter version in early 2018 but even more interesting was his late 2017 transfer pricing story, which he linked to be but here it is:
https://www.cfr.org/blog/apples-exports-arent-missing-they-are-ireland
As we have noted, this goes back to 2005. Even the always excellent Willem Buiter has written on the various explanations of this puzzle.
BTW when Brad says Apples (or Google’s or Nike’s or Big Pharma’s) end up in Ireland, they are not taxed at 12.5% as 80% of those profits migrate to places like Bermuda. It is called the Double Irish Dutch Sandwich, which sounds like a nice way to enjoy dinner.
My initial guess would be that it’s closely related to exchange rates and the value of the dollar.
“currency composition” of the FDI??~~The differences in “currency composition” of FDI of the different countries vs USA’s “currency composition” of FDI??
Probably not so much. It is almost certainly tied to the “safe haven” role of the USD tied to its role as the most widely used global currency, even if there are many reasons why this might be viewed as absurd, notably the role of US financial market instabilities in bringing about the Great Recession. But as I have noted now in two comments, the net investment income flow into the US only got larger after that particular crisis.
Foreigners are willing to accept low returns to hold the safe USD, even as US investors abroad pickily demand high returns. The funny thing is that quite a few other nations have lower interest rates most of the time than does the US. But our investors are clearly avoiding those low yield assets for ones providing higher returns.
If we’re still talking income (NII) flows, which is what I was referring to, and your emphasis on the increase before the recession, I still think that would relate more to exchange rates.
Page 9 of Daniel Fried:
“Differences in the mix of international assets held by foreign investors and U.S. investors explain a small portion of the international yield differential.
Moses,
Well, it is most definitely NOT due to exchange rates. Throughout this entire period because of the global role of the USD it has been overvalued. How do we know that? Because the US has consistently run both trade and current account deficits throughout this whole period, last surplus on either of those back in the 1970s.
So, running current account deficits means that we have been running capital account surpluses, foreigners buying more of our assets than we have been buying of theirs. The rate of this has varied over time, but the trend has not changed. This has led to the constantly declining net international investment balance of the US, which went negative around 1990, as can be seen in fugures Menzie has ptesented, and has continued to get more negative. So foreigners have been steadlly piling up a larger proportion of assets paying them incomes compared to what Americans own abroad that are paying them income.
This has steadily continued through this whole period irrespective of periodic fluctuations of exchange rates, which have in fact always remained with a position of the USD being overvalued. That actually implies that the value of what is going out is greater than that going in for equivalent assets.
But here we are, with the US maintaining a net positive investment income flow throughout this whole period, irrespective of forex fluctuations and through a situation where overvalued USD should mean more going out than coming in quite aside from the ever deepending negative investment portfolio balance.
But not only have we seen this pattern hold, the net inome flow was higher through most of the teens than during the decade before, something nobody here has yet to provide an explanation for. In any case, it sure as heck is not due to forex rates.
Fred may claim that is it not the composition of what the assets are, but it sure looks to a lot of us like it is. If it is not that or the forex rates (which it is not), then what is it?
If Menzie Chinn, will take it upon himself to enter the comments, and tell me the drastic change before the “Great Recession” had nothing to do with exchange rates, I’ll take it under consideration, I’m half drunk now ,and even your sorry ass can’t ruin it.
Moses,
The more I think about this claim by Fried that the differences in yield are not due to “differences in the composition of assets” held, the less sense it makes to me. It may be that, say, balances between stocks and bonds or whatever are not all that different between what Americans hold abroad and what foreigners hold here. But the hard bottom line is that the aggregate yield Amercans are getting far exceeds the yield foreigners get here, with this holding for many decades now, although I have yet to see anybody here or anywhere else explain why that yield was ever relatively higher during the 20 teens than during the previous decade, given the ever deepening negative investment balance of the US internationally. But whatever it is, the fact that we have a negative net international investment balance and a positive net capital income flow, indeed a higher one than some time ago, means by definition that we have a higher yield on our assets abroad than they do on those they hold here, with this gap if anything having gone up.
Does this Fried provide any explanation for this given that he seems to deny that it is not due to the “compositoin” of the assets held, and I am quite certain that he does not fall back on exchange rates as you did here, as it is clearly not that. Indeed, again, the fact that the USD is overvalued means that the net capital income flow ought to be more against the US as the outflow from us if overvalued relative to the inflow from abroad due to the overvaluation of the USD. But that is not offsetting it.
Moses,
I know you want Menzie, and I note that what value of the USD had to do with the Great Recession is a separate issue from the one under discussion here about this apparent paradox of the US having a negative foreign investment balance for decades while maintaining a surplus on the investment income balance.
However, the USD dropped pretty sharply in the months before the GR started, reaching a serious low. Then it went up during the GR, probably the old “safe haven” effect of the USD, but then went down again, reaching a multi-decade low early in the teens. But then it rose up after a few years and is now not too far from longer term average levels.
Found it – China’s Dark Anti-Matter:
https://econospeak.blogspot.com/2015/05/chinas-dark-anti-matter.html
Thanks for breaking down the US Net International Investment Position. On a side note, I wrote an article on FIRPTA – (sharing it in case your readers need more information – https://HomesForSale.Vegas/learn-about-firpta) I’m always in the lookout for FIRPTA from a different point of view. It’s more important now than ever before with world-wide investors. Super informative post!
Enlighten me, please.
Is net wage income flatlining for the indefinite future?
I am probably grossly misunderstanding the term…
Is net wage income…
[ That would be net wage income as a component of U.S. net international income:
https://www.cbo.gov/system/files/2021-08/57326-International-Investment.pdf – page 33 ]
“the average yield on U.S. investments abroad has exceeded the average yield on foreign investments in the United States”.
Well that is the accounting but why is our yield higher than the average yield on foreign investments in the US? When Brad Setser notes “dark matter” he is referring to an alleged difference between the market value of assets and the book value (aka intangible assets). He and others have also suggested transfer pricing issues. This literature dates back to 2005. I even suggest the flip side of this which is China in a post entitled Dark Anti-Matter.
Something I wrote on this issue and transfer pricing:
https://econospeak.blogspot.com/2017/01/disneys-transfer-pricing-and_8.html
The mysterious part is that discounted future income seems disconnected from the current value of assets held. If assets held overseas by “U.S.” entities produce more income than “U.S.” assets held by overseas entities, and seem likely to continue to so, yen (after risk adjustment), the U.S. should have a posiive net asset position.
The mystery comes down to tour things: 1) income is wrong; 2) asset value is wrong; 3) rsk is a big deal; 4) the theory of asset valuation is wrong.
We pretty much suspect that 1, 2 and 3 are all true. Transfer pricing, tax cheating, accounting hocus-pocus all fall under 1 and 2. The huge appetite overseas for Treasury debt and (often) U.S. mortgage paper vs U.S. appetite for equity (real and financial) and high yield debt means U.S. assets held abroad earn pess then foreign assets held by U.S. entities.
So far, so good. Has any attempt been made to quantify the whole shebang to see if we can match aseet valuations against discounted future earnings?
“The mysterious part is that discounted future income seems disconnected from the current value of assets held.”
You are onto something here but let me take you back to the original 2005 Dark Matter story by noting that the market value of assets often exceed the book value especially when the accountants forget to provide for any valuation of intangible assets.
The other tale is that transfer pricing manipulation has distorted the report income flows.
The real chuckle is that transfer pricing types estimate arm’s length income as the appropriate cost of capital times the reported value of assets, while valuation types take income as reported and estimate market values using the appropriate cost of capital. It can lead to a lot of circular reasoning sort of like the dog chasing its tail!
http://www.news.cn/english/2021-09/28/c_1310215543.htm
September 28, 2021
World Bank says East Asia and Pacific’s recovery undermined by Delta variant
The East Asia and Pacific region’s recovery has been undermined by the spread of the COVID-19 Delta variant, the World Bank said Monday, calling for a comprehensive strategy to contain COVID-19 and boost inclusive growth.
Economic activity began to slow down in the second quarter of 2021, and growth forecasts have been downgraded for most countries in the region, according to World Bank’s newly released East Asia and Pacific Fall 2021 Economic Update. *
“Whereas in 2020 the region contained COVID-19 while other regions of the world struggled, the rise in COVID-19 cases in 2021 has decreased growth prospects for 2021,” said World Bank Vice President for East Asia and Pacific Manuela Ferro.
While China’s economy is projected to expand by 8.5 percent, up 0.4 percentage point from the April projection, the rest of the region is forecast to grow at 2.5 percent, 1.9 percentage points less than forecast in April, the report showed.
Noting that there is variation across countries, Aaditya Mattoo, chief economist for East Asia and the Pacific at the World Bank, told Xinhua in a remote interview on Monday that some countries like China have been relatively successful in at least keeping this virus at bay, but other countries which had done well previously, especially like Vietnam and Malaysia, are now struggling to contain it and are suffering a “significant” contraction in economic activity.
Others like the Philippines and Indonesia, he continued, had always struggled and their struggles have been “worse,” so they are also seeing a contraction in economic activity and forecasts for them are less promising than before.
Employment rates and labor force participation have dropped, and as many as 24 million people in the region will not be able to escape poverty in 2021, the report noted, warning that the scars of the pandemic are likely to dampen long-term economic growth.
While all households have suffered, poorer ones were more likely to lose income, sell off productive assets, suffer food insecurity, and lose schooling for children, according to the report….
https://openknowledge.worldbank.org/handle/10986/36295
World Bank East Asia and Pacific Economic Update, October 2021
I was going through some unread hardcopy NYTs in the house, and I found a recent obituary on American artist Hung Liu. (We’ve fully adopted her, so she can’t keep the “Chinese-American” prefix, she is just “American” now, joking/not joking) And I thought some of her work was quite exquisite. You can go to this website—–>> http://www.hungliu.com/in-america.html then take your mouse/cursor to the upper right and you’ll see the word “Work” after you slide down, you can see the words “In China” or “in America” and then you will see some choices of years, again just glide your mouse over the years, and then you will se a TON of her different artworks. One of the ones they highlighted in NYT was her “Rat Year 2020”, which again I really thought was masterful and I really admire her. If you like solid art with real skill, you gotta check it out. If I was wealthy (which I obviously am not) I would purchase some of these for my home. I just think they are that good. The more “reality based” ones (my words) based on the photo images are the ones I tend to admire more. But I’m sure her other “styles” also have something to them.
Speaking of things international and income, China’s Caixin factory index came in at 50 for September, barely improved from 49.2 in August. Demand up, production down. Power rationin was blamed.
When I lived over there they never turned building heat on until very late November (and even that was poorly operating wall radiators located near your outside window). That was awhile back. Now I am a bit of a weirdo, I can take weather or even house heat quite cold, (mid-to-low 60s Fahrenheit and be quite content). But it wasn’t popular with either the locals or the “b*tch about anything” foreigners.
Speaking of power rationing, it’s a supply-chain problem: https://www.bloomberg.com/news/newsletters/2021-09-30/next-china-coal-crunch-knocks-out-the-lights.
But then, so are labor-market conditions and access to Covid vaccines: https://edition.cnn.com/2021/09/29/business/supply-chain-workers/index.html
I don’t know the timeframe in which central banks are saying supply problems will ease, but maybe that’s because they don’t either.
I’m going to read the links you gave there careful soon. OR ‘with a fine toothed comb’ as the old saying goes. Outside of variants I thought Lael Brainard’s latest speech had a positive tone. I tend to “buy into” just most about anything she says. You know, with the usual “error term” or “residual” attached.
Drinking and playing air guitar to the live 1990 Knebworth version of “Wearing and Tearing”. A degenerate has to have his priorities straight.
supply chains are very complex: system effects, technical effects and wildly swinging operational demands…..
the variety of issues in each suggests that near term inflation will be soothed by opening supply chain is hope,
hope is not a ‘planning’ asset.
yellen and powell won’t be the first to downplay problems for the boss.
https://news.cgtn.com/news/2021-09-30/China-s-manufacturing-PMI-at-49-6-in-September-13YdVgi4u7m/index.html
September 30, 2021
China’s factory activity contracts in September due to higher prices
China’s official Purchasing Managers’ Index (PMI), a key gauge of manufacturing activities, slipped to 49.6 in September due to high raw material prices and demand slowdown, data from the National Bureau of Statistics (NBS) showed Thursday.
A reading above 50 indicates expansion in activities, while a reading below that mark reflects contraction.
The figure was below Reuters’ forecast of 50.1, but better than Nomura’s prediction of 47. Nomura said in a report Monday that measures to reduce energy intensity taken in some key economic powerhouses like Jiangsu, Zhejiang and Guangdong provinces would very likely dent September’s PMI.
https://news.cgtn.com/news/2021-09-30/China-s-manufacturing-PMI-at-49-6-in-September-13YdVgi4u7m/img/226dd36eb274429ba8cfb852f567082b/226dd36eb274429ba8cfb852f567082b.jpeg
Both the supply and demand sides slowed in September. The production index and the new order index were 49.5 percent and 49.3 percent, respectively, down 1.4 and 0.3 percentage points from the previous month. The new order index, especially, slipped to contraction for two consecutive months, reflecting the overall slowdown of manufacturing activities and market demand, said Zhao Qinghe, a senior statistician with the NBS.
Meanwhile, the purchase price index and factory gate price index of major raw materials were 63.5 percent and 56.4 percent, respectively, 2.2 and 3.0 percentage points higher than the previous month and a four-month high, Zhao said.
The price index for petroleum, coal and other fuel processing, chemical raw materials and products and non-metallic mineral products were all above 69.0 percent, Zhao added.
By firm size, the PMI for large enterprises surveyed was 50.4 percent, slightly higher than the 50.3 percent last month. Meanwhile, small and medium-sized enterprises edged down to 47.5 percent and 49.7 percent, 0.7 and 1.5 percentage points lower than last month, respectively.
Service activity expands
China’s official non-manufacturing PMI, which includes services and construction activities, surged to 53.2 from 47.5 in August.
The business activity indexes of railway, air, accommodation, catering, ecological protection and environmental governance that were more severely affected by the epidemic last month all rebounded in September, Zhao said.
The PMI for construction activities came in at 57.5 percent, 3.0 percentage points lower than last month. The labor demand of construction enterprises continued to increase this month.
The September composite PMI, which includes both manufacturing and services activity, stood at 51.7 versus 48.9 in August….
https://fred.stlouisfed.org/graph/?g=FoX2
January 15, 2020
Global Price Index of All Commodities and Industrial Materials, 2020-2021
(Indexed to 2020)
https://fred.stlouisfed.org/graph/?g=EEyN
January 15, 2018
Global Price Index of All Commodities and Industrial Materials, 2017-2021
(Indexed to 2017)
https://news.cgtn.com/news/2021-10-01/Chinese-mainland-reports-34-confirmed-COVID-19-cases-13ZV0io5ncA/index.html
October 1, 2021
Chinese mainland reports 34 new COVID-19 cases
The Chinese mainland on Thursday recorded 34 new confirmed COVID-19 cases, including 10 local transmissions, the latest data from the National Health Commission showed on Friday.
In addition, 25 new asymptomatic cases were recorded, while 359 asymptomatic patients remain under medical observation.
This brings the number of confirmed COVID-19 cases on the Chinese mainland to 96,162, with the death toll unchanged at 4,636.
Chinese mainland new locally transmitted cases
https://news.cgtn.com/news/2021-10-01/Chinese-mainland-reports-34-confirmed-COVID-19-cases-13ZV0io5ncA/img/2ef15bc3c4fb4cb5aee94b8adcdb96f8/2ef15bc3c4fb4cb5aee94b8adcdb96f8.jpeg
Chinese mainland new imported cases
https://news.cgtn.com/news/2021-10-01/Chinese-mainland-reports-34-confirmed-COVID-19-cases-13ZV0io5ncA/img/f4fc712751fb4c5b8e9f4e6e62b382b4/f4fc712751fb4c5b8e9f4e6e62b382b4.jpeg
Chinese mainland new asymptomatic cases
https://news.cgtn.com/news/2021-10-01/Chinese-mainland-reports-34-confirmed-COVID-19-cases-13ZV0io5ncA/img/f2d31781720b4406a52dc8ae55942ed9/f2d31781720b4406a52dc8ae55942ed9.jpeg
http://www.news.cn/english/2021-10/01/c_1310221757.htm
October 1, 2021
Over 2.211 bln COVID-19 vaccine doses administered in China
BEIJING — Over 2.211 billion doses of COVID-19 vaccine had been administered in China as of Thursday, data from the National Health Commission showed Friday.
[ Chinese coronavirus vaccine yearly production capacity is more than 5 billion doses. Along with over 2.211 billion doses of Chinese vaccines administered domestically, more than 1.25 billion doses have been distributed to 100 countries internationally. A number of countries are now producing Chinese vaccines from delivered raw materials. ]
https://www.worldometers.info/coronavirus/
September 30, 2021
Coronavirus
US
Cases ( 44,314,424)
Deaths ( 716,847)
Deaths per million ( 2,150)
China
Cases ( 96,128)
Deaths ( 4,636)
Deaths per million ( 3)
https://www.nytimes.com/live/2021/10/01/business/news-business-stock-market#inflation-supply-chain
October 1, 2021
Prices climb at fastest pace in 30 years as supply chain snarls linger.
By Jeanna Smialek
The Federal Reserve’s preferred inflation gauge accelerated in August, keeping the pressure on economic policymakers who are watching warily as supply chain issues and commodity costs threaten to keep price gains elevated for longer than they had expected.
The Personal Consumption Expenditures index continued to climb at its fastest pace since 1991, rising by 4.3 percent in the year through August. That beat out the prior month’s reading of 4.2 percent.
The monthly index also remained elevated, climbing by 0.4 percent for a second straight month.
Inflation has surged thanks to pandemic-related problems, including shipping trouble as strong demand for goods from Asia and elsewhere has taxed freight routes and pushed transit costs higher. Shortages in key parts have pushed up prices for everything from cars to washing machines. Officials at the Fed and in the White House have been clear that they expect those pressures to fade as the economy more fully reopens and business returns to normal.
A separate inflation index that is released earlier, the Consumer Price Index, did show some early signs of moderation in August, though it remained elevated, at 5.3 percent.
https://fred.stlouisfed.org/graph/?g=EJsH
January 15, 2018
Consumer Price Index and Personal Consumption Expenditures Price Index less food & energy, 2017-2021
(Percent change)
https://fred.stlouisfed.org/graph/?g=DaZv
January 15, 2018
Consumer Price Index and Personal Consumption Expenditures Price Index less food & energy, 2007-2021
(Percent change)
Vanda Gould must be Australian for Donald Trump:
https://www.theguardian.com/australia-news/2020/dec/23/the-taxman-v-the-accountant-disgraceful-conduct-and-an-epic-australian-defamation-case
I just heard about this and am trying to figure out the details but apparently Vanda Gould has been a master of tax evasion in Australia and when called out by the tax authorities has decided to sue the Commissioner for defamation.
It seems Justice “I Like Beer” and groping women has caught COVID-19:
https://www.msn.com/en-us/news/us/supreme-court-justice-brett-kavanaugh-tests-positive-for-covid-19/ar-AAP2oG4?ocid=uxbndlbing
Merck’ Molnupiravir may be an effective treatment for those with COVID-19:
https://www.livescience.com/molnupiravir-merck-antiviral-pill-for-covid19
https://www.nytimes.com/2021/10/01/business/stock-bond-real-estate-prices.html
October 1, 2021
Stock, Bond and Real Estate Prices Are All Uncomfortably High
An economist says the three major U.S. markets all show signs of severe overpricing.
By Robert J. Shiller
https://fred.stlouisfed.org/graph/?g=mSzQ
January 30, 2018
Case-Shiller Composite 20-City Real Home Price Index, 2000-2021
(Indexed to 2000)
https://www.multpl.com/shiller-pe
October 1, 2021
Valuation
The Shiller 10-year price earnings ratio * is currently 37.63 so the inverse or the earnings rate is 2.66%. The dividend yield is 1.33%. So an expected yearly return over the coming 10 years would be 2.66 + 1.33 or 3.99% provided the price earnings ratio stays the same and before investment costs.
Against the 3.99% yearly expected return on stocks over the coming 10 years, the current 10-year Treasury bond yield is 1.48%.
The risk premium for stocks is 3.99 – 1.48 or 2.51%.
* CAPE
Shiller has been saying this for several years now. Nothing new here.
https://www.nytimes.com/2021/10/01/business/stock-bond-real-estate-prices.html
October 1, 2021
Stock, Bond and Real Estate Prices Are All Uncomfortably High
An economist says the three major U.S. markets all show signs of severe overpricing.
By Robert J. Shiller
The prices of stocks, bonds and real estate, the three major asset classes in the United States, are all extremely high. In fact, the three have never been this overpriced simultaneously in modern history.
What we are experiencing isn’t caused by any single objective factor. It may be best explained as a result of a confluence of popular narratives that have together led to higher prices. Whether these markets will continue to rise over the short run is impossible to say.
Clearly, this is a time for investors to be cautious. Beyond that, it is largely beyond our powers to predict.
Consider this trifecta of high prices:
Stocks. Prices in the American market have been elevated for years, yet despite periodic interruptions, they have kept rising. A valuation measure that I helped create — the cyclically adjusted price earnings (CAPE) ratio — today is 37.1, the second highest it has been since my data begin in 1881. The average CAPE since 1881 is only 17.2. The ratio (defined as the real share price divided by the 10-year average of real earnings per share) peaked at 44.2 in December 1999, just before the collapse of the millennium stock market boom.
Bonds. The 10-year Treasury yield has been on a downtrend for 40 years, hitting a low of 0.52 percent in August 2020. Because bond prices and yields move in opposite directions, that implies a record high for bond prices as well. The yield is still low, and prices, on a historical basis, remain quite high.
Real estate. The S&P/CoreLogic/Case-Shiller National Home Price Index, which I helped develop, rose 17.7 percent, after correcting for inflation, in the year that ended in July. That’s the highest 12-month increase since these data begin in 1975. By this measure, real home prices nationally have gone up 71 percent since February 2012. Prices this high provide a strong incentive to build more houses — which could be expected eventually to bring prices down. The price-to-construction cost ratio (using the Engineering News Record Building Cost Index) is only slightly below the high reached at the peak of the housing bubble, just before the Great Recession of 2007-9.
There are many popular explanations for these prices, but none, in itself, is adequate….
And he admits that the stock one has been high for a long time now, and he has been banging the drum on that one for some time, almost embarrassingly so. What actually is new here is the recent runup in real estate prices over the last year. That one sticks out, although that one is at least partly being driven by a runup in rents, which is a real problem reflecting weak supply conditions in much of the US, in contrast with the real estate runup prior to 2006, which saw a massive increase in the price/rent ratio.