There’s a lot of discussion regarding the negative impact of inflation on consumer sentiment. That’s definitely there – but unemployment also has a negative impact. And there is a (at least short run) tradeoff between the two. Relevantly, what would unemployment be in the absence of the American Recovery Plan, the CARES Act, and expansionary monetary policies of the Fed?
Here’s a plot of the University of Michigan consumer sentiment index, month-on-month annualized inflation rate, and the unemployment rate (the latter two rates in decimal format).
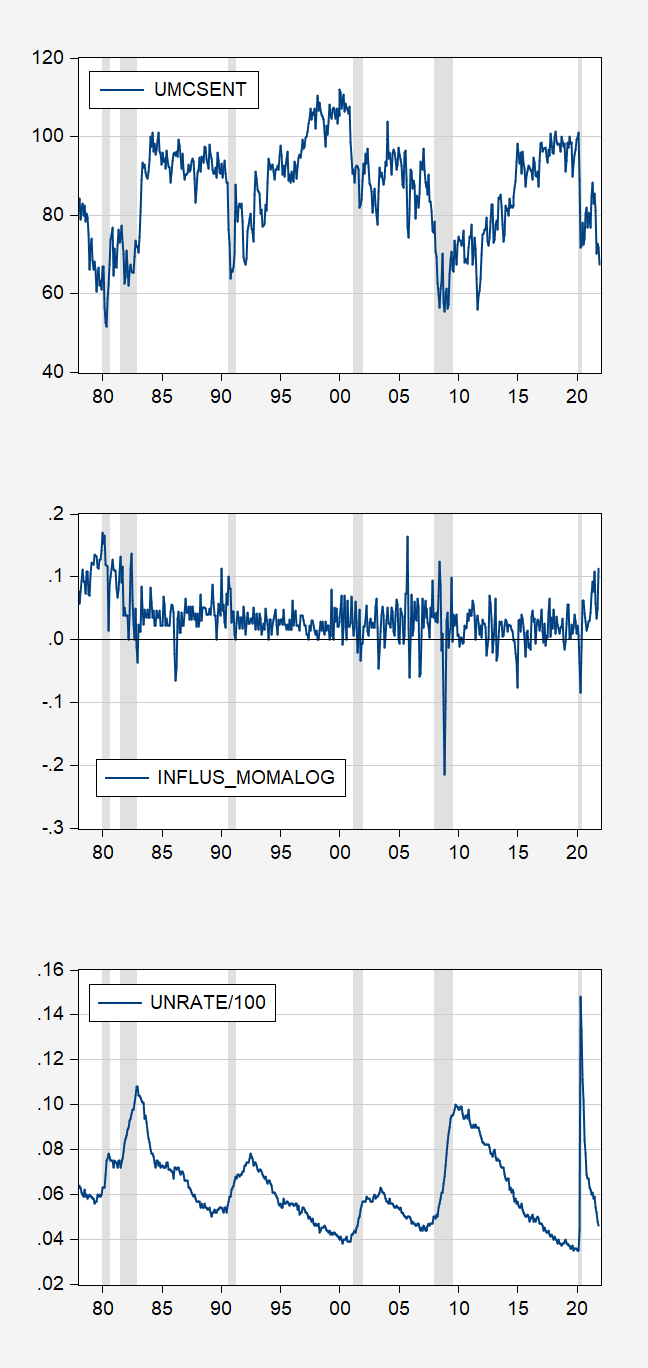
Figure 1: Top panel, University of Michigan Consumer Sentiment; Middle Panel, month-on-month CPI inflation rate annualized (log terms, decimal format); Bottom Panel, unemployment rate (decimal format). NBER defined recession dates peak-to-trough, shaded gray. Source: Univ. of Michigan, BLS, via FRED, and NBER.
What’s the relationship using a simple OLS regression? Using monthly data, 1978-2021M10:
umcsent = 1.16 – 0.86 π – 4.36 u + v
Adj. R2 = 0.42, SER = 0.095, N = 526, DW = 0.25. Bold denotes significance at 5% msl, using HAC robust standard errors.
One can report standardized coefficients (i.e., scaled by standard deviations) to convey the relative importance of each variable in the movements of the left hand side variable.
umcsent’ = – 0.26 π’ – 0.60 u’ + v’
Or the elasticity at means:
umcsent” = 1.35 – 0.034 π” – 0.315 u” + v”
So, yes, with lower inflation ceteris paribus consumer sentiment would be higher. But if that lower inflation was associated with higher unemployment, then the net effect would be ambiguous (unless one takes a stand on the tradeoff during these pandemic times).
Using quantile regression:
umcsent = 1.18 – 0.89 π – 4.62 u + v
Adj. R2 = 0.30, SER = 0.095, N = 526, Bold denotes significance at 5% msl, using Huber Sandwich robust standard errors.
A little humor is on order. It seems Kevin Drum and Greg Sargent are having a debate about how best to demonize Republicans making people rightfully fearful of Republican rule. I know – trust Greg on this one but Kevin did provide a classic clip of Republicans pushing Granny over the cliff re Medicare. Enjoy!
https://jabberwocking.com/how-can-we-make-more-people-fear-republican-rule/
Consumer sentiment in this case may be responding to news about this virus.
I sorta of doubt it. The virus is more hype than reality right now. A aging “pandemic” that is losing its ability to push numbers in the west. By spring, there won’t be much left. Likewise “inflation” is going to have problems as well as “normalizing” spending will force contractions in pricing to retain customers and drive capital flowing downstream more. April inflation will probably be negative, creating a large decline yry.
Brent $69
Waiting for “Princeton”Kopits updates on which day in December 2021 oil hits $100. This is going to be exciting.
https://www.nytimes.com/2021/11/30/opinion/inflation-united-states-europe.html
November 30, 2021
On the trans-Atlantic price gap
By Paul Krugman
This morning Eurostat, the European statistical agency, announced its “flash” estimate of November inflation for the euro area. It came in well above expectations — a 4.9 percent rise in prices over the past year. Still, this was lower than U.S. inflation: In October our consumer prices were up 6.2 percent over the year. And technical differences appear to downplay the U.S.-Europe difference. If we use a European-style index to calculate U.S. inflation over the past year, it was 7.3 percent.
Now, one-year inflation is a problematic measure right now, because many prices were temporarily depressed by the pandemic. Many commentators like to focus on price rises over two years to avoid this problem. When you do, however, the difference between the United States and Europe remains striking:
https://static01.nyt.com/images/2021/11/30/opinion/krugman301121_1/krugman301121_1-jumbo.png?quality=75&auto=webp
We’re No. 1!
Does lower (although still high) inflation in Europe tell us something about inflation here? A number of commentators have argued that the difference shows that deficit spending, which has been bigger in the United States, is a major cause of inflation. For example, Jason Furman, the former head of President Barack Obama’s National Economic Council, has put the Europe-U.S. differential at the core of his argument that the American Rescue Plan bears a lot of responsibility for current inflation:
https://static01.nyt.com/images/2021/11/30/opinion/krugman301121_2/krugman301121_2-jumbo.png?quality=75&auto=webp
Does Europe show that stimulus did it? …
https://fred.stlouisfed.org/graph/?g=IXuE
January 30, 2020
Consumer Prices and Consumer Prices less food & energy for Euro Area and United States, 2020-2021
(Percent change)
https://fred.stlouisfed.org/graph/?g=IXud
January 30, 2018
Consumer Prices and Consumer Prices less food & energy for Euro Area and United States, 2017-2021
(Percent change)
In a way, a confidence index here stands in for a misery index. Okun’s version of the misery index, the original,, includes just inflation and unemployment.
I’m not sure whether preferences between unemployment and inflation are stable, but in 2001, Tella, McCullough and Oswald found “that people would trade off a 1-percentage-point increase in the unemployment rate for a 1.7-percentage-point in-
crease in the inflation rate.” (https://www.jstor.org/stable/2677914)
The public doesn’t generally seem aware of policy trade-offs. Politicians often do nothing to enlighten them. However, the choice for policy makers in the near term is generally between employment and inflation. If voters punish politicians for choosing disinflation over employment, politicians will take the lesson to heart; they have in the past.
As an aside, the misery index and confidence indicators take us into the realm of “happiness economics”. There are lots of economists who seem uncomfortable discussing happiness (perhaps because comparing utility across individuals is taboo), but are perfectly happy relying on confidence measures.
“a confidence index here stands in for a misery index.”
Insight of the year. With Omicron I’m wearing my mask everywhere. Am I happy? Of course not – as I am passing up a trip to the Barkley Center to watch the Nets put down those damn Manhattan Knicks. But come on – let’s all do the right thing even if we feel miserable!
Off topic – unless the Turkish misery index is germaine
The performance of Eurozone Bank shares from Friday suggest greater risk in the face of Omicron troubles than other developed country banks. Suspicious glances at exposure to Turkey. The lira continues its decline and Turkey has suffered pretty badly from Covid. Erdogan today repeated his opposition to higher rates to defend the lira – the lira fell further. https://fred.stlouisfed.org/series/RBTRBIS
Spain’s BBVA has the biggest exposure among systematically important banks.
By the way, I have not found any press reports of Omicron cases in Turkey.
Normally we agree on so much I hesitate to disagree with you here, but my first inclination is to think that because Turkey has been so bad at managing their own currency in recent history, that these numbers have nothing to do with Omicron. But I am not “wedded to this theory” and if you or anyone has something more concrete to connect the lira gyrations to Omicron I am extremely malleable on this topic.
I got nothin’. But watching BBVA price relative to market index prices in response to Omicron news seems an easy way to get at the question.
Is the problem that variation in prices is greater than the inflation rate itself?
See https://i0.wp.com/economicsfromthetopdown.com/wp-content/uploads/2021/11/inflation_2020_all.png?w=723&ssl=1
《Figure 3: Price change in the real world. The black line shows the change in the US consumer price index since January 1, 2020. The colored lines show the indexed price of all the individual commodities tracked by the CPI. Many commodities are tracked in multiple locations. [Sources and methods]》
If you run those variances through your regressions, will you end up with noise upon noise?
Are you doing the equivalent of arguing about the number of angels that can fit on the head of a pin?
rsm: But before you run a regression using variances, shouldn’t you report the standard errors of the variances you have compiled? I will wait to see your estimates of the standard errors of those objects… (I think it will be a very long wait).
Is the point that they are so huge, that everything you are looking at may as well be noise?
What about “the variance of inflation is greater than inflation” don’t you understand? Isn’t it obvious that such a wide variance has devastating consequences for your tests?
Does your regression assume the opposite of Blair Fix’s analysis, that the standard error is zero? Is it difficult to see that your regressions produce wildly divergent results if you plug in the plus-or-minus values on inflation that Blair Fix’s article (linked in another comment, or do a search?) helpfully demonstrates graphically?
rsm: I’m just trying to hint to you that … you can’t estimate the standard error of the variance.
Putting aside the fact that you have once again fallen into an analytical ditch when it comes to method, you should know that you have fallen into an analytical ditch when it comes to underlying concepts.
Inflation measures are used to track changes in the cost of living. Higher variability in the prices of individual items does not negate the fact that the cost of living rises. In fact, higher price variability and higher variability in overall inflation are characteristic of periods of higher inflation. When you cite higher variability in the price of individual items, you are offering data which serves to confirm higher inflation, rather than calling it into question.
Nice job.