Expectations and forecasts from economists continue to diverge from consumer based expectations.
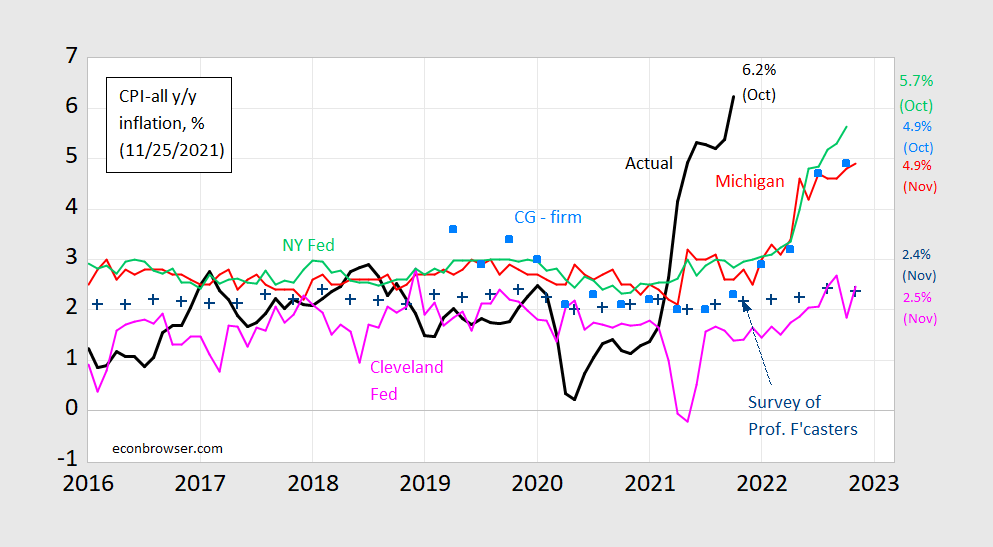
Figure 1: CPI inflation year-on-year (black), median expected from Survey of Professional Forecasters (blue +), median expected (preliminary) from Michigan Survey of Consumers (red), median from NY Fed Survey of Consumer Expectations (light green), forecast from Cleveland Fed (pink), mean from Coibion-Gorodnichenko firm expectations survey [light blue squares]. Source: BLS, University of Michigan via FRED and Investing.com, Reuters, Philadelphia Fed Survey of Professional Forecasters, NY Fed, Cleveland Fed and Coibion and Gorodnichenko.
What forecasts are more unbiased (which is separate from which forecasts more represent agents’ expectations). Over the 1986-2021 period, the following results apply:
πt = 0.022 + 0.128 micht-12 + ut
Adj R2 = 0.00, SER = N = 428, reject unit slope null
πt = 0.022 + 0.542 clevelandt-12 + ut
Adj R2 = 0.166 , SER = 0.012, N = 428, reject unit slope null
πt = 0.012 + 0.522 clevelandt-12 + ut
Adj R2 = 0.150 , SER = 0.012, N = 430, reject unit slope null [corrected 11/27]
πt = 0.004 + 0.788 spft-12 + ut
Adj R2 = 0.259 SER 0.011, N = 143, fail to reject unit slope null
All results using HAC robust standard errors.
In other words, the professional economists’ forecasts are more accurate, even when including the recent period.
https://blog.ms-researchhub.com/2021/01/22/hac-robust-standard-errors/
A nice primer for those who are not used to HAC robust standard errors.
Of course rsm is going something else to complain about!
http://www.news.cn/english/2021-11/27/c_1310335599.htm
November 27, 2021
WTI crude futures sink over 13 pct on demand concerns
NEW YORK — U.S. oil prices plunged more than 13 percent on Friday due to concerns over the discovery of a new variant of COVID-19 in South Africa.
The West Texas Intermediate (WTI) for January delivery sank 10.24 U.S. dollars to settle at 68.15 dollars a barrel on the New York Mercantile Exchange.
Meanwhile, Brent crude for January delivery lost 9.53 dollars, or 11.59 percent, to settle at 72.72 dollars.
The two benchmark crude oil futures marked the deepest single-day drop since April 2020….
https://fred.stlouisfed.org/graph/?g=FmWS
January 15, 2020
Consumer Price Indexes for Food and Energy, 2020-2021
(Percent change)
https://fred.stlouisfed.org/graph/?g=FvUs
January 15, 2018
Sticky Consumer Price Index less Shelter and less Food & Energy, 2017-2021
(Percent change)
I don’t know how it works out in a strict mathematical sense, but the eyeball test to me seems to show the Cleveland number is pretty damned good.
《 However, this cluster-robust variance-covariance estimator is not a solve all; you still need to be careful about your assumptions (and your data).》
https://edrub.in/ARE212/section10.htmlhttps://edrub.in/ARE212/section10.html
In other words, what are the standard errors on each point, based on the variance of the data going into that point?
How do you measure inflation? Do you take a sample of prices, and infer the population? If you sample a price at Walmart and I shop at Albettson’s, will relative prices be exactly the same, or are there differences that standard error of the inflation survey is meant to estimate? But do you throw away that standard error, thus abandoning all claim to intellectual honesty?
Second, aren’t all surveys 100% wrong about today’s magical inflation number?
Are you saying inflation could be twice the forecast, and still you trust the professional’s forecast, because HAC robust standard errors?
Aren’t you really telling a story about how consumers are dumber than professional forecasters, using a cherry-picked time period and fancy-sounding statistical analysis that actually just operates on data points each of which themselves have standard errors that you willfully ignore?
Also, can you read Gelman on robust standard error?
《 I don’t like such methods because they don’t do anything with the point estimates, and as such are leaving information on the table.》
https://statmodeling.stat.columbia.edu/2017/12/27/id-say-robust-standard-errors-like-holy-roman-empire-except-think-theyre-error/
Thank you for putting together this valuable information.
Professor Chinn,
I notice that you used Cleveland Fed data up to November, as indicated.
In order to have 428 observations, did you begin with 1986m03?
The reason I ask is that in trying to replicate your model, I get the following slight differences:
πt = 0.012 + 0.523 cleveland t-12 + µ t
Adj R2 = 0.148, SER = 0.012, N=428, reject unit slope null (Wald Test)
Thanks
AS: I just used default 1986M01-latest in Eviews (which would use forecasts from t-12). Turns out I entered wrong text – my mistake! I’ve corrected. Now I get 430 observations. Thanks for catching that!
And I used t-test on slope coefficient, not Wald.
Thanks for the response.
Yea, I get the same answer after changing to N=430.
Always like to “tie-into” the professor’s answer.
I suspect most of the accuracy of professional forecasters is due to greater familiarity with the data. The public, on average, thinks inflation is higher than measured inflation (confirmation bias at work). That upward bias means the public loses in terms of accuracy over time.
If one were to correct for that bias by subtracting the average miss in the U Michigan inflation expectations indices, would the public beat the pros because the public is kore sensitive to changes? Pros anticipate less inflation volatility than actually happens.
macroduck: You can try it; I estimate the bias in this post.
Gracias.