Industrial production comes in below consensus (-0.1% vs. Bloomberg +0.3% m/m). Here are some key indicators followed by the NBER BCDC.
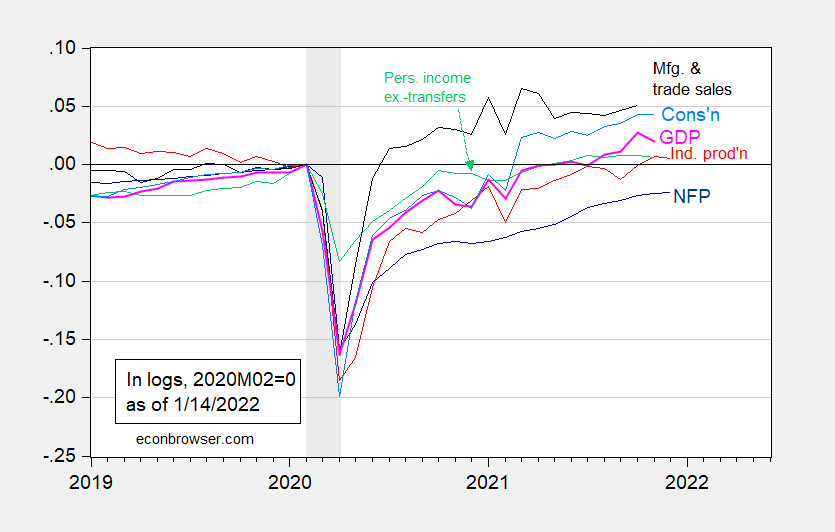
Figure 1: Nonfarm payroll employment (dark blue), industrial production (red), personal income excluding transfers in Ch.2012$ (green), manufacturing and trade sales in Ch.2012$ (black), consumption in Ch.2012$ (light blue), and monthly GDP in Ch.2012$ (pink), all log normalized to 2020M02=0. NBER defined recession dates, peak-to-trough, shaded gray. Source: BLS, Federal Reserve, BEA, via FRED, IHS Markit (nee Macroeconomic Advisers) (1/3/2022 release), NBER, and author’s calculations.
Manufacturing production also missed (-0.3% vs. +0.5% consensus).
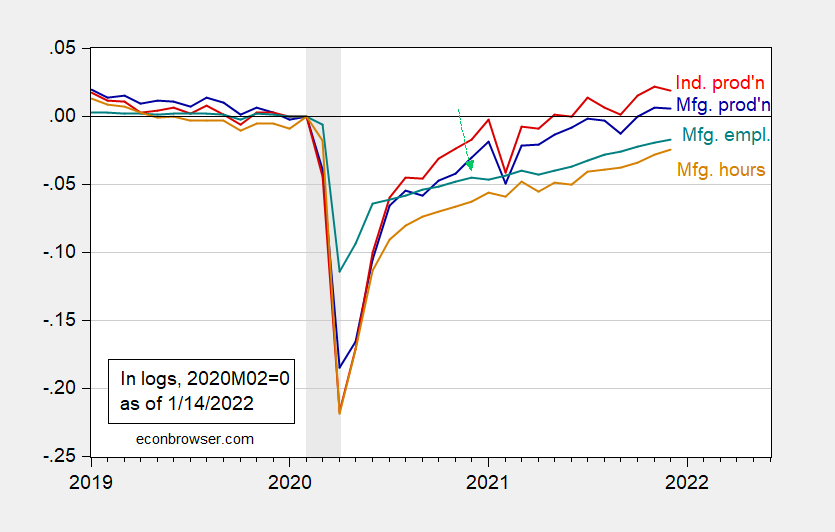
Figure 2: Industrial production (red), manufacturing production (blue), manufacturing employment (green), manufacturing aggregate hours for production & nonsupervisory workers (brown), all seasonally adjusted, all in logs 2020M02=0. NBER defined recession dates, peak-to-trough, shaded gray. Source: Federal Reserve Board via FRED, BLS, NBER, and author’s calculations.
The volatile utilities component of IP fell 1.5% m/m, partly offsetting the 2% increase in mining.
Regarding manufacturing, the business equipment category decreased by 0.5%, which is sensitive to capital investment expenditures, possibly signaling a deceleration (possible, because, we don’t know if it’s supply or demand induced). Automotive parts production was down 1.3% m/m.
Finally, nominal retail sales (ex. food services) undershot as well, -2.3% vs. +0.2% consensus. In real terms:
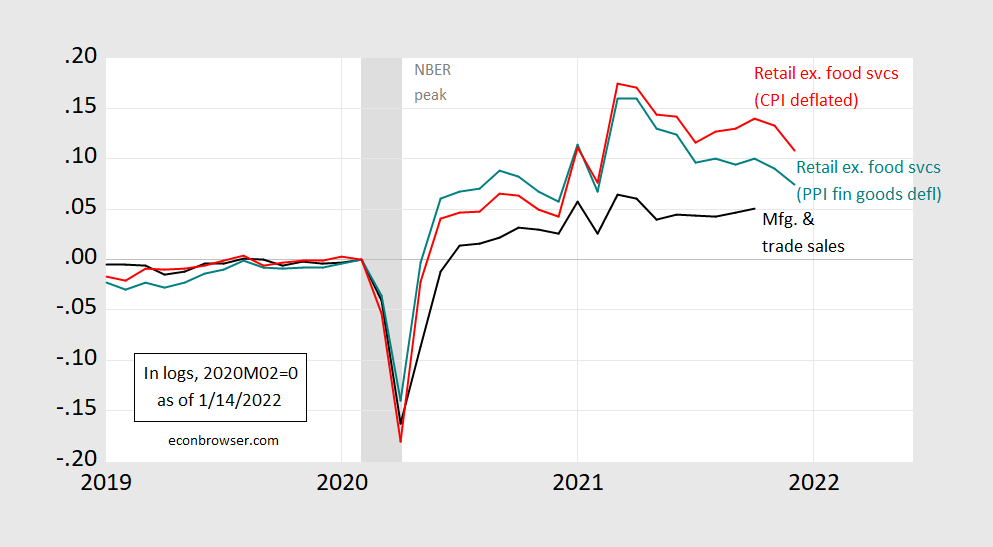
Figure 3: Manufacturing and Trade Industry Sales, 2012Ch.$ (black), retail sales ex food services deflated by CPI (red), retail sales ex food services deflated by PPI for finished goods (teal), all in logs 2020M02=0. NBER defined recession dates, peak-to-trough, shaded gray. Source: Federal Reserve Board via FRED, Census, BLS, NBER, and author’s calculations.
Jason Furman observes that the decline of real sales toward trend might be seen as a signal of normalization, as spending on goods reverts to pre-pandemic rates. In terms of business cycle indicators, to the extent that manufacturing and trade industry sales are correlated with retail sales, this hints at a downward movement in the black line in Figure 1. (Since July 2020, each 1 ppt change in PPI deflated retail sales is associated with 0.5 ppt change in real manufacturing and trade industry sales, with adj.R-squared of 0.75).
These are backwards looking indicators. High frequency indicators based on weekly data (Baumeister et al. index, see this post, as well as this post) show continued growth through December.
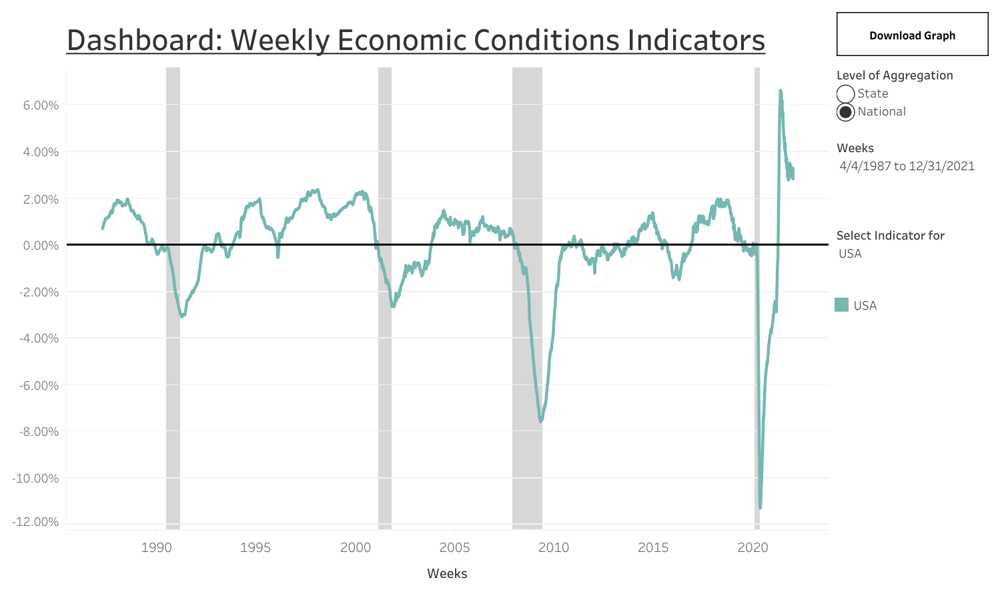
Source: Weekly Economic Conditions Index, accessed 1/14/2022.
A similar pattern is shown in the Lewis-Mertens-Stock indicator.
On the other hand, indicators for the high-contact services sector suggest a downturn there.
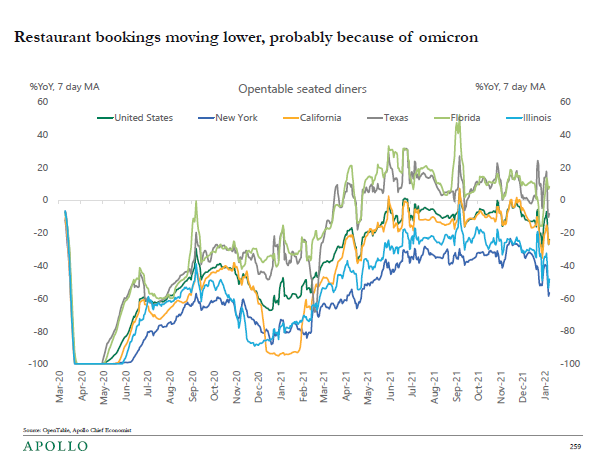
Source: Torsten Slok/Apollo, communication of 1/14/2022.
Good old Torsten Slok. Miss the old days before Apollo when his thoughts/writings were more accessible. Sure, there’s enough other stuff to read without him, still he was always fun and seemed like lots of eyebrow raising moments reading Torsten.
Great rundown Menzie, as always.
The forcasting miss on Industrial Production was mostly due to autos. Inventories were low and manufacturers were expected to do some catching up. The opposite happened. The good news is an upward revision to November IP, so the level of output in December was pretty close to what was implied by the median forecast. The two-month level is bit higher – good for GDP.
AS (I recall?) pointed out that inflation means “real” retail sales were even lower than the reported decline. Thank heavens for little favors, the big disappointment in household consumption is ever-so-slightly offset by a lift to output from production.
Consumption forecasting in Q4 is devilishly tricky, and data collection under Covid is too, so no sense drawing strong conclusions just yet. The dollar qnd bills rates are up a bit, not down as weak data would suggest, so apparently the big retail sale forecasting miss is being taken with a grain of salt.
There is an element seen in a good bit of reporting on consumer spending since Q2 – the idea that inflation hurts nominal consumer spending. That’s certainly true for those up against a hard budget constraint, but the logic of “entrenched inflation expectations” is that people spend today to avoid a loss in the value of money holdings tomorrow. Inflation moves demand forward. So either economics editors are failing their readers or they are tacitly claiming inflation expectations haven’t really risen. Or that most everybody is up against a hard budget constraint, I guess.
Good (if you like oil production) monthly report out of ND.
https://mcusercontent.com/4753e4b0ea70df438a15ff868/files/3dc183ed-359e-efe9-21ef-2c0b5539de56/01.14.22.Directors_Cut.pdf
Up about 50,000 bopd in NOV. Natty up too, but not as big a %. Still, broke back above 3 BCF/d overall. I fully expect drops in DEC, JAN, FEB. This is normal seasonality in ND. Rigs still perplexingly low (~32) given how high prices are. We were running ~52 in late 19, early 20. At lower prices.
Discussion: https://www.youtube.com/channel/UCp5qbfZG4EBcW1c3AryHsBA
Low rigs is not surprising if you add in the uncertainty (see what a good student I am Menzie??) of virus mutations and variants effecting economic activity, ability to go to the office, etc.
Nah, the bubble popped. Rigs will be at November 2019 rates by summer. Both of you need to try harder.
That’s kind of baked into the oil price itself (even if you look forward, it’s still over 75 next couple years right now, there’s a term structure sure, but it can’t much exceed the cost of storage plus money). And is hedge-able. Not just theoretically, but done, at times.
But activity is still low on a $-adjusted basis. Like $20+ low. See chart:
https://twitter.com/RobertClarke_WM/status/1453017667137323010
And it’s really not unusual to have very wide CIs for future price. I’ve been following the STEO for years. Really, it’s normal. And omicron is a dud. All the data’s coming in mild, mild, mild. But in any case, you can hedge the future price if you need to (many companies don’t, have sufficient liquidity to weather the storm).
@ Anon
You lost a lot of credibility, if you had any to begin with, when you typed “And omicron is a dud”. There are people being put into body bags right now that “beg to differ” with you.
It’s largely debatable what is “baked into prices”. If you think that omicron is going to hit economic activity, that is definitely NOT “baked into prices”. Now you can make an argument where the “peak” of omicron will be, if you think that’s now, then you can make that argument. There are intelligent people telling us the omicron peak is not now, and in the last few days we are seeing the death counts slightly catch up with hospitalizations, which I thought was dubious a few weeks ago. The dramatic rise in deaths is what has me thinking oil prices will be lower than $80 by mid-March. If I am wrong it will give our good friend Barkley Junior an opportunity to hit me over the head with an anvil.
Moses,
Why are you dragging me into this? Because nearly a year ago I allowed that $100 per barrel was within the bounds of possibility for the year? I also said $40 was, and the most dramatic crude price change was indeed a one day decline that exceeded $10.
I have made and am making no short term predictions now. Heck, my last empirical observation was that here in Virginia retail GASOLINE prices have just declined a bit.
You need to stop dragging me into arguments that I am not involved in, or at least not in the way that you seem to think I am.
Wait, does this mean you’re relinquishing your long-held post as arbiter of all important world events?? The least you could have done is given the Pope and the Queen two weeks notice. Damn man, I told you to follow procedure.
[edited – MDC]
MH:
“baked into prices”.
When you approve a capital project (drilling), you look at the expected future cost of oil. It’s a direct input in the model. If you really think you’re smarter than the strip, you can stop drilling and just short oil. But it doesn’t make sense that E&Ps think prices will drop radically (more than the backwardation) and the (very widely traded) betting Bayesian markets think differently. That’s an arbitrage fallacy.
Also, as I mentioned, the future price of oil is hedge-able. And that’s not just a theoretical CAPM style argument (like above). But an instrument that companies are intimately familiar with in this industry. They totally know how to hedge and have done it extensively in the past. You can actually pre-sell your production!
Right now they are currently requiring much higher oil price to embark on US E&P projects. There are other possible explanations. E.g. day rates and pipe (costs) being high. We don’t have the public data on it. (I don’t really think it’s that crazy though if you look at recent quarterly reports (costs per completion). Sure it’s up versus the recession. But remember costs have been crazy high ($125,000/year Permian truck driver stories and all that) during the booms of 11-14 and 17-19.
But political risk is also a credible explanation. After all this blog has a lot of posts on WI having bad economics under Republicans. 😉 But if I didn’t like that explanation, I would look to costs first. I wouldn’t do the failure of markets to arbitrage (E&P project view of markets vs betting Bayesian futures markets). Heck…I’d even run to the “learned discipline” argument first. (I don’t buy that one either, after all we had 17-19, after the 14 crash….and many, many previous willingnesses to boom after a bust. I think it makes more sense that investors are prioritizing cash return, given gloomy long term prospects for the industry…after all, you said yourself that you see less FF usage as a feature, not a bug. And JenniG was extremely fast and aggressive in moving against the industry, much more so than the Obama DOE.)
It’s very normal for companies to look at political risk in their calculations. There’s a reason why projects have to be so much more attractive in countries with a nationalization risk, for instance. Or look at pipelines. Lot of projects wasted billions of dollars before getting cancelled. Gone. Loss. Doesn’t mean no new pipes. Just means the hurdles for new infrastructure get higher, to compensate for higher risk. And as a result, less infrastructure. Not zero. But less. Which is what the anti pipeline crowd wants. They have been effective.
Anonymous, re: “Rigs still perplexingly low (~32) given how high prices are”
it’s backwardation, and probably a shortage of frack crews as well…if you start drilling now you’re not going to get today’s oil price, you’ll get the price of oil when the well is completed, which could be a year from now…& right now oil futures a year out are almost $10 lower than today’s quotes….also, most E&Ps hedge, and since many bet wrong this past year, they lost more on their production the higher prices went…
still, DUCS in the Bakken and three other US basins are the lowest on record (since 2013), so they’ll have to pick up the drilling sooner rather than later if they expect to keep production from falling
Backwardation is not an adequate explanation. Two year forward prices are still much higher than they were in 2019.
As far as labor, maybe. Obviously we’ve had tight labor markets before–six figure truck driver stories and all that. I guess the key would be just to know what rig day rates are as that would include labor cost. But I don’t have access to those numbers.
by deflating retail sales with appropriate sub-indices of the CPI, i’m estimating that real PCE goods were 3.1% lower in December…including revisions to prior months, i then get real 4th quarter PCE goods still up 1.2% QoQ….since real PCE goods has been running at 28.3% of GDP, that suggests that 4th quarter PCE goods would add roughly 0.34 percentage points to 4th quarter GDP…
that’s preliminary…i’ll get back later, when i have time to check my tedious arithmetic…
A thousand pardons. I attributed your comment on the implications of the CPI commodities indes for retail sales to AS. You both take data seriously and you both identity by initials and you’re both smarter than me.
Nice job tehn. Nice job now.
No, that will likely be first quarter.
yes, 4th quarter GDP is reported in the 1st quarter….it’s always a lot easier then than reporting it before it happens…
Brent crude closed within $.50 of its 52 week high. No need to elaborate…speaks for itself…and little commentary expected.
https://www.nasdaq.com/market-activity/commodities/bz%3anmx
I think the elasticity of demand will increase at $85+ . But I also think that consumer demand (for gasoline) will noticeably lesson between now and mid-March. Menzie has given us some very good gauges to watch, and some of those gauges might give us a hint where things are going. He’s giving these data to us for free and in an easily digestible way (or easier than it otherwise would be). I think that’s pretty good-hearted, “for an economist”, don’t you??
JohnH, I don’t think you are the swine like “Princeton”Kopits, so don’t act like the swine when someone throws you some pearls, ok??
One thing for sure…the price will go up…or down.
Not for long. Supplies of storage are beginning to rise.
Wait – 30-year mortgages with fixed interest rates have seen these rate rising from less than 2.75% last August to almost 3.5% now. I bet Princeton Steve is booking his next appearance on Fox and Friends on the housing market crash. But housing prices in the NJ/NY area are hitting new highs. What’s up? Oh yea – rents in this area have rebounded and now are at record highs.
If one gets Finance 101 the continuing market boom should not be seen as some irrational babble but then the Princeton Policy Advisors have always exceled at bubble brain analysis!
Jason Furman also noted:
‘Sales at stores selling sporting goods, hobby, musical instruments and books are not nearly as important to the economy (~2% of the total) but they’re much more fun and they’re WAY up.’
OK I’m guilty of going to Amazon and finally ordering new bike shorts and running shoes. The old versions were either getting rather yukky and dangerous for my knees. Some day I hope to walk into an actual store and get the products I actually want as online buying has its limitations.
The World Bank blog published their “wet finger in the wind” projections for growth in 2022 and 2023.
https://blogs.worldbank.org/voices/global-economic-outlook-five-charts-1
Of course, their big caveat is not COVID, but rather climate change. Ooooo. Definitely a dry finger in the wind.
The Conference Board kind of goes along with the World Bank.
• 2021 – 5.6%
• 2022 – 3.5%
• 2023 – 2.9%
https://www.conference-board.org/research/us-forecast
Grow up.
Here is what they really said:
“After rebounding to an estimated 5.5 percent in 2021, global growth is expected to decelerate markedly in 2022—to 4.1 percent, reflecting continued COVID-19 flare-ups, diminished fiscal support, and lingering supply bottlenecks.
Although output and investment in advanced economies are projected to return to pre-pandemic trends next year, they will remain below in emerging market and developing economies (EMDEs), owing to lower vaccination rates, tighter fiscal and monetary policies, and more persistent scarring from the pandemic.
Various downside risks cloud the outlook, including simultaneous Omicron-driven economic disruptions, further supply bottlenecks, a de-anchoring of inflation expectations, financial stress, climate-related disasters, and a weakening of long-term growth drivers. Because EMDEs have limited policy space to provide additional support if needed, these downside risks heighten the possibility of a hard landing.
This underscores the importance of strengthening global cooperation to foster rapid and equitable vaccine distribution, calibrate health and economic policies, enhance debt sustainability in the poorest countries, and tackle the mounting costs of climate change.”
No wet finger in the wind. The only thing wet is your underwear from getting caught lying. COVID is a factor after all. And FYI “climate change” is not an accurate short hand from disasters created by climate change. No go back and tell Kelly Anne Conway to give you more honest talking points.
Frac spread count up 10 to 254.
https://www.youtube.com/watch?v=itLTspBj4Yg
Nice jump, but this is still return to work from the holidays . Was 274, I think, before we started getting the seasonal Xmas effect.
I’d like to see rigs at 600 (oil-directed) and spreads (not broken out) at 300. That would set us up for more reasonable US growth (1MM bopd+) where US starts the threaten consuming all global demand growth and impacts OPEC cartel cohesion (with resultant price impact).
We will have to see how it plays. Has been too slow to ramp up, previously. But this is a new year.
Rents spiked 18% in 2021 followed by a less than usual cool down late in the year.
https://www.apartmentlist.com/research/national-rent-data
Hard to believe that this wouldn’t continue to drive imputed rents a lot higher in 2022. That plus rising housing construction costs and a tight market.
Off topic, just a bit of economic research (and peer review) trivia –
Many readers here will remember when back in 2013, a bit of srutiny by Pollin, Herndon and Ash uncovered egregious errors in “Growth in a Time of Debt” by Reinhart and Rogoff. The finding of the paper, that government debt above 90% of GDP is harmful to growth, was completely undone by the errors, too late to avoid public policy errors predicated on the study.
Well, it seems like there had been another kinda high-profile instance of getting the math wrong. This time, though, instead of the result blowing away like dust once the error was discovered, the result was strengthened. The paper in question is “Housing Constraints and Spatial Misallocation” by Hsieh and Moretti:
https://scholar.google.com/scholar?q=related:dIcDM4LzKxEJ:scholar.google.com/&scioq=housing+constraints+and+spatial+misallocation&hl=en&as_sdt=0,39&as_vis=1#d=gs_qabs&u=%23p%3DdIcDM4LzKxEJ
As the Google Scholar data show, this paper has been cited a bunch. The main point is that housing regulations in high-productivity urban areas undermine growth. Turns out, construction limits undermine growth quite a lot if you do the math right:
https://www.econlib.org/a-correction-on-housing-regulation/
It took roughly three years to find the errors Reinhart and Rogoff made. It took two years to find the errors in Hsieh and Moretti. I suppose the moral of the story is that anyone can make math errors, but the world mostly takes for granted that economists won’t get the easy math wrong.
Oh, and double counting in “Dow 36,000”. That wasn’t so much a simple math error as a conceptual error played out through math. Pretty bad.
Very interesting. 5-star comment.
I know this has been a hot debate out in California. I do think some policy changes could help the shortage of housing out west. Obviously high demand will always be there, short of a gargantuan tsunami or the earthquake they’ve been waiting for.
The flaw in DOW 36000 was pretty obvious. The authors assumed a reasonable growth rate in sales, profits, and cash flows but note cash flows = profits minus the investment in new tangible assets to support growing sales. The authors assumes cash flows = profits which is just dumb. Of course neither author should be trusted to accurately measure the value of anything beyond the trash can where their book belonged.