From Baumeister, Leiva-León, and Sims, “Tracking Weekly State-Level Economic Conditions”:
Most studies in this literature have focused on measures of cyclical variation in real activity at the national level. Much less attention has been devoted to corresponding measures at the state level. The only ones we are aware of are the monthly coincident indices for the 50 U.S. states of Crone and Clayton-Matthews (2005), reviewed by Chinn and LeCloux (2018) and regularly updated by the Federal Reserve Bank of Philadelphia. These indicators of state-level economic activity are based on a small set of data series which exclusively capture labor market dynamics.2
One of the contributions of our paper is to extend recent efforts to measure weekly economic conditions to the state level. For this purpose, we assemble a diverse state-level database that combines new high-frequency data — such as credit and debit card spending, business applications, and mobility indices — with more traditional low-frequency indicators such as employment and income. Specifically, we include weekly, monthly, and quarterly data series that cover different aspects of state economies, such as labor market indicators, household spending, real economic activity, mobility measures, financial indicators, and expectations measures.3 Recently, Bokun, Jackson, Kliesen, and Owyang (2020) compiled a real-time dataset for U.S. states that contains both monthly and quarterly variables, but no weekly variables. Another feature that distinguishes our dataset from theirs is that they focus on the sectoral breakdown of employment and output data, while we include a variety of non-standard variables (e.g., electricity consumption, vehicle miles traveled, oil rig counts, coal and oil production) to capture state-specific characteristics as well as to obtain a more comprehensive measure of economic conditions for each U.S. state.
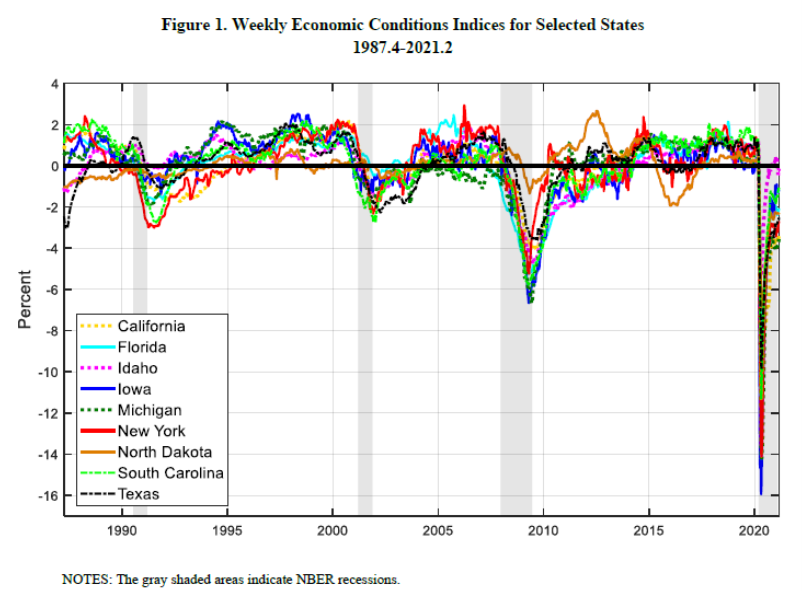
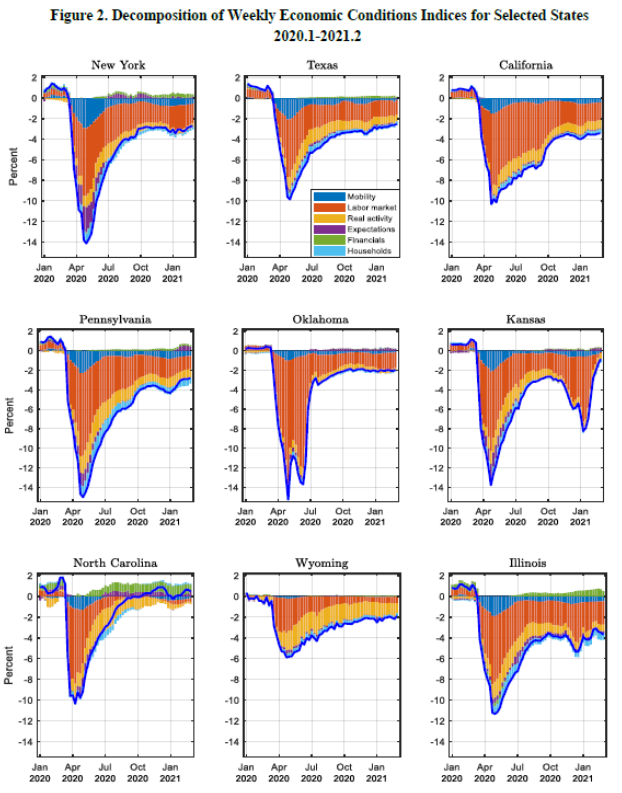
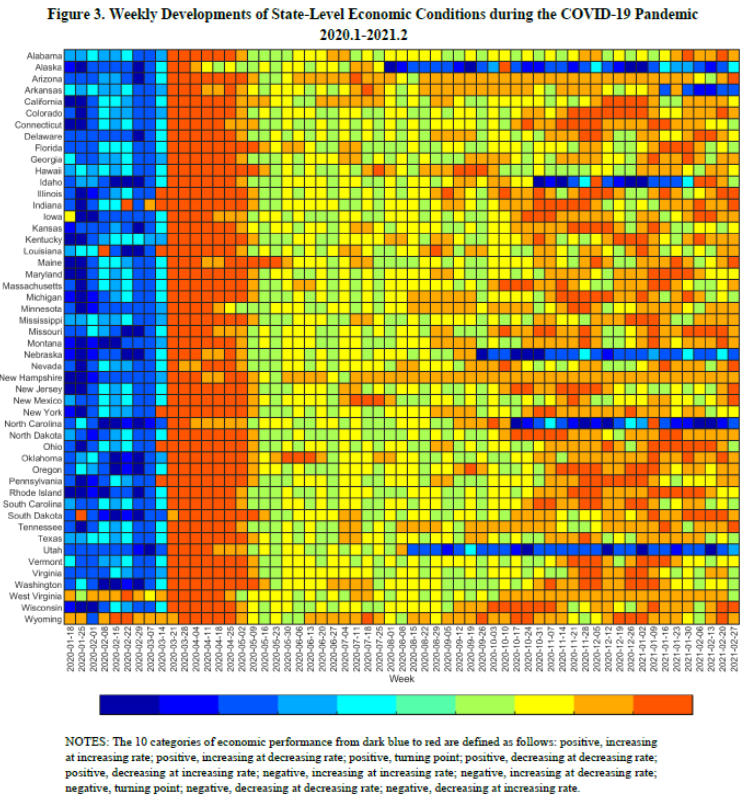
We use the resulting state-level indicators of economic conditions to study similarities and differences in the length, depth, and timing of business cycles across individual states with a particular focus on the four most recent recessionary episodes over the period 1987-2021.4 We show that there is considerable cross-state heterogeneity along all three criteria during the early 2000s slowdown and the Great Recession, while the COVID-19 downturn was nearly perfectly synchronous across states, even though the magnitude of the economic fallout differed greatly. Given that the indicators cover multiple dimensions of state economies, we can decompose economic fluctuations into their main underlying driving forces. For example, adverse labor market developments and the abrupt decline in mobility were the key determinants of the economic collapse in the early stages of the COVID-19 pandemic for most states, whereas the sources of the subsequent recovery are more diverse, even though the labor market continues to play an important role.
This is an important paper for researchers and policymakers who need to track the evolution of sub-national economies at a higher frequency than the standard quarterly or monthly. The usefulness of the methodology is illustrated by these figures from the paper.
Source: Baumeister, Leiva-León, and Sims, “Tracking Weekly State-Level Economic Conditions”
Source: Baumeister, Leiva-León, and Sims, “Tracking Weekly State-Level Economic Conditions”
Source: Baumeister, Leiva-León, and Sims, “Tracking Weekly State-Level Economic Conditions”
My early (and extraordinarily simple) paper with Ryan LeCloux on the subject of tracking state economies at monthly/quarterly frequencies) using extant data series here.
Does anyone else think that if you overlay gas prices on top of oil prices over the last 6 months it makes an interesting little graph and what that might tell us as it relates to actual inflation vs market speculation?? That is if we looked at different commodities right now, how much of that price movement is just from traders trying to get a quick buck off the reflation trade?? This is an earnest question I’m asking, though regulars here know I think from a pure economy-wide perspective I view this as reflation.
We use the resulting state-level indicators of economic conditions to study similarities and differences in the length, depth, and timing of business cycles across individual states with a particular focus on the four most recent recessionary episodes over the period 1987-2021. We show that there is considerable cross-state heterogeneity along all three criteria during the early 2000s slowdown and the Great Recession, while the COVID-19 downturn was nearly perfectly synchronous across states, even though the magnitude of the economic fallout differed greatly….
[ Really nice planning device, though judging from the writing of Paul Krugman state and city planning are distressingly to no avail:
https://www.nytimes.com/2021/06/25/opinion/new-york-real-estate.html
June 25, 2021
Wonking out: What New York could learn from Utica
By Paul Krugman ]
http://www.xinhuanet.com/english/2021-07/10/c_1310053656.htm
July 10, 2021
Over 1.36 bln doses of COVID-19 vaccines administered in China
BEIJING — More than 1.36 billion doses of COVID-19 vaccines had been administered in China as of Friday, the National Health Commission announced on Saturday.
[ Another 500 million doses of Chinese vaccines have been distributed internationally. ]
Thinking back to comments on the growing of rice, I happened to notice that Haiti is a major importer of United States rice. That of course should make no sense for a necessarily largely agricultural country in which rice is easily grown and should be a prime crop for small farmers. However, it turns out that the US forced Haiti to drop tariffs on rice and US rice, which is in turn subsidized, could then be imported and sold at a lower price than Haitian farmers could afford to sell rice and an important Haitian crop was soon gone.