Beware the headlines — month-on-month inflation is (again) down, even if up year-on-year. Trimmed and chained CPI price inflation are also down, while sticky price inflation was flat. Headline and core CPI did surprise on the upside though (m/m, 10 bps over Bloomberg consensus).
First, recall 12 month inflation rates (aka y/y rates) are largely backward looking. Month-on-month measures are more reflective of current conditions, albeit more noisy.
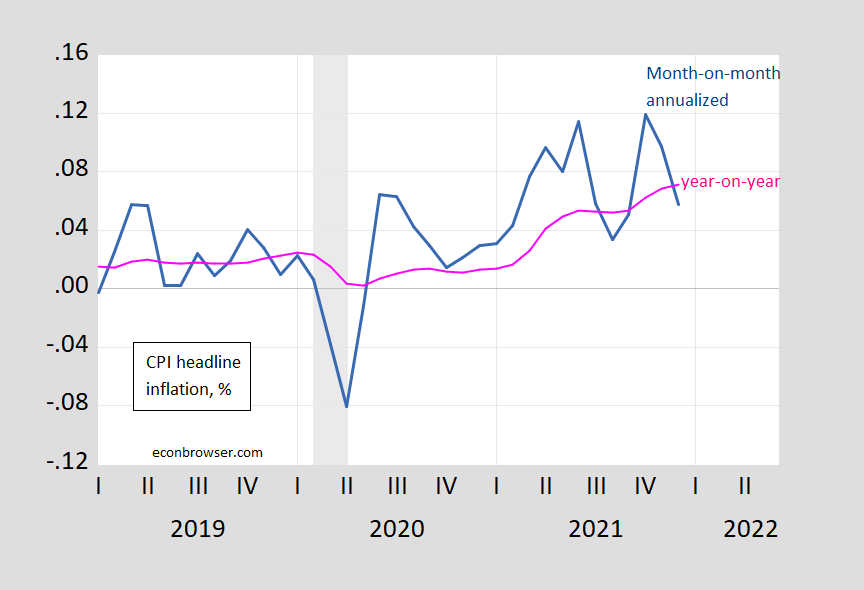
Figure 1: CPI month-on-month inflation rate, annualized (blue), 12 month or year-on-year inflation rate (pink), in decimal form (i.e., 0.05 means 5%). NBER defined peak-to-trough recession dates shaded gray. Source: BLS, NBER, and author’s calculations.
For core inflation, there’s a slightly different picture, with y/y rising as m/m stays elevated.
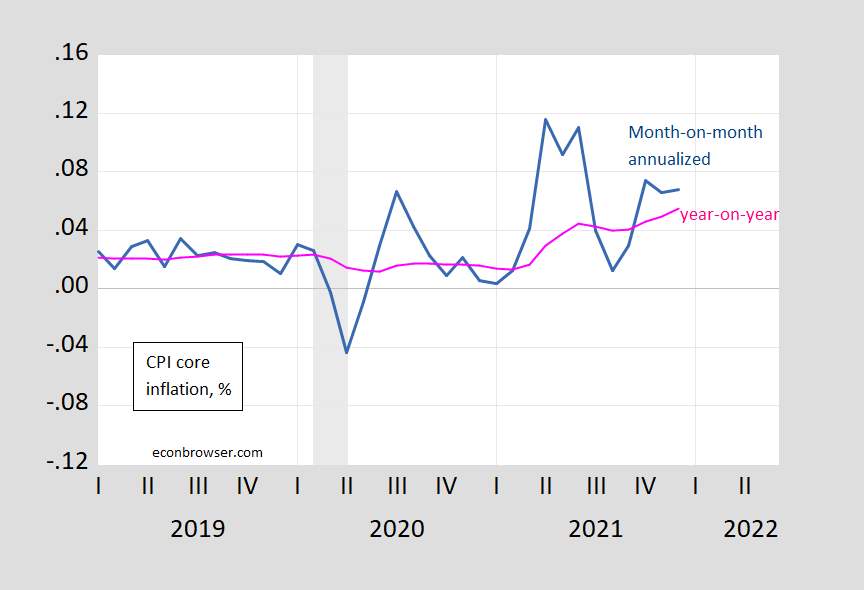
Figure 2: CPI core month-on-month inflation rate, annualized (blue), 12 month or year-on-year inflation rate (pink), in decimal form (i.e., 0.05 means 5%). NBER defined peak-to-trough recession dates shaded gray. Source: BLS, NBER, and author’s calculations.
What do other measures of overall inflation look like on a m/m basis?
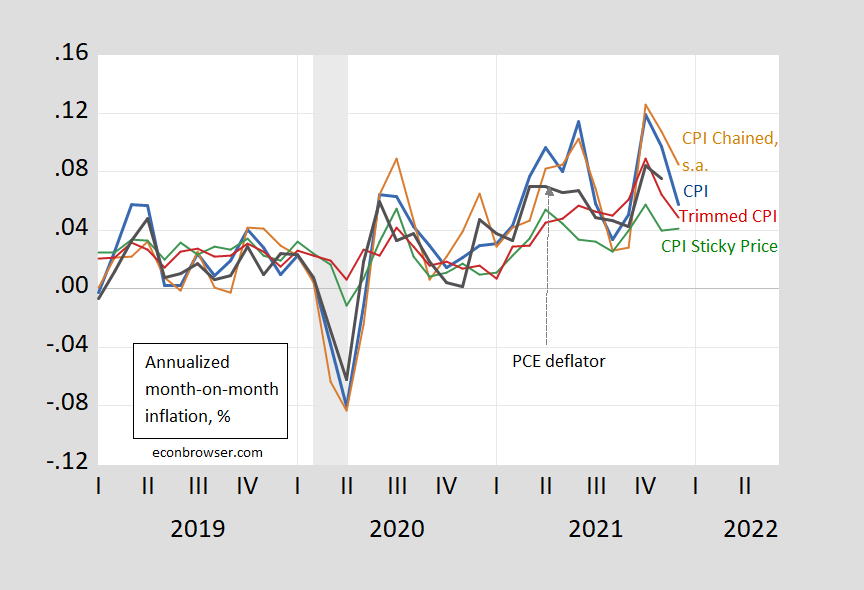
Figure 3: Month-on-month inflation of CPI (blue), chained CPI (brown), 16% trimmed CPI inflation (red), sticky price CPI inflation (green), personal consumption expenditure deflator inflation (black), all in decimal form (i.e., 0.05 means 5%). Chained CPI seasonally adjusted using arithmetic deviations (brown). NBER defined recession dates (peak-to-trough) shaded gray. Source: BLS, BEA, Atlanta Fed, NBER, and author’s calculations.
Chained CPI m/m inflation is down, as is trimmed mean, while sticky price inflation held flat . A lower trimmed mean inflation means that the decline is broad-based, and not being driven by outliers. Flat sticky price inflation means that infrequently changed prices are continuing to rise at the same pace as in November.
Moving to core measures (i.e., excluding food and energy prices), we see the following picture (note the vertical scale is made to have the same range as in Figure 3 to better illustrate how core measures have exhibited less variability).
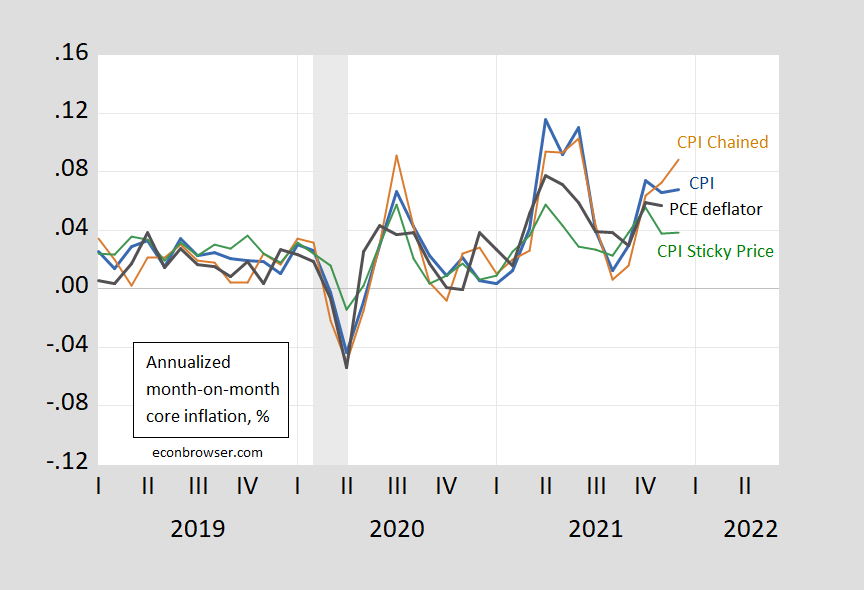
Figure 4: Month-on-month CPI core inflation (blue), chained CPI core (brown), sticky price CPI core inflation (green), personal consumption expenditure core deflator inflation (black), all in decimal form (i.e., 0.05 means 5%). Chained CPI seasonally adjusted using arithmetic deviations (brown). NBER defined recession dates (peak-to-trough) shaded gray. Source: BLS, BEA, Atlanta Fed, NBER, and author’s calculations.
Beware of “records”. On a month-on-month basis, inflation has been higher over the past 20 years.
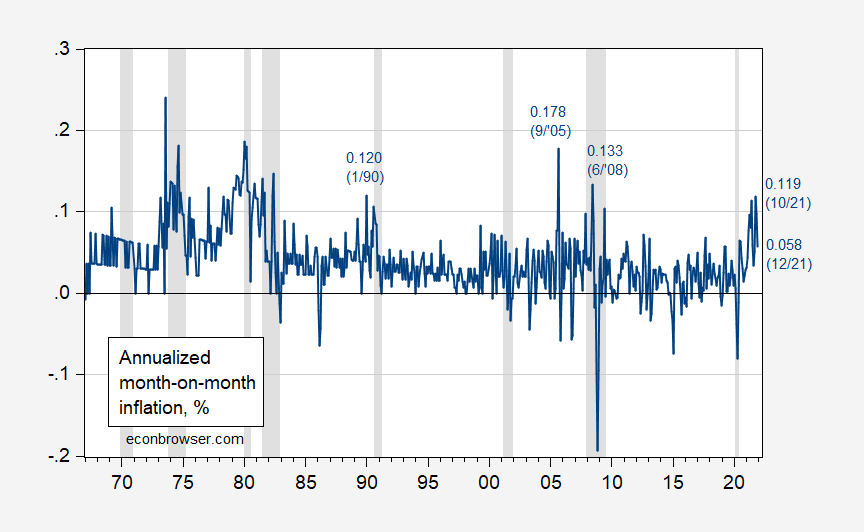
Figure 5: CPI month-on-month inflation rate, annualized (blue), in decimal form (i.e., 0.05 means 5%). NBER defined peak-to-trough recession dates shaded gray. Source: BLS, NBER, and author’s calculations.
So, on a month-to-month basis, inflation is now nowhere near record highs.
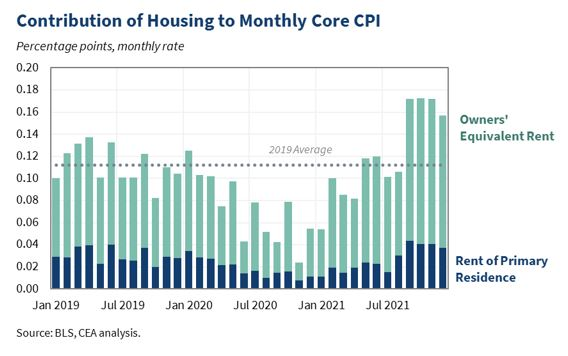
Going forward, shelter costs are likely to have a measurable impact. CEA shows the contribution of owner occupied equivalent rent and rent of primary residence to headline CPI, y/y.
Despite the upside surprise, the 5 year inflation breakeven (unadjusted) fell 5 bps.
Nice post. Your 1st graph appeared over at Kevin Drum’s place but of course you got down into the details as well. Alas the CBS Evening News went all Fox and Friends arguing inflation is out of control.
Beware of Econ bloggers. The following quote is from July…
“a measure that focuses on infrequently changed prices — the sticky price CPI — has declined, suggesting easing pressures”.
Since then the sticky price CPI has largely increased.
Yeah, I’ve noticed a tendency to get excited about M/M improvements. Brent crude is almost $85 after earlier declines. Lumber closed at $1200 after late summer drop. Hmmm…I wonder why Krugman and Frankel aren’t all over those tariffs on Canadian lumber. Getting rid of them might actually help reduce new housing costs. But no, it’s better to whine about tariffs on $1000 washing machines, which people buy only a couple times in their lives!
Also, Michael Hudson thinks he has identified a culprit for inflation: $4.5 Trillion in illegal loans by the Fed to three Wall Street banks:
“ There was actually no liquidity crisis whatsoever. And Pam Martens is very clear about that. She points out the reason that the regular newspapers don’t report it is the loans violated every element of the Dodd-Frank laws that were supposed to prevent the Fed from making loans to particular banks that were not part of a liquidity crisis.
In her article, she makes very clear by pointing out these three banks, Chase Manhattan, Goldman Sachs – which used to be a brokerage firm – and Citibank, that the Federal Reserve laws and the Dodd-Frank Act explicitly prevent the Fed from making loans to particular banks.
It can only make loans if there’s a general liquidity crisis. And we know that there wasn’t at that time, because she lists the banks that borrowed money, and there were very few of them.” (Amazing how often Citibank is at the center of one scandal or another!)
https://michael-hudson.com/2022/01/inflation-and-illegal-repo-loans/
And here we were told that corruption at the Fed just had to do with insider trading! Sounds like it’s time for Bernie to demand another GAO audit of the Fed, something that is sure to cause pgl conniption fits!
JohnH: Well, Frankel did write about steel tariffs, here (where some steel is sometimes used in houses instead of lumber). I think you made 5 comments on this post.
His opening comment started with “Once again, Frankel beats the drums for rolling back the Trump tariffs, a fairly minor contributor to inflation”.
Of course in JohnH’s world, no one uses steel for construction but lumber is used extensively. This is why termites love JohnH’s construction company!
JohnH,
I agree with you that Biden should get rid of the lumber tariffs. I do not get why he has not done so, it is such an obvious anti-inflationary move, not to mention one that would improve relations with our neighbor and ally.
“Michael Hudson thinks he has identified a culprit for inflation: $4.5 Trillion in illegal loans by the Fed to three Wall Street banks”.
You are misrepresenting what Hudson said. I get it is a long discussion. I get that there was a discussion of the violations of Dodd-Frank. But if you actually read carefully he explicitly distinguished between this alleged manufactured liquidity crisis and what he saw was the drivers of inflation.
You have a terrible habit of providing a link to what would otherwise be an important discussion and then totally misrepresenting what your own source said.
“Getting rid of them might actually help reduce new housing costs.”
Now this might be true but there was this JohnH who kept hammering the reason lumber prices were high was not related to tariffs but rather due to some incredible oligopoly power in the lumber sector. Could you please tell that other JohnH to stop contradicting you?
Thanks pgl for the opening to talk about monopoly in lumber markets:
“Take lumber, whose pricing increased dramatically earlier this year. As Sandeep Vaheesan pointed out, there’s a very clear predatory pricing monopoly story here. In the early 2000s, Ross-Simmons Hardwood sued lumber giant Weyerhaeuser Co. A key cost for lumber mills is the price of logs, and Ross-Simmons accused Weyerhaeuser of artificially paying more for logs to drive competitors out of business. This practice was similar to Uber incurring losses to subsidize the cost of rides to underprice taxis and capture the market, only in this case it was Weyerhaeuser incurring losses to keep the price of logs higher than they should be.
As Vaheesan put it, this behavior changed the market. “Why invest in sawmills,” he asked, “if dominant players will buy up necessary inputs as a means of crushing the margins of competitors?” Though a jury agreed that Weyerhaeuser was engaged in predatory conduct, in 2007, the Supreme Court ruled in favor of Weyerhaeuser. And whaddya know, during the pandemic lumber prices spiked, even as tree growers didn’t see the benefit. More broadly, this ruling undermined small producers in capital heavy industries, who had less of a reason to invest in capacity.
This decision, like many others, was part of a forty year trend of facilitating monopolies. It wasn’t necessarily done in bad faith; policymakers followed the lead of economists, who believed dominant firms were dominant because they were efficient. This faith in efficiency over all else meant that the public structuring of markets to force resiliency – aka regulation – was illegitimate. So too were attempts to use public rules like tariffs to retain domestic production of key goods.”
https://mattstoller.substack.com/p/counterfeit-capitalism-why-a-monopolized
Strange how economists adamantly refuse to talk about how monopolies are contributing to inflation…IOW, people shouldn’t believe their lying eyes that some highly concentrated industries are clearly engaged in price gouging…inflating prices
Instead they avoid the issue and hide behind the claim that monopolies do not cause inflation, which has some merit … as far as it goes.
I have never denied that we should have more competition for goods like lumber but if you think the steel sector is more competitive than the lumber sector, you are beyond dumb. And yet you dismissed the role of trade protection in affecting steel prices. Consistency has never been your forte.
The court decision in this anti-trust lawsuit is a nice read of how the timber sector works:
https://www.law.cornell.edu/supct/html/05-381.ZO.html
Weyerhaeuser was found guilty of anti-trust violations but I guess its lawyers paid off those Federalists at the Supreme Court. Biden needs to pack this court for many reasons.
“This decision, like many others, was part of a forty year trend of facilitating monopolies. It wasn’t necessarily done in bad faith; policymakers followed the lead of economists, who believed dominant firms were dominant because they were efficient. This faith in efficiency over all else meant that the public structuring of markets to force resiliency – aka regulation – was illegitimate.”
BTW Robert Bork is not an economist. You are spouting his view of these things but there is an entire economic literature noting why Bork was wrong. Try reading basic economics sometimes.
I was curious who this Matt Stoller was so I searched for his bio. I guess you did not know you were citing someone endorsed by the Federalist Society:
https://fedsoc.org/contributors/matt-stoller
Odd – that court decision against Weyenhauser was overturned by a bunch of Federalists on the Supreme Court. Maybe we will get Ted Cruz to mansplain all of this to everyone!
Beware of Econ bloggers part II. The following quote is from June…
“However, my view is that the 7% y/y inflation … is not particularly plausible.”
Since then 7% y/y inflation has been quite plausible.
Econned: Well, at the time, I thought that was the case. I didn’t foresee (1) omicron, (2) continued dollar weakness against CNY, (3) the incredible stupidity of so many people refusing to get vaxxed. Count *me* stupid on the latter – I should’ve known better.
Don’t be so hard on yourself. You just didn’t forecast well. That’s it. But most anyone who pays attention is fully aware that not foreseeing other events/impacts/etc is one of the primary reasons so many forecasts go awry in the first place – so I don’t understand your attempted ‘explaination’ other than to make yourself feel good? But maybe you shouldn’t have so brashly asserted that 7% y/y inflation was “not particularly plausible”. But, again, your choice of definitions may differ from others!!!
You should however create a blog post about these two poor projections (how many others are there?) regarding inflation. Especially so considering one of your failed projections was directly criticizing the projections of another. You’ll likely just let the egg run down your face noticed by only a few – that’ll keep moral up!!!
Econned: In the grand scheme of things, I don’t feel bad. After all, I wrote a whole paper in 2005 on how massive trade deficits and binge spending was going to lead to grief, and I think that was a defining event of my generation of US macro people. And contra lots of people, I was right!
Menzie, I am not at all surprised that your (failed) attempt at sh*tt*ng on other’s projections doesn’t make you “feel bad”. After all, it seems to be one of your primary objectives in this blog. And contra lots of people, you seem to thrive in fostering such behavior.
Econned,
This will be my only comment on this, given your tendency to go on and on while moving every goal post in site and making up fresh lies as you do so. Thus you will have an opportunity to make some snarky remark after mine attempting to justify yourself, but there will be nothing further on this one here from me.
So by my count, with one from another thread, you have made 5 snarky remarks about Menzie’s failed forecast, highlighting this one word “plausible.” in a slam that has gotten pretty nasty and personal, which you do to him regularly, as well as nearly everybody else around here. He has made two pretty reasonable remarks in response, admitting that he got it wrong, along with the vast majority of the profession. This is pretty par for the course for you, way overdone personal insults repeated a lot, which nobody supports you on. Why are your occasional allies not dashing forward to support you with all this? They get it that you are the worst troll on this blog, by a longshot.
So, Econned, on another thread I challenged you to remind us of a single post you have made here that made a substantive comment on economics that was accurate and original. I grant that some of your recent remarks have been a bit more substantive, although none of them all that outstanding. In any case, you have not responded to that challenge, presumably because you think you are above everybody here, although there is plenty of evidence to suggest that is not remotely the case. As it is here, you are back to your repeated personal insults, not mitigated by a shred of evidence that you might actually be a decent human being somewhere inside you.
After all, Moses Herzog and CoRev do a lot of slamming and putting up unreliable stuff here. But both seem to actually be decent human beings at some level. And for all his blundering, I would say that Moses in particular occasionally does put up posts that are substantive, correct, and original. Still waiting to see anything like that out of you, troll..
Have a nice day.
Oh, boy another Barkley sighting where he announces it will be his final/last comment. Guess what? I’m not reading it beyond the first sentence because that single sentence made me exceptionally happy and sad at the same time. What will we do now that Barkley Rosser will not reply? Mourn the loss and hope for more from him tomorrow is is all we can do.
“This is pretty par for the course for you, way overdone personal insults repeated a lot, which nobody supports you on.”
All of what you wrote may be true but notice Econned gets all whiney and pissy when anyone dares criticize anything he tries to offer up. Two faced as it gets.
PaGLiacci,
I get “all whiney and pissy” when commenters attack but do so on areas unrelated to the topic at hand. You’re aware because you’re a serial offender. Same with Barkley Rosser. Also you folks are horrible at separating comments with your emotions. As such, I’ll “whine and piss” about it because somebody needs to call you out.
Economists surveyed by Bloomberg may have expected slightly mre inflation in December, but currency and bond market traders apparently did not. I never want to read too much into short-term price movements, but the dollar and bond yields edged lower and futures pricing of Fed rate hikes weren’t much changed at the end of today’s session. Rate hike expectations have been rising fast enough that traders probably got ahead of their economists.
I read somewhere recently (you’ll just have to trust me it was a reliable source) that because there was less house buying, that leasing property was going to increase in “popularity”. So, no matter how anyone wants to portray it, if you’re paying for something, and not getting any equity out of it each time you pay, that’s a more expensive proposition. I think we will see much much more of this over the next 5–10 years and conceivably into any foreseeable future a kind of “compulsory leasing” or “inescapable leasing” of living quarters. Which I think in an indirect way, is what Menzie is showing in that last graphic with the green and navy blue bars. Specifically that navy blue bar is going to become MUCH MUCH bigger
Presumaly why core inflation is higher than overall is due to a sharp decline in gasoline price increases that many of us have been calling for some time, now kicking in. Of course crude prices have been rising again so we may see retail gasoline prices start to rise again, although they have only done so a bit so far recently.
Barkley Rosser, March 8, 2021:
“Steven,
I do not rule out $100 per barrel, especially as I am aware that the price of oil can move very sharply over short periods of time,”
https://econbrowser.com/archives/2021/03/oil-prices-and-oil-futures#comment-250311
Remember Junior, we’re all counting on your wisdom.
Moses,
And it was within the range of confidence intervals at that time. Even Menzie agrees with that assessment. You are just making yourself look foolish yet again by bringing this up. I was right. You are beginning to look like a bad imitation in the opposite direction of rsm on this.
I posed a range of $40 to $100, which at that time was a pair of bounds within the 95% confidence interval, which was even wider then. Again, crude oil prices are highly volatile. We saw a more than $10 price change in one day. Three days in a row of that in either direction would have hit the bounds We have seen moves far greater than those numerous times in history. This repeated posting of this by you simply shows that not only do you not know much about statistics, you also know very little about the history of the oil industry, even though the latter has been discussed here by me numerous times.
As it was, it was completely reasonable last March to expect a wide range of possible outcomes of lots of economic variables. The reason was that it was completely reasonable to expect we would see more new Covid variants, the implications of which were hard to forecast. And indeed we did see two more, with that more than $10 crude price drop happening when the omicron variant was publicly announced. That lots of people were making erroneous forecasts can be seen by how so many were wrong about inflation, including me at that point in time.
As it was the mean for my range was $70, about where it was back then and about $5 below where it was at end of year.
Back in the spring, when individual monthly rates equating to annualized 4%+, those were dismissed as individual datum. Now we’ve had 12 months and have a resultant 7% increase.
There’s also an issue of looking at the annualized month for insight when it’s down. But do we also say (hey, the TTM number is not that bad, but look at the 12% annualized back in June?)
Also, of course, even the specific monthly increase last month was still higher than the 4%+ (annualized) that was worrying people in the spring. So there’s a certain issue of level, regardless of (short term) downtrend.
Also, look at JUN or so in your graph. Had a drop and then went up. So just because this month was down, doesn’t mean trend continues. Think there is some jitter in the monthly numbers.
————-
Also, as far as energy prices, current administration has some responsibility there. OPEC has been emboldened by US oil and gas being under a cloud. Very aggressive stance when they moved into office (leasing freeze, later ruled illegal, permitting freeze, COP21, methane regulations, Keystone cancelled). Flirting with export controls (tool in the toolbox). “Windfall profits” comments. I’ve even heard comments on the left that maybe higher gasoline prices are a feature, not a bug. Drives conversion away from FF.
It’s not just the specific actions, but the forward looking impact of an anti-fossil fuels administration which comes from both actions and comments. Affects willingness to invest capital. Activity (rig count) is far below that during Obama and Trump, given same prices.
https://twitter.com/RobertClarke_WM/status/1453017667137323010
Thus it’s not just a time lag. It’s slower production response. (Consider we are looking at about 0.5 MM bopd for next couple years, per EIA. And we had 2 MM bopd for 18 months (2H17-18). We even still had 1 MM bopd in 2019, at lower prices, and with a higher overall level and on top of recent production increase (very difficult given a lot of “Red Queen” to fight with from the 17-18 increase).
《It’s slower production response. 》
Is this due to capitalism allocating resources inefficiently, or real physical scarcity?
Is inflation a choice?
What concerns me about inflation is the break-point unit root of the core cpi log values starting about June 2020, FRED series, CPILFESL. Not a lot of data points but seems concerning for an amateur. A trend model forecasted a December 2021 monthly increase of 0.56% for core CPI compared to 0.55% reported. The same model forecasts a monthly increase of 0.52% for January 2022.
Core PPI also shows a breakpoint unit root since about 2020m04. The PPI trend model is not as tidy as the core CPI trend model.
I defer to the experts, but still concerned. I understand that trends continue until they don’t, but when will the trend end?
I meant to say that the null hypotheses of unit roots for the log of core cpi and core ppi are rejected due to the break-point unit root test.
Kevin Drum details the price changes by good:
https://jabberwocking.com/oranges-are-up-tomatoes-are-down/
Eat more tomatoes and less oranges! And I do need to buy some new underwear, which just got cheaper.
Above, AS, “I meant to say that the null hypotheses of unit roots for the log of core cpi and core ppi are rejected due to the break-point unit root test.”
I have a bag of [some of them are] comical business clichés.
“Rearranging the deck chairs on Titanic.” comes to mind.
Conversely, nobody is laughing.
T.Shaw,
Thanks for your comments.
The deterministic trend of core CPI since June 2020 is what concerns me, since I have not noticed a deterministic trend in the past. Sorry for being unclear. The break-point test indicates that we reject an alternate explanation of the nature of the data since June 2020 in favor of a deterministic trend, but there is a break in the trend, that occurred in January 2021 when the trend became steeper. As mentioned, I have not noticed a deterministic trend in core CPI going back to 1970.
be careful of a misdirection from this report on tomorrow’s real retail sales… the CPI for commodities less food and energy commodities was up 1.2% in December and is now up 10.7% from a year ago…i know i’ve caused some confusion with citing that index before, but that’s the CPI index that includes prices of TVs, cars, and clothing, not what one would normally think of as “commodities”
https://fred.stlouisfed.org/series/CUUR0000SACL1E#0
we would be better served if the BLS called it “the composite price index of all goods less food and energy goods” or something similar..
it’s the index i use to deflate core retail sales, computing real groceries and gasoline sales separately…
Up 1.2% or 0.9%?
Either 1.2% or 0.9% would really change th implication of nominal retail sales data m/m.
i just checked, and it was up 1.2% in December after rising 0.9% in November….it’s not just higher car prices; the price index for laundry equipment rose 3.4%, the price index for living room, kitchen, and dining room furniture rose 3.1%, the apparel price index was 1.7% higher, etc
scroll past the energy entries to “Commodities less food and energy commodities” in this detailed table to see the price changes in the components:
https://www.bls.gov/news.release/cpi.t02.htm
ok, it looks like i’m probably citing the wrong FRED graph on that, macroduck, but i’m unable to find one matching the BLS data..
I’ll put it here too. Gasoline prices dropped by 2 cents per gallon where I am, and while WTI still over $81, crude prices have also declined for the last two days.