Fama (JME, 1984), and Tryon (1979) demonstrated that changes in the exchange rate do not equal the forward premium, in what came to be known as the forward premium puzzle. Since the forward premium equals the interest differential in the absence of current and incipient capital controls and in the absence of default risk — this finding is equivalent to the result that interest rates, after accounting for exchange rate changes, are not equalized on average.
In other words, if the yield on the US default-risk-free bond is 2% and the yield on a UK default-risk-free bond is 5%, then the US dollar does not on average appreciate by 3% against the pound in order to equalize returns. This finding could be explained, for instance, by the presence of a time-varying exchange risk premium on pound sterling assets (vs. dollar assets); however, it’s not been easy to find robust evidence of determinants of such a time varying premium.
While this puzzle has largely persisted in the ensuing 25 years, it seemingly disappeared during and after the global financial crisis — until re-appearing in recent years.
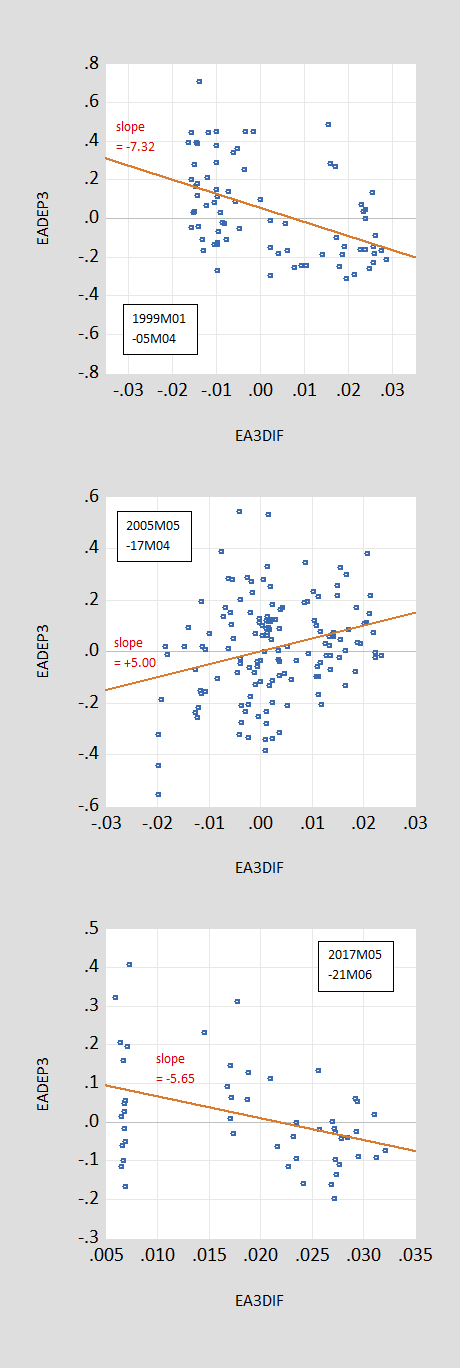
Figure 1: Ex post 3 month annualized depreciation of euro/dollar (vertical axis) against 3 month offshore US-euro interest differential (horizontal axis), for 1999M01-2005M04 (top figure), for 2005M05-2017M04 (middle figure), and 2017M05-2021M06 (bottom figure). Samples pertain to interest rate data, so 1999M01-2005M04 sample includes 3 month ex post depreciation up to 2005M07.
Recall the puzzle: If the joint hypothesis of uncovered interest rate parity (UIP) and full information rational expectations –- sometimes termed the unbiasedness hypothesis — held, then the slope of the regression lines (in red) would be indistinguishable from unity. In the top panel 1999M01-2005M04), the slope coefficient is significantly different from that value at the 10% msl. (We can’t test for UIP directly because the market’s expectation of depreciation is unobserved.) This pattern of coefficient reversal holds up for other dollar-based exchange rates, as well as for other currency pairs (with a couple exceptions). The fact that the coefficient is positive in the post-global financial crisis period is what we term “the New Fama puzzle”, in a newly revised NBER Working Paper No 24342 (ungated version working paper), coauthored with Laurent Ferrara (SKEMA Business School), Matthieu Bussière (Banque de France), and Jonas Heipertz (Columbia Business School).
Uncovered interest parity is one of the most central concepts in international finance. At the same time, empirical validation of this concept has proven elusive. In fact, the failure of the joint hypothesis of uncovered interest rate parity (UIP) and rational expectations – sometimes termed the unbiasedness hypothesis – is one of the most robust empirical regularities in the literature, vigorously examined since Fama’s (1984) finding that interest rate differentials point in the wrong direction for subsequent ex-post changes in exchange rates.
The most commonplace explanations – such as the existence of an exchange risk premium, which drives a wedge between forward rates and expected future spot rates – have some empirical verification, albeit fragile (we’re investigating yields on assets like pound sterling, Japanese yen, Swiss franc, not Chinese yuan or Argentine pesos). In our explanation, we’ll take an alternative approach relating to expectations, for the reasons discussed below.
In the middle panel of Figure 1 (2005M05-2017M04) we show the slope coefficient flips to positive 5.0, significantly different from the value of unity. Finally, in the bottom panel of Figure 1 (2017M05-2021M06), the slope coefficient again flips to a negative value, of -5.65. (In the paper, we examine 1 year horizons and 1 year interest differentials, but the pattern of results are the same.)
One might be tempted to ascribe the move to a positive coefficient in the middle period to a reduction in risk; this doesn’t seem to be very plausible as the period during the financial crisis was one marked by elevated risk, certainly as measured for instance by the VIX. In any case, augmenting the regression with the VIX doesn’t change these slope coefficient estimates.
The use of survey based expectations — thereby dropping the rational expectations hypothesis — data provides the following insights. First, interest differentials and anticipated exchange rate changes are positively correlated across all the subsamples considered, consistent with the proposition that investors tend to equalize at least partially expected returns expressed in common currency terms (see also Chinn and Frankel (2020) for results 1986-2017).
Second, the switch in the β coefficient arises because the correlation of expectations errors (defined as expected minus actual) and interest differentials changes substantially between pre- and post-crisis periods. This is important, as can be seen by examining the probability limit of the β’ coefficient in a Fama regression:
s+1 – s = α’ + β'(i-i*) + error
so:
plim(β’) = 1 – [A] – [B] – [C]
Where
[A] ≡ cov(covered interest diff.,i-i*)/var(i-i*)
[B] ≡ cov(risk premium, i-i*)/var(i-i*)
[C] ≡ cov(forecast error, i-i*)/var(i-i*)
covered interest differential = – [(f – s) – (i-i*)]
risk premium = f – ε(s+1)
forecast error = ε(s+1) – s
f is the forward rate for period +1
s is the current spot exchange rate
ε(s+1) is subjective market expectations of the future spot exchange rate (proxied using Consensus Forecasts survey data).
The decomposition for the euro/dollar (β’-1) is shown in Figure 2 below, for the same subperiods (for annual horizon, as in the paper). The components are shown as theoretical β’-1 + [-A] + [-B] + [-C], so as to add up to the estimated β’-1 (which is the UIP null, red line).
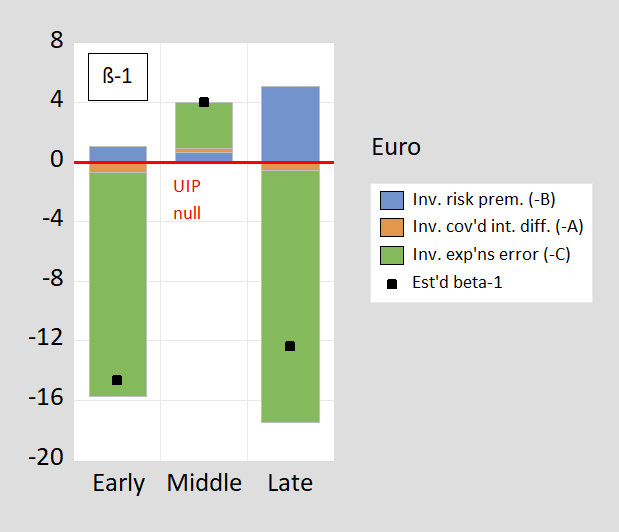
Figure 2: Decomposition of euro/dollar β’-1. [A] is brown, [B] is blue, [C] is green; black square denotes estimated β’, line at 0 denotes theoretical β’-1 under unbiasedness hypothesis, all for 3 month horizon. Black square denotes the OLS point estimate. Early is 1999M01-2005M04, Middle is 2005M05-2017M04 and Late is 2017M05-2021M06. Source: author’s calculations (calculations for 1 year horizon in BCFH (2022).
Exchange risk comovement with the interest differential is not the primary reason why the slope coefficient has switched to positive and then to negative (although the altered behavior of exchange risk does play a role, as shown by the changes in the blue bars). Rather, how expectations errors comove with the interest differential appears of central importance — that is the [C] component (green bar). This correlation changes because in the crisis/post-crisis period (2005M05-17M04), the dollar was weaker anticipated.
Notice that the the covered interest differential (which has widened, right after the financial crisis, and more recently as financial reforms have raised the costs of hedging) and it’s correlation with the interest differential does matter — but not very much compared to expectational errors and their comovements with interest differentials. Hence, we are not ignoring this development (remember, we are using offshore yields, so the covered interest differentials cannot be attributed to capital controls.). For more discussion, see this post, and work by Du, Tepper and Verdelhan (2018) (ungated version).
Why did this occur? We conjecture this has to do with the fact that market expectations were for a more rapid rise in US interest rates — and hence stronger dollar — than actually occurred, particularly before explicit forward guidance is implemented. This conjecture is illustrated using the actual 3 month Treasury yield (which moves very closely with the offshore 3 month yields used in the paper).
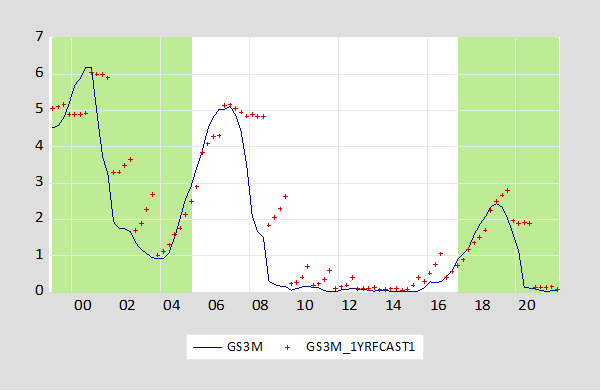
Figure 3: Three month Treasury yield (blue line) and Survey of Professional Forecasters mean forecast (red +) as of Q3, in %. Green shading denotes early, late periods. Source: Federal Reserve Board, Philadelphia Fed.
Finally, notice in our late period, after liftoff in US rates from the zero lower bound, as interest rate expectations match more closely what occurs, the original negative coefficient re-appears. This finding is an addition to our findings previously described in our earlier (2019) post.
One major implication of our findings — which transcends the findings of what the regression coefficient is now versus then — is that the characteristics of exchange rate expectations matter a lot, possibly more than risk attributes of highly substitutable (for dollar) assets.
The ungated version of the paper, here.
Don’t unlimited central bank standing currency swap lines backstop anything more than noise in foreign exchange markets?
Ingredients
Random words about central banks
Random words about financial markets
A pinch of “noise”
Vinegar
Oil
Mix together in a cheap salad bowl.
Would you really serve this to your guests?
Questions and a comment on the reason for my question –
How were the end-points for the periods represented in figure 1 chosen? I ask because the mid-2005 to mid-2017 period doesn’t correspond to any particular events that come to mind. In other words, if the end-points for the GFC-and-after period were narrowed to something that looked more like the GFC and its immediate aftermath, would the results change?
Here’s why I ask. I wonder if accounting for international bank lending flows would explain the switch in sign. There was a sharp decline in international lending after Lehman’s collapse, and the result was a sharp rise in the value of the dollar against other currencies. If that event caused the switch in sign, then it should be possible to impose a mid-2007 end-point and get the same or an even stronger switch in sign.
You have accounted for risk with risk premia, but the banking sector also deals wih risk by withdrawing credit. Withdrawal of international credit, which is concentrated in dollar-denominated loans, has a big impact on the dollar’s foreign exchange value. So if you include international credit flows, you might get a clearer result.
macroduck: As discussed in the paper, we used the Bai-Perron (1998) sequential structural break test to identify the subperiods.
I’ve never seen banking sector credit as an explanatory variable for forward rate bias. Doesn’t mean it might not be there, but portfolio flows are usually more important in forex behavior.
I have in mind things like this, which I’m sure you know well:
“During the financial crisis, a global shortage of dollars occurred, primarily reflecting the funding needs of European banks. Baba, McCauley, and Ramaswamy (2009) show that European banks had substantially increased their U.S. dollar asset positions from about $2 trillion in 1999 to more than $8 trillion by mid-2007. Until the onset of the crisis, these banks had met their funding requirements mainly by borrowing from the unsecured cash and commercial paper markets and by using FX swaps. Unfortunately, most unsecured funding sources eroded during the crisis.”
https://www.newyorkfed.org/research/current_issues/ci15-6.html
I may have been sloppy in referring to “bank credit”, but European banks were mostly relying on U.S. banks as counterparties in swaps, CP and unsecured case borrowing. The sudden reduction in this channel of borrowing amounted to a very large need for dollars to close positions wih U.S. banks a a time when dollar liquidity was very tight. Essentially the same thing happened in the yen market when yen-financed carry trades collapsed. The dola, the yen and the renmimbi were the only positive-return currencies in the period after Lehman collapsed.
You say forward rate bias. I say dollar (and yen) strength. They may amount to the same thing, but I’m only confident in saying withdrawal of credit can induce dollar strenght because international lending tends to be heavily dollar-denominated.
macroduck,
The sign flip occurred early in the second period, which runs from 2005 to 2017. Not obvious due to events surrounding the crisis itself. The need for dollars by European banks at the time of Lehman was less due to the connections of major European banks to US one than it was that many of them have gotten too deep into off-the-wall derivatives and options put out by AIG, which blew up totally when it did, leaving them in a serious crunch. They ran to the ECB, but there was a run on the ECB and it could not help them, causing it to run to the Fed for a big swap that then cooled things down.
The crisis was important in that after it we had this essentially odd period where the forward bias disappeared according to this model of how estimate it, but then it reappeared in 2017, which is the current mystery, or maybe just a return to normal weirdness after this odd period of good behavior in the aftermath of the crisis.
BTW, macroduck, while I initially dismissed it, I cannot rule out that forward strength o USD and yen were what were associated with the forward markets predicting more accurately the actual future than usual, and may even have been associated with that sign switch as well. I do not know. Maybe Menzie does.
Clarida is out.
Can I steal from the profound words of rocker Vince Neal?? “Girl, don’t go away mad, girl, just go away.”
Menzie,
Congratulations. If anything what is surprising given how badly forex markets seem to behave as has been documented over such a long time is that there seems to have been a period after the crisis when they behaved better than usual. Not really surprising that has broken down.
I also think it is cool that you have done work on this with your major prof who initiated the use of using the more realistic survey data for expectations, even as many frowned upon this at the time that he and Froot introduced this back in the 80s. Well done.
Really nice paper.
https://news.cgtn.com/news/2022-01-11/Chinese-mainland-records-192-confirmed-COVID-19-cases-16JbfhV4Lba/index.html
January 11, 2022
Chinese mainland reports 192 new COVID-19 cases
The Chinese mainland recorded 192 confirmed COVID-19 cases on Monday, with 110 linked to local transmissions and 82 from overseas, data from the National Health Commission showed on Tuesday.
A total of 50 new asymptomatic cases were also recorded, and 721 asymptomatic patients remain under medical observation.
Confirmed cases on the Chinese mainland now total 103,968, with the death toll remaining unchanged at 4,636 since January last year.
Chinese mainland new locally transmitted cases
https://news.cgtn.com/news/2022-01-11/Chinese-mainland-records-192-confirmed-COVID-19-cases-16JbfhV4Lba/img/e965b6c0601b4be386b6724724aaf673/e965b6c0601b4be386b6724724aaf673.jpeg
Chinese mainland new imported cases
https://news.cgtn.com/news/2022-01-11/Chinese-mainland-records-192-confirmed-COVID-19-cases-16JbfhV4Lba/img/563afa5186f341508f308024a45adc61/563afa5186f341508f308024a45adc61.jpeg
Chinese mainland new asymptomatic cases
https://news.cgtn.com/news/2022-01-11/Chinese-mainland-records-192-confirmed-COVID-19-cases-16JbfhV4Lba/img/aeac8d77a7604c6ba1dc3b8f071e92d8/aeac8d77a7604c6ba1dc3b8f071e92d8.jpeg
http://www.xinhuanet.com/english/20220111/a64f29a952214ddaa56f151efc9092ad/c.html
January 11, 2022
Over 2.9 bln COVID-19 vaccine doses administered on Chinese mainland
BEIJING — More than 2.9 billion COVID-19 vaccine doses had been administered on the Chinese mainland as of Monday, data from the National Health Commission showed Tuesday.
[ Chinese coronavirus vaccine yearly production capacity is more than 7 billion doses. Along with over 2.9 billion doses of Chinese vaccines administered domestically, more than 2 billion doses have already been distributed to more than 120 countries internationally. Nineteen countries are now producing Chinese vaccines from delivered raw materials. ]
https://www.worldometers.info/coronavirus/
January 10, 2022
Coronavirus
United States
Cases ( 62,661,272)
Deaths ( 861,336)
Deaths per million ( 2,579)
China
Cases ( 103,776)
Deaths ( 4,636)
Deaths per million ( 3)
It’s hard for me to follow this blog post or the white paper, given all the technical terms, (e.g. ex poste) that I would need definitions for. This is unfortunate because I think the basic idea is understandable and interesting. I think the paradox is about failure of arbitrage theory: A bond in sterling ought to be equivalent to a bond in dollars, plus a futures contract for exchange. So, I get that much. But then get lost in the various terms.
Not clear to me how substantial the effect is. Like in the blog post;s 2% and 5% example, I guess the exchange rate future ought to be 3%. Is it 2.5%? 2.9%? 1%? Iow, how substantial are the differences from ideality? (There’s some graphs and stats, but I couldn’t parse them to get an intuitive feel for the scale of the mismatch. Need something more like the 2%, 5% discussion. How big of a miss are we trying to explain?)
I would think there are a lot of different explanations. If we assume perfect market efficiency (“arbitrage works”), could still have issues with the risk associated with the futures contract. Or even with the govt bonds (i.e they are not completely riskless, nothing is).
Market inefficiency is also a possibility, I guess. Not my first choice, but fine, need to consider it. (If you find a strong case for this, you ought to just not publish and run a hedge fund and use the insight to make money from the inefficiency.)
I guess other things to check might be the structure of the bonds (do you collect coupons along the way and then get principal back…or is it just a 2%, 5% per annum realization at the end? How does the futures arbitrage differ, if it’s a more complicated bond than just a one year delay and then getting the extra money?) Maybe tax implications might have an effect, especially if you collect interest along the way? Be interesting to get a bond trader’s take on the issues here. Maybe something we are missing.
Anonymous.,
Well, to cut to the bottom line, indeed the problem is that foreign exchange markets are not only very hard to forecast, but they have chronically behaved in ways that seem not to be consistent with market efficiency, which is the implication of this chronic forward market bias, which there are variouis ways to estimate it, with Menzie and his major professor, Jeffrey Frenkel, among those making innovations in how to do this, which is a major sub-theme of this paper.
Anyway, they get this result that it looks like maybe after the crisis of 2008-09, the market actually was sort of behaving efficiently, with this weird bias that seemed to be there forever, disappeating. But then it has reappeared again, starting in 2017. I am not getting into explaining all the technicalities, but does this help?
BTW, if you are worrying that this apparent inefficiency is going to call forth calls for all sorts of government intervention in these markets to somehow fix that, do not worry. This anomaly has been around for a long time, and nobody has rushed forth claiming they can fix it. All of those knowledgeable about this know that they have no idea what to do about it or have any possible policy interventions that could remotely fix it. Heck, the darned thing is basically a mystery, so nobody knows what to do about it, and nobody is rushing stupidly forward to claim they can do so.
Forward points are a big factor in FX trade. That is to say, FX traders expect to collect the difference in yield between different markets while being quick enough to unwind trades so that changes in FX rates don’t erase gains from yield differentials. Which is to say, FX trades rely on what Menzie (and Fama) is describing.
One could argue that FX Is a zero-sum market, with one loser for every winner, but commercial accounts are often the other side of the trade – giving up forward points as the cost of locking in FX translation costs.
《I think the paradox is about failure of arbitrage theory》
Right, and doesn’t that undermine all of rational pricing theory? Can prices be proven not arbitrary?
rsm: Actually, the message from the paper is not that arbitrage isn’t happening; it’s that expectations are not on average unbiased, so that actual expectations do not conform to the full-information rational expectations characterization. This has been a constant in my work with Jeffrey Frankel, dating back to my dissertation.
Ooops. Of course, Frankel, not Frenkel. Sorry about that bloop.
So, can prices be proven non-arbitrary? Or does the observed evidence favor arbitrariness?
So what’s the intuitive scale of this arbitrage issue? I like the 2%/5% example, so continue the thought experiment. If we had perfect arbitrage, the futures contract should give me 3%, right? So (on average, based on the typical mispricing), how big a deviation from 3% should I expect? 0.1%, giving 2.9% or 3.1%? 1%, giving 2% or 4%? I realize we are talking about statistics here, but what’s an average deviation? I just want some intuitive feel for how many basis points off, we are usually.
Oh, and is there any typical bias in the direction? I.e. if we “should” have 3% currency futures (for the 2%/5% bonds example), doest this effect to give me something lower than 3% or higher? Or just scattering equally to either side?
WTI over $81. Brent over $83. Term structure is backwardated, so should come down. But still prompt is much higher than it was a few weeks ago (in the 60s for a little while).
https://www.cmegroup.com/markets/energy/crude-oil/light-sweet-crude.html
EIA released new weekly retail survey yesterday. Same avg price as the AAA survey. $3.30. (That gasoline price drop mentioned few weeks ago did not endure.)
https://www.eia.gov/petroleum/gasdiesel/
Thanks for reminding me of Ralph Tryon’s paper. The font reminds me of the stone age tools were used to use in the 1970’s. Of course I was always impressed he used exchange rate data from the 1920’s.
On a different note – the fur has started flying with respect to Rand Paul’s attacks on Dr. Fauci. But we’ll save that dust up for another day.
https://twitter.com/l_e_whyte/status/1480977867144052744
Some enjoyable moments today. Although I wish he had found another version of vulgarity, this is one for the ages:
https://twitter.com/Mediaite/status/1480976894589906950
I guess if Roger Marshall’s constituency is Republican then he can tell lies geared for 5 year olds.
I knew Rand Paul pretends to be an eye doctor even though this quack never got a license. I did not know Marshall was an OB/GYN doctor.
Let’s see – he is against Medicaid expansion, wants Obamacare repealed, and would have Roe overturn. Now he voted for that 2017 tax deform but also supports more farm price subsidies. This clown is about as Trumpian as one can be. Hey future moms and dads – do not trust Roger Marshall to deliver your baby. GEESH!
Trumpian? Sounds Republican. Enough of the Trump stuff. Republicans are the financial globalists. Capitalism is hanging by a thread. The party is ovah!!!!
https://www.nytimes.com/2022/01/11/technology/income-inequality-technology.html
January 11, 2021
Economists Pin More Blame on Tech for Rising Inequality
Recent research underlines the central role that automation has played in widening disparities.
By Steve Lohr
Daron Acemoglu, an influential economist at the Massachusetts Institute of Technology, has been making the case against what he describes as “excessive automation.”
The economywide payoff of investing in machines and software has been stubbornly elusive. But he says the rising inequality resulting from those investments, and from the public policy that encourages them, is crystal clear.
Half or more of the increasing gap in wages among American workers over the last 40 years is attributable to the automation of tasks formerly done by human workers, especially men without college degrees, according to some of his recent research.
Globalization and the weakening of unions have played roles. “But the most important factor is automation,” Mr. Acemoglu said. And automation-fueled inequality is “not an act of God or nature,” he added. “It’s the result of choices corporations and we as a society have made about how to use technology.”
Mr. Acemoglu, a wide-ranging scholar whose research makes him one of most cited economists in academic journals, is hardly the only prominent economist arguing that computerized machines and software, with a hand from policymakers, have contributed significantly to the yawning gaps in incomes in the United States. Their numbers are growing, and their voices add to the chorus of criticism surrounding the Silicon Valley giants and the unchecked advance of technology.
Paul Romer, who won a Nobel in economic science for his work on technological innovation and economic growth, has expressed alarm at the runaway market power and influence of the big tech companies. “Economists taught: ‘It’s the market. There’s nothing we can do,’” he said in an interview last year. “That’s really just so wrong.”
Anton Korinek, an economist at the University of Virginia, and Joseph Stiglitz, a Nobel economist at Columbia University, have written a paper, “Steering Technological Progress,” which recommends steps from nudges for entrepreneurs to tax changes to pursue “labor-friendly innovations.”
Erik Brynjolfsson, an economist at Stanford, is a technology optimist in general. But in an essay to be published this spring in Daedalus, the journal of the American Academy of Arts and Sciences, he warns of “the Turing trap.” The phrase is a reference to the Turing test, named for Alan Turing, the English pioneer in artificial intelligence, in which the goal is for a computer program to engage in a dialogue so convincingly that it is indistinguishable from a human being.
For decades, Mr. Brynjolfsson said, the Turing test — matching human performance — has been the guiding metaphor for technologists, businesspeople and policymakers in thinking about A.I. That leads to A.I. systems that are designed to replace workers rather than enhance their performance. “I think that’s a mistake,” he said….
The Omnicron surge that hit NYC hard may have reached its peak:
https://www1.nyc.gov/site/doh/covid/covid-19-data.page#daily
Let’s hope so but get vaccinated and boosted if you are not already.
Wanna know why people like me prefer Bernie Sanders over Joe Biden?? Let me present you with Exhibit A:
https://www.theguardian.com/us-news/2022/jan/11/joe-biden-george-tsunis-greece-ambassador
These jobs are important, especially with both Russia and China gaining stealth control over important Greece sea ports. You don’t nominate a clown. This is Biden’s dumbest nomination since Neera Tanden at OMB and exhibits a pattern on Biden’s decision making. This is the same man who says he’s going to stand strong and defend Democracy?? Republicans will have a field day with this. It’s a Pelosi type decision where Biden is handing a nightstick over to Republicans to bludgeon him with. And even as a Democrat I hope they do, because after the Neera Tanden circus freak show, Biden has obviously learned zilcho.
“The US president nominated George Tsunis, a hotel developer and Democratic donor with no diplomatic experience, as US ambassador to Greece.”
Why is that everyone who goes into the hotel development sector turn out to be incompetent and yet corrupt clowns. Tsunis has a resume that sort of reminds me of the 45th President.
Moses,
I agree Tsunis is a bad pick. But we have no idea whom Bernie would have picked for anything, so you are a bit out there being so certain his choices would have been better than Biden’s.
WTI $81+
I thought you were going to pop the champagne bubbles when this hit $100. Oh well – Korbel is only $9 a bottle but it sucks almost as bad as your oil price forecasting.
I think “Princeton”Kopits is busy trying to figure out, how he can tell the FOX TV 4:00am News producers that he thinks Sesame Street is a version of Satanic worship and still keep things smooth with the in-laws:
https://www.nbcnews.com/news/asian-america/new-asian-american-muppet-prompts-cpac-president-call-defunding-pbs-rcna6076
I bet Schlapp thought Ji-Young is a North Korean spy. I have an idea – let Bert and Ernie grow Afros. Schlapp would pee in his pants!
Thanks, to both Menzie and his co-authors for explaining the variables/factors clearly. Not all papers make this effort. And when I’m trying to get a handle on this stuff it really helps. There are some parts which will take me much longer to understand, such as what Menzie mentioned above~~a sequential structural break test~~but at least if I can understand the variable symbols in the equation/regression I don’t have to feel completely lost in the woods on some of the conclusions and lessons of the paper. So that is appreciated.
What makes heralded and welcome and successful investment in the midst of an economic crisis, in the midst of a depression, “stealthy?”
http://www.xinhuanet.com/english/2019-11/12/c_138548572.htm
November 12, 2019
Xi, Greek PM visit Piraeus Port, hail BRI cooperation
ATHENS — Chinese President Xi Jinping and Greek Prime Minister Kyriakos Mitsotakis on Monday visited the Piraeus Port, a flagship project in bilateral collaboration, and hailed it as a success under the Belt and Road cooperation.
In 2009, a subsidiary of China Ocean Shipping Company, also known as COSCO, started managing the Piraeus Port’s container terminals. In 2016, COSCO acquired a majority stake in the port and formally took over its management and operation.
So far, the project has created jobs for over 10,000 local people directly and indirectly, and has built the Piraeus Port into the largest port in the Mediterranean region and one of the fastest growing container terminals in the world….
When Germany was conducting an attempt at crushing the Greek economy, there was Chinese investment in critical Piraeus Port:
http://www.nytimes.com/2015/02/16/opinion/paul-krugman-weimar-on-the-aegean.html
February 15, 2015
Weimar on the Aegean
By Paul Krugman
http://krugman.blogs.nytimes.com/2015/02/15/weimar-and-greece-continued/
February 15, 2015
Weimar and Greece, Continued
By Paul Krugman
https://www.nasdaq.com/articles/greece-paves-way-for-chinas-cosco-to-raise-piraeus-port-stake-2021-09-30
A different take on this issue. Some in Greece assert COSCO has not been as forthcoming in the development of this port as your account suggests.
EIA has their JAN STEO out:
https://www.eia.gov/outlooks/steo/
Versus last month, not much change on prices. Pretty high (versus last half decade) outlook for crude and natty.
US production is modeled to grow slowly. OCT actual ended up being 1..47, but 11.52 was predicted a month ago. DEC22 (find out in a couple months) prediction was reduced from 11.70 to 11.58. 2022 exit (DEC22) prediction ~same as last STEO: 12.20 down to 12.19. This is first month we get 2023 predictions. They have 2023 exit at 12.67.
Basically, they are expecting 0.6-0.5 MM bopd/year growth. Pretty slow given prices in the 70s. For context, we did 2 MM bopd/ye in 2018 (after 1 MM bopd in 2H17, so same rate of growth). And we did 1 MM bopd/yr in 2019. And that’s with worse prices. It’s just curious to me how low the activity is (see this in rig counts too, not just a production lag effect), given the high prices.
I had thought EIA might have a hard time modeling this, but so far the seem to be doing well. During the shale ramp (in 11-14, and then in 17-19), they routinely underestimated shale growth. Even cost adjusted. (They had a few misses in 15 and 16 high, but that was because of prices below their forecast, on a price adjusted basis, don’t think they were off high.)
I kind of thought now (given lower activity under Biden administration), they might need to retrain their model and would be off high for a while. But they’ve been pretty on target with the low estimates. For some reason, rigs are much slower to get added now than under Trump or Obama (crude price adjusted). I don’t think it’s just day rates or costs as an issue either…we’ve all heard the 6 figure CDL stories previously. And it’s not geology constrained (drilling productivity report and average well results show continued strength in new production per rig).
Macroduck: “Clarida is out.”
What, he resigns two weeks before his term is up? He misses one government paycheck when he should be in jail.
And Powell gives this criminal a sentimental send off? Powell: “I will miss his wise counsel and vital insights.”
The guy is a freaking criminal and Powell is sad to see him go.
I’ve been a backer of Powell for renomination to Fed chair based on his strong support for wage earners. But now I have to defer to Senator Warren who says “Your record gives me grave concerns. Over and over, you have acted to make our banking system less safe, and that makes you a dangerous man to head up the Fed, and it’s why I will oppose your renomination.”
Powell can’t even police his own board for corruption. How can anyone expect him to police Wall Street, which is one of his primary jobs?
@ joseph
Very well articulated. Couldn’t agree with you more Sir.
Doctors (MDs) rarely criticize each other. They could care less about “standard of care” when it comes to forwarding patients their golf buddies’ way. You see the same behavior in many “respected professions”. This is why Powell hasn’t a single bad word to say about Clarida. The good ol’ boys network isn’t going to have ethics and morals ruin their magic carpet ride. This is how you get guys defending other guys going to Hoover Institute to give a speech. Play around with the knot at the top of their tie and button their blazers up while straitening their posture~~they’re all about it. But speak out about low-class conduct by a colleague?? You’d sooner find a member of the FOMC volunteering to speak to students at a Dunbar High School assembly.
*straightening
https://www.theguardian.com/business/2021/sep/28/elizabeth-warren-fed-chair-jerome-powell-dangerous
September 28, 2021
Elizabeth Warren tells Fed chair he is ‘dangerous’ and opposes renomination
The Senator said Jerome Powell’s policies have weakened US banking regulations and could lead to another financial crisis
By Dominic Rushe – Guardian
@ joseph
And where do you think Clarida will land now after being caught using his job to enrich himself?? HINT: Somewhere in banking. “risk management”, or “insurance”. As long as Clarida talks about the “evils and overreach of regulations on banks” his plush office chair doing nothing is safe.
Of course Clarida may have to take a 6 month sabbatical because he was “shocked” and “worn down” by the “cynicism” towards those “working in public service” to their nation. [ Sniffle sniffle, Clarida reaches for his Neiman Marcus handkerchief to wipe the completely dry area under his eyes. ]
Good news for banking regulation. Clarida’s likely replacement is experienced and has a record of urging stiffer financial regulation.
Never heard of her……..
I hope she doesn’t urge too strongly for better enforcement of bank regulations. Powell’s chances for Vice President and Chief Legal Officer at Goldman Sachs hinges on it. Valentine’s Day is just a month away, maybe Powell can get her a grazing muzzle??
https://english.news.cn/20220112/3896fecacf6f430fbe7911f2e0197412/c.html
January 12, 2022
China’s inflation tame in 2021 amid stable economy
BEIJING — With a mild retreat last month, China’s inflation largely remained tame throughout 2021 against the backdrop of sustained economic recovery, while soaring prices emerged as a massive threat in many parts of the world.
China’s consumer price index (CPI), a main gauge of inflation, rose 1.5 percent year on year in December, down from the 2.3-percent increase a month ago, the National Bureau of Statistics (NBS) said Wednesday.
Inflation climbed 0.9 percent in 2021, well below the country’s annual target of approximately 3 percent.
In the face of COVID-19 outbreaks in multiple places, the authorities have also coordinated measures to rein in the pandemic and ensure goods supplies, which helped stabilize prices and maintain market stability, senior NBS statistician Dong Lijuan said.
Breaking down the December inflation data, food prices dropped 1.2 percent from a year ago, reversing the 1.6-percent rise in November. The price of pork, a staple meat in China, slumped 36.7 percent, 4 percentage points greater than a month ago. The prices of other farm produce from vegetables to fish and eggs registered smaller increases.
Non-food prices, including gasoline and diesel prices, rose 2.1 percent from a year earlier, easing from the 2.5 percent in November. The core CPI, which excludes food and energy prices, gained 1.2 percent year on year in December, unchanged from a month ago….
Eamon McKinney has a lot of interesting commentary on China, most of it not to print in the US, since it falls outside the standard narratives:
“ As it stands today, America has nothing that China needs that it can’t make or buy elsewhere. America conversely needs China desperately, without China’s goods the American economy grinds to a halt. The extent of that dependency has been highlighted by Americaэs ongoing supply chain chaos. Manufacturing, retail, construction and countless other industry sectors have stalled without Chinese goods. No country in the world is as dependent on imports as the U.S. Attempts to find alternatives to China are fruitless, no other country can match the efficiency, infrastructure, economies of scale and cost that China can. American manufacturing only accounts for 20% of the American economy, self-sufficiency for Americans is a fantasy, even in the best case scenario, it is generations away.”
https://www.strategic-culture.org/news/2022/01/08/china-shows-its-trump-card/
I thought ltr would be interested. Others will probably dismiss it as Chinese propaganda, preferring American propaganda instead.
I would encourage people to search on Eamon McKinney, who is an old China hand.
There used to be the anti-trade jihadish named JohnH who thought importing goods from China was a mortal sin. THAT JohnH even applauded Trump’s stupid trade war. Glad you are not THAT JohnH.
BTW – we buy apparel from other nations. So I guess our dependency comes down to Barbie Dolls and iPhone. Where are those goods designed again?
Some of his writing is unbelievably bewildering spin. Just a small snippet:
‘Some recent developments in China have given us a glimpse of the future. China is stockpiling food and other commodities at unprecedented levels. It is believed to hold more than half the world’s grain and maize already, other essential food stuffs are also being stockpiled at similar levels. Iron ore, steel and other industrial raw materials are also being hoarded in previously unforeseen quantities. In a world of chronic shortages China has realised that commodities hold more value than cash.’
That food they are stockpiling are imports from where else? Oh the US. OK – the iron ore is imported from Australia. I would have never imagined one could find more stupid bombast that JohnH writes but then this dude really takes the cake. Oh wait – the cake was baked in America too!
Funny! Thanks to US economic sanctions, Russia became the world’s #2 wheat exporter…but pgl thinks that China has to buy wheat from Uncle Sam!
https://www.worldatlas.com/articles/the-top-wheat-exporting-and-importing-countries-in-the-world.html
And here’s a real gem: “ That food they are stockpiling are imports from where else? Oh the US. OK – the iron ore is imported from Australia.” pgl thinks that the Chinese eat iron…just when I thought his comments couldn’t get any dumber!
Thank you so much for the reference. I am thinking through the essay.
About commodity storage, I have sought to explain that China has long set aside surplus production or imports of basic goods. China routinely uses stored-surpluses to moderate price increases. When there was a global infection that spread to China and caused a dramatic decline in pork production and pork prices began to rise, the Chinese quickly began to draw on stored pork. Stores are often or likely generally meant to last 2 or more years. Rising pork prices would be an important problem for dealers and consumers, and rebuilding pork production would take time, so the surplus was drawn on a number of times. About 2 years were needed to rebuild the pork market, but stores were sufficient and besides there were imports.
The point is that no matter imports, China accumulates and uses commodity stores when necessary for a distinctive preferred “monetary policy.” This is stressed yearly when plans are being drawn for the coming year. Look to the Chinese consumer price index for 2021, and notice how successfully the Chinese used commodity stores.
Yep.
China has built strategic reserves in oil, iron, copper, aluminum, zinc, grains… If JohnH or Eamon McKinney had bothered to do a quick internet search for National Food and Strategic Reserves Administration, the startling fact that China has reserves would not have left either of them breathless. Big drawdown last year in some commodities to stabilize domestic prices, rebuilding this year. It’s all in the business press. Not much of a secret. Big country, big reserves – not much of a surprise.
https://fred.stlouisfed.org/graph/?g=sVz7
January 15, 2020
Consumer Price Index and Consumer Price Index Less Food & Energy, 2020-2021
(Percent change)
https://fred.stlouisfed.org/graph/?g=FmWS
January 15, 2020
Consumer Price Index for Food and Energy, 2020-2021
(Percent change)
https://fred.stlouisfed.org/graph/?g=Fn2B
January 15, 2020
Consumer Price Index Rent and Owners’ Equivalent Rent, 2020-2021
(Percent change)
https://news.cgtn.com/news/2022-01-12/Chinese-mainland-records-221-confirmed-COVID-19-cases-16KPRB6xUQg/index.html
January 12, 2022
Chinese mainland reports 221 new COVID-19 cases
The Chinese mainland recorded 221 confirmed COVID-19 cases on Tuesday, with 166 linked to local transmissions and 55 from overseas, data from the National Health Commission showed on Wednesday.
A total of 32 new asymptomatic cases were also recorded, and 724 asymptomatic patients remain under medical observation.
Confirmed cases on the Chinese mainland now total 104,189, with the death toll remaining unchanged at 4,636 since January last year.
http://www.xinhuanet.com/english/20220112/baa3eb29c0834c1582979916ea87e346/c.html
January 12, 2022
Over 2.91 bln COVID-19 vaccine doses administered on Chinese mainland
BEIJING — More than 2.91 billion COVID-19 vaccine doses had been administered on the Chinese mainland as of Tuesday, data from the National Health Commission showed Wednesday.
https://www.worldometers.info/coronavirus/
January 11, 2022
Coronavirus
United States
Cases ( 63,390,876)
Deaths ( 863,896)
Deaths per million ( 2,587)
China
Cases ( 103,968)
Deaths ( 4,636)
Deaths per million ( 3)
BLS has the new monthly CPI numbers. “The all items index rose 7.0 percent for the 12 months ending December, the
largest 12-month increase since the period ending June 1982.”
https://www.bls.gov/news.release/cpi.nr0.htm
But but, the increase for the last month was less than 0.5%. Of course the increase from Nov, 2020 to Dec. 2020 was a mere 0.25%. We drop the latter and added the latter and this 12 month average rose slightly.
Kevin Drum debunks your wee bit of spinning:
https://jabberwocking.com/december-inflation-clocks-in-at-still-high-7-1/
It’s a direct quote from the government press release.
Interesting. For NOV CPI (reported in DEC), Drum only showed the trailing twelve month number. The annualized monthly number (like what he did in the post you linked) would have been been ~9%.
https://jabberwocking.com/inflation-remains-high-in-november/ [See how he only graphs the TTM number, doesn’t describe the annualized number at all.]
I think there’s a benefit to looking at each, sure. When you want to see turning points, you have to squint. But just be aware that the trailing twelve month gives you some self-averaging, for a bouncy monthly variable. Again, great to look at each. Just with caveats.
The TTM number is also useful when comparing to the earlier-in-the-year commentary on inflation not being a concern, just a sporadic bad month, etc. since it shows a longer effect, not just some bad month in the spring. Drum even admits he was off earlier with having low expectations for overall 2021 inflation.
Unless there is a reacceleration of inflation in coming months, the y/y inflation reading will come down pretty sharply in the April to July period. It’s already built into the math. The “largest 12-month increase since the period ending June 1982” is largely driven by what happened in April to July of last year.
There is a reasonable chance the Fed will begin hiking rates just as y/y inflation readings are about to cool. If so, then there is a good chance the press and casual observers will mostly misinterpret the connection between Fed policy action and inflation.
When Trump agreed to an NPR interview – did he think the interviewer would be Sean Hannity? No – it was Steve Inskeep and after 10 minutes of total BS from Trump with Inskeep actually doing his job, Trump decided to hang up. Check out this accounting of the low lights from Trump’s continuing BS:
https://www.msn.com/en-us/news/politics/the-20-most-outlandish-lines-from-donald-trumps-npr-interview/ar-AASI5RV
Direct from the horse’s mouth:
https://ondemand.npr.org/anon.npr-mp3/npr/me/2022/01/20220112_me_pressed_on_his_election_lies_former_president_trump_cuts_npr_interview_short.mp3
https://www.npr.org/2022/01/12/1072176709/transcript-full-npr-interview-former-president-donald-trump
Biden said on 4 January 2022, “There is a lot of reasons to be hopeful in 2020.”
T.Shaw: And Trump in 2017 cited Frederick Douglass as “an example of somebody who’s done an amazing job and is being recognized more and more.”
So, Biden’s well-deserved approval ratings are 35% among registered voters; 28% among Hispanics, and 25% among independents.
They should be lower.
Where did you get those numbers T. Shaw??? These survey numbers in this first link are from November of 2021:
https://www.ussc.edu.au/analysis/by-the-numbers-biden-and-trumps-approval-ratings-among-independent-voters
These other survey numbers were made public on January 11, yesterday:
https://www.clickondetroit.com/news/politics/2022/01/11/poll-michigan-gov-whitmers-job-approval-trends-up-as-2022-election-looms/?mkt_tok=NTU2LVlFRS05NjkAAAGB7jPcUwwH-t1AdVdLKT1EDWn1Lw3kyXdSr0wBCTXOxvXOdhLNtq-Sat8zZDGDV720lB5hZNaqwhMWyLjRUYmYWjS1uId5YWfk2uSopazTbP4Y
https://thehill.com/homenews/state-watch/589402-whitmer-leading-possible-gop-challengers-in-michigan-governor-race-poll
It’s interesting to note, donald trump spent an inordinate amount of time bad-mouthing this woman. Is it possible that your hero’s opinion of other politicians just doesn’t carry much weight anymore??
https://news.yahoo.com/mitch-mcconnell-defends-gop-senator-231310781.html
https://news.yahoo.com/mcconnell-backs-senator-rounds-2020-151301491.html
The thing that’s important to remember here T. Shaw is that your vote isn’t being counted, and YOU should stay home for the next national elections. So you tell ALL your REPUBLICAN friends to stay home, ok??
Weekly petroleum report is out.
https://www.eia.gov/petroleum/supply/weekly/
Crude had a draw. As did propane (was cold). Gasoline had a build. So did diesel. And so did heating oil (very similar to diesel chemically).
Menzie,
As I understand your editorial rules, it is now time to ban paddy kivlin:
https://ph.news.yahoo.com/video-repeats-false-claims-safety-030833727.html
Aside from repeating debunked claims about the effectiveness of Covid vaccines, the nonsense paddy links to also ignores public data not produced by Pfizer, data coolcted after the roll-out of the vaccine. Those data clearly show that the Pfizer vaccine saves lives.
macroduck: Yes, you are right. Any post by paddy kivlin spreading misinformation with respect to covid vaccines will be deleted. Any repetition of said offense will result in immediate and permanent banning.
There used to be the anti-trade ——– named…
[ Were this intended, this would be a scurrilous remark. I assume the remark was accidental. ]
This isn’t even a politics (make Biden look good/bad) question. I’m just trying to engage with your research, by having some intuition for the magnitude. Like if you told me that shining a light on a metal would raise voltage, I’d want to know if it’s .1V or .01V or 1V or 1000V. [Totally making this up, I don’t know of this sort of material property….but just explaining how I get my arms wrapped around it.] It’s kind of a different question from is the effect real, statistically valid, etc. It’s just like if you told me about a new mammal found in South America and I wanted to know if it was bigger or smaller than a housecat (so I have some feel for what it even is).
I appreciate that you have all kinds of stats and correlations and plots and the like. But given you’ve done that hard work, can’t you then translate it for me? For the 2%US and 5% UK bonds, how large of a deviation from 3% exchange future do you expect? Sure, it will vary (and does in your data set). But is the average expectation a deviation of 1000 basis points? 100? What?