Two ways of calculating how prices have moved pre-pandemic and during pandemic, incorporating the ideas of stochastic vs. deterministic trends (e.g., this post, Stock and Watson, JEP, 1988).
In short, look at either the inflation differential (which I thought was natural) or the trend in the log relative price (following up on this post).
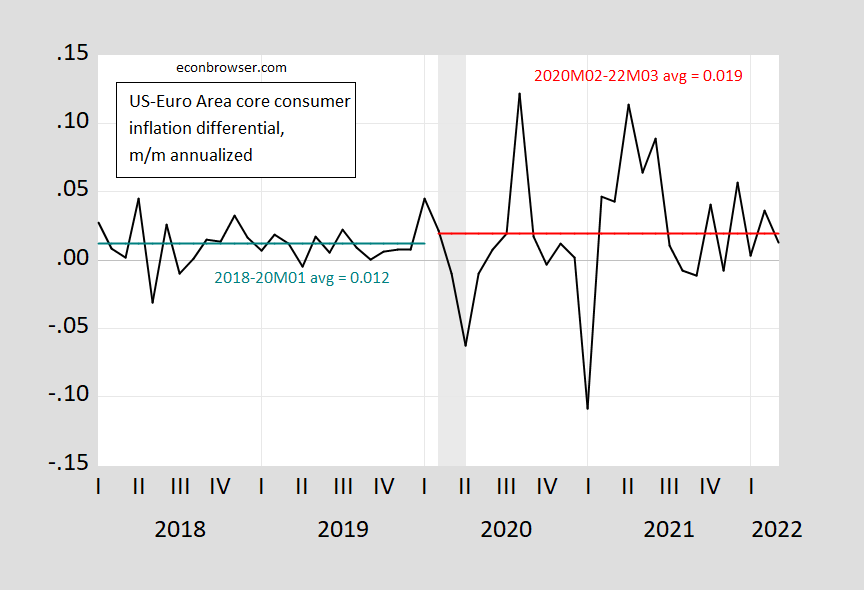
Figure 1: Month-on-month core inflation differential between the US and Euro Area (black), calculated using log first differences. Teal line is (annualized) mean differential 2018-2020M1; red line is (annualized) mean differential 2020M02-2022M03. Euro Area core HICP seasonally adjusted by author using geometric Census X-12. NBER defined peak-to-trough recession dates shaded gray. Source: BLS, Eurostat via FRED, NBER, and author’s calculations.
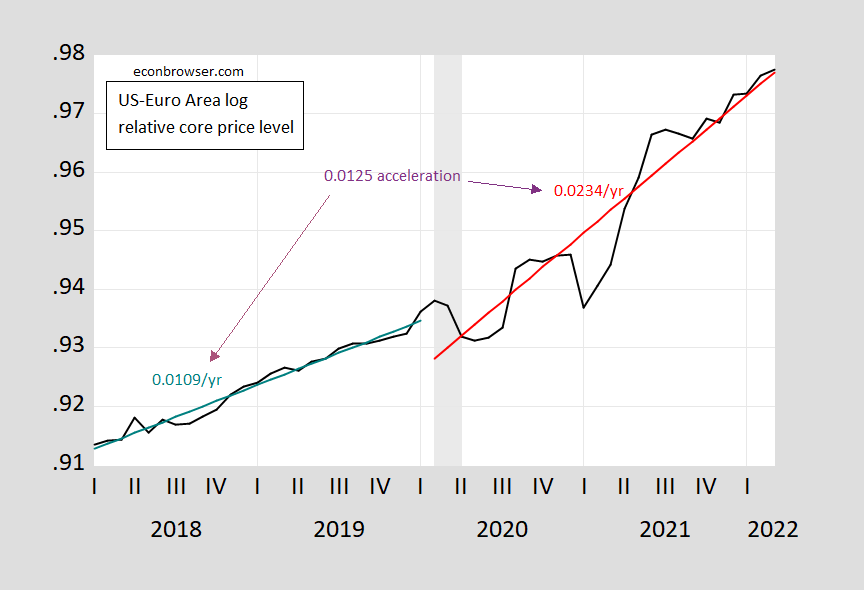
Figure 2: Log ratio of US core CPI, s.a. to Euro Area HICP core seasonally adjusted (black). Fitted value using estimated equation (teal, red). Teal line is (annualized) trend differential 2018-2020M1; red line is (annualized) trend differential 2020M02-2022M03. Euro Area core HICP seasonally adjusted by author using geometric Census X-12. NBER defined peak-to-trough recession dates shaded gray. Source: BLS, Eurostat via FRED, NBER, and author’s calculations.
Using the (annualized) inflation differentials approach, inflation accelerates 0.7 ppts, but the coefficient is not precisely estimated (mechanically, because of the high variance of inflation differentials during the pandemic). Using the trend growth in the log ratio, the acceleration in price level growth is 1.25 ppts, and is statistically significant, even using Newey-West standard errors (t-stat 6.64).
What’s the “right” approach? The first fits better into a regression based diffs-in-diffs approach (I look at how inflation differentials change pre- vs. post-). The second is how one would typically figure out how trends changed if one weren’t particularly worried about stochastic trends (which you might not be over such a short sample).
In any case the regression of inflation differentials on a constant and pandemic dummy has an R2 of 0.01, DW = 1.73. The regression of log ratio on constant, time trend, pandemic dummy, and pandemic dummy interacted with time trend has an R2 of 0.96, DW = 0.71. These regression results have the hallmarks of spurious correlation, i.e., R2 > DW, so I’d be reluctant to over-interpret the finding of statistical significance using the conventional estimates of standard errors, means.
Inflation differential reject the ADF and Elliot-Rothenberg-Stock DF-GLS null hypotheses of unit roots, but fail to reject the KPSS trend stationary null hypothesis; the log relative core price fails to reject the ADF and DF-GLS null, but rejects the KPSS trend stationary null.
One can validate the trend approach by testing whether the unit root null is rejected allowing for a structural break test. I implement the Perron (1989) unit root/break test with innovation outliers (allowing for constant and trend). In this case, the procedure rejects a unit root in favor of trend stationarity with break at 2021M03. Re-estimating the relative prices regression equation allowing a break at 2021M03 yields an implied acceleration of relative trend of 1.6 ppts.
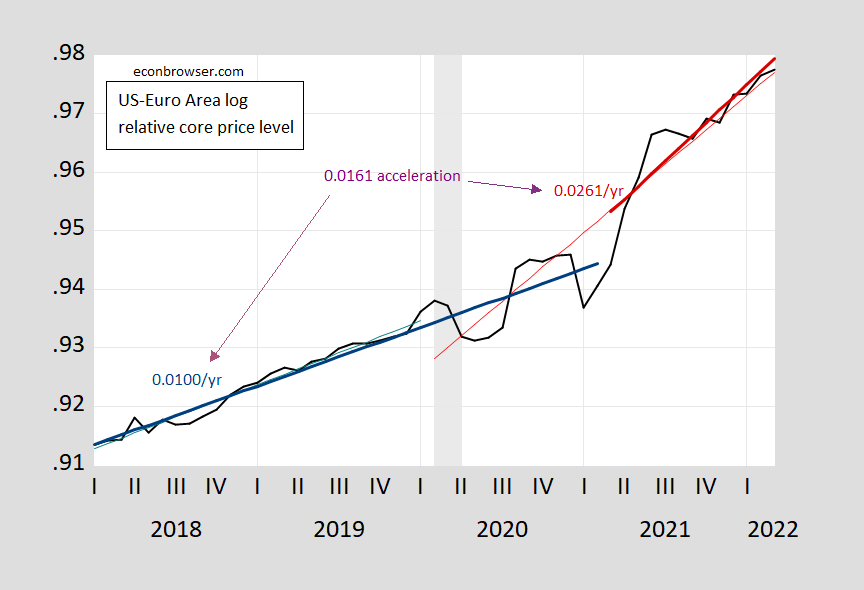
Figure 3: Log ratio of US core CPI, s.a. to Euro Area HICP core seasonally adjusted (black). Fitted value using estimated equation (blue, dark red). Blue line is (annualized) trend differential 2018-2021M2; dark red line is (annualized) trend differential 2021M03-2022M03. Euro Area core HICP seasonally adjusted by author using geometric Census X-12. NBER defined peak-to-trough recession dates shaded gray. Source: BLS, Eurostat via FRED, NBER, and author’s calculations.
If the fact that the results differ so much depending on sample, breaks, and methods, welcome to the world of data. If it’s any consolation, if one used m/m inflation differentials, and used the 2021M03 dummy, one would find borderline significance for an acceleration in inflation (9% msl).
Marjorie Taylor Greene’s bad amnesia inspired this ad for Treasonal, a med that “patches up holes in the brain”
https://boingboing.net/2022/04/26/marjorie-taylor-greenes-bad-amnesia-inspired-this-ad-for-treasonal-a-med-that-patches-up-holes-in-the-brain.html
Yes Jimmy Fallon had enough of Greene’s lying and I do not recall testimony so he has a drug designed just for her memory lapses!
I am not a big believer in the power of central bank messaging. That said, the inflation differentials represented in figure 1 correspond roughly to the difference between a 2% inflation target and a just-below-2% inflation target. Those different policy targets don’t seem a very good explanation for the difference in trend represented in figures 2 and 3.
A quicker recovery in growth after the Covid recession, the result of aggressive fiscal expansion? Jason Furman’s “cars” explanation? Structural differences due to which not only inflation trends are different, but rates of acceleration are different (including “cars”)?
“If the fact that the results differ so much depending on sample, breaks, and methods, welcome to the world of data.”
Macro people get a lot of flak for lack of identification and heroic assumptions and such, but sometimes I think you’re just being more honest.
Recession Watch:
Ocean freight rates have fallen sharply from the peak in October, but remain elevated:
https://tradingeconomics.com/commodity/baltic
Domestic trucking rates fell of in January, but had recovered as of March:
https://fred.stlouisfed.org/graph/?g=OzLH
In April, though, there are reports of a sharp decline in trucking rates and overall demand:
https://www.freightwaves.com/news/bank-of-america-is-sounding-the-alarm-on-collapsing-freight-demand
The link mentions recessionary rates for truck freight. It’s early to read much into that, but the last domestic freight “recession”, in 2018, did not lead to a full-economy recession, but trucking contractions lead economic contractions in 50% of cases:
https://convoy.com/blog/freight-industry-recessions-and-the-business-cycle/
Haha, interesting. Never get tired of the trucking data points. [ In my best Colonel Kilgore voice ]: “I love the smell of truckstop bathrooms in the morning. They smell like…….. rancid urine.”
I have just heard from a local retailer of a basically sudden collapse of consumers in his store coinciding with a suddenly full inventory. Just one datum, of course.
To be more specfic about my datum, this is a furnture store owner. The “inventory” comment has to do with supply chain problems, which seem to be noticeablyi declining for him. So he was having to wait a long time to get certain items and simply did not have them available for customers at all. But now many of them are available and he has them on his shelves and the store floor, higher inventory. But, hah, the customers have suddenly, like in the last week or so, stopped coming, who were coming in a pretty steady stream for nearly two years since the initial turnaround after the first wave of the pandemic shut much of the economy down. Still just a datum though.
son and dau in law did kitchen b4 holidays…..
new dining room table last to arrive!
If housing is slowing down then I assume that bites into furniture sales as well. What I was reading lately certainly implied housing is slowing down. Rising rates etc.
I should specify, the number of units for sale, say compared to two—three years ago.
Is housing slowing yet? Yea I get that Princeton Steve has been saying this for months but I do not consider a reliable source for real world information.
The number of units being sold has lowered, yes prices are still rising. If the supply is lowering, or the increase in supply is decelerating, does an increase in prices mean the housing market is hot?? I’m movable on this topic, but that’s a hard sell for me/
I’d love to read Menzie’s thoughts on how those two factors interact with each other in the 2022 context, or someone Menzie trusts as a guest post to address it. Personally I think it’s a weak argument to say housing is hot, when unit sales have dropped year-to-year.
https://tradingeconomics.com/united-states/existing-home-sales
Bill McBride writes that because so many of the house purchases that are driving the boom are made in cash (which was surprising for me), and since housing is an important channel for Fed policy, the Fed may have to be extra aggressive to bring down inflation. You know what that means.
Then again, Janet Yellen says core inflation may have peaked. I hope that’s true, and that it means a soft landing is still possible.
Both the Cass Freight (trucking) and the Baltic (shipping) rates were very high before the Great Recession. But these rates fell appreciably during the Great Recession and did not really recover until the last couple of years.
fwiw,
container ships are queuing off china coast, many off shanghai.
china truck volume moving empty and full containers in shanghai vicinity light.
future supply crimp??
I just wrestled with two different Wal Mart shopping carts (you know, near the entrance) couldn’t get either of the two carts out, then literally gave up (I was just picking up 4 packages of wound gauze for a friend, and could juggle them up to the counter). Now, my question to you people here on the blog is, when I’m not smart enough to separate Wal Mart shopping carts at the entrance to the store, should I take this personally??
no!
thanks for that. I felt kinda stupid/awkward, but all I can say is I shop at about 3 other supermarkets and I don’t remember feeling like I was in a Friday night WWE match just to get a shopping cart disconnected from the other carts. I don’t know what I would have done if I had a long shopping list. Probably sheepishly ask some Wal Mart associate girl who weighed 115 pounds to help me and she would have disconnected them on the first try.
I’m of the opinion that all shopping carts are out to get me.
If you’ve ever found yourself cursing at inanimate objects (especially in a public setting) you might argue it’s not implausible. That’s what I’ve been told anyway, because I would never curse at an inanimate object (is the last part of what I’m saying convincing??).
some folks on this blog were critical of me when I raised this issue last year. but I will do so again. if you buy an I-bond (savings bond) from us treasury today, you will lock in over an 8% average interest rate for the next year. yes, an individual can only invest $10k per year. but a couple can invest $20k per year. we are now in the second calendar year. we now have $40k earning over 8% for the upcoming year. risk free. can I retire on it? no. but it covers any increased costs in inflation I will deal with over the upcoming year. and all it took was about 5 minutes of online transfer activity. once you max out the savings bonds, you will find even short term treasuries become attractive after the next fed rate hike. banks are going to be under pressure to raise interest rate payouts, or will begin to lose cash in accounts. looks like the market might still be under pressure over the next few weeks. its been a long time since I have spent any serious time looking at bond options.