Today we are fortunate to be able to present a guest contribution written by Rashad Ahmed (Office of the Comptroller of the Currency, US Treasury). The views presented are solely those of the author, and do not necessarily represent the views of the US Treasury, or any other organizations the author is affiliated with.
Is a flatter U.S. yield curve foreshadowing a recession? The predictive nature of the slope of the U.S. yield curve, also referred to as the term spread, is well documented by both academics and practitioners. It is less clear, however, whether non-U.S. yield curves help predict U.S. economic activity. In Ahmed (2022), I examine this issue and demonstrate that foreign yield curves do in fact contain information about future U.S. recessions – above and beyond the information contained in the U.S. yield curve. Like the U.S. term spread, U.S. recession risk significantly rises and real GDP growth slows as foreign term spreads narrow. This means that not all U.S. yield curve inversions are alike: a flatter U.S. yield curve coinciding with flatter yield curves abroad indicates greater recession risk than a flatter U.S. yield curve in isolation.
Why might foreign yield curves predict U.S. economic activity? In their respective countries, foreign yield curves might lead economic conditions that are eventually ‘exported’ to the U.S. via cross-border spillovers. Foreign yield curves might also reflect global financial cycles, acting as a common factor shaping economic conditions across many countries including the United States. The evidence supports both views.
Constructing Term Spreads
Using quarterly data from 1979-2021, a foreign term spread (FTS) constructed as the average 10-year minus 3-month term spread over G-7 constituents Canada, Germany, Japan, and the U.K., is included alongside the U.S. term spread (USTS) in regressions of future U.S. recession risk and U.S. real GDP growth. Figure 1 left-panel shows both the USTS and FTS. The two series are positively correlated (0.55, t-stat of 8.54), consistent with a common factor driving interest rates globally.
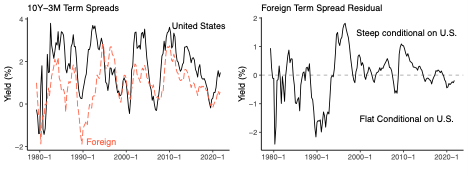
Figure 1: U.S. and Foreign 10-year-3-month Term Spreads
While both the USTS and FTS can directly enter in regressions of future U.S. economic activity to assess their informativeness as leading indicators, the significant correlation between the two variables make it challenging to disentangle the contribution of each. I take a conservative approach by allocating any information about future U.S. economic conditions shared between the USTS and FTS to the USTS, by formally testing whether innovations in the FTS that are uncorrelated with the USTS contain incremental predictive value. This requires recovering the FTS residual which is uncorrelated with the USTS, estimated as the residual from a regression of the FTS on the USTS. Figure 1 right-panel plots the recovered FTS residual. FTS residual values above zero can be interpreted as a foreign term spread that is steep relative to the U.S. term spread by historical standards, while values below zero indicate relative flatness. Note that using the FTS residual instead of the FTS directly in the analysis does not alter the joint predictive power of the FTS and USTS, but it does serve as a convenient yet conservative tool to quantify the unique contribution of the FTS. Having the FTS enter directly is also considered.
The Regression Models
A standard probit model is estimated to test whether the FTS and other indicators can predict whether a recession occurs any time within the following 12 months. Indicators considered include the FTS and those previously shown to lead recessions: the USTS, Federal Funds Rate (FFR), S&P 500 stock returns, S&P 500 volatility, Brent crude oil price changes, and national financial conditions.
Table 1 reports estimates from alternative probit regression specifications. The significant negative coefficient on the USTS implies that a steeper (flatter) U.S. yield curve is associated with lower (higher) recession risk. The FTS residual and both equal and GDP-weighted FTS are also found to be statistically significant predictors of U.S. recessions and their inclusion increases the McFadden R-squared from 8% to about 15%. Like the U.S. yield curve, the negative coefficient on the FTS or FTS residual implies that U.S. recession risk rises as foreign yield curves flatten.
Table 1: Probit Regressions of NBER Recessions
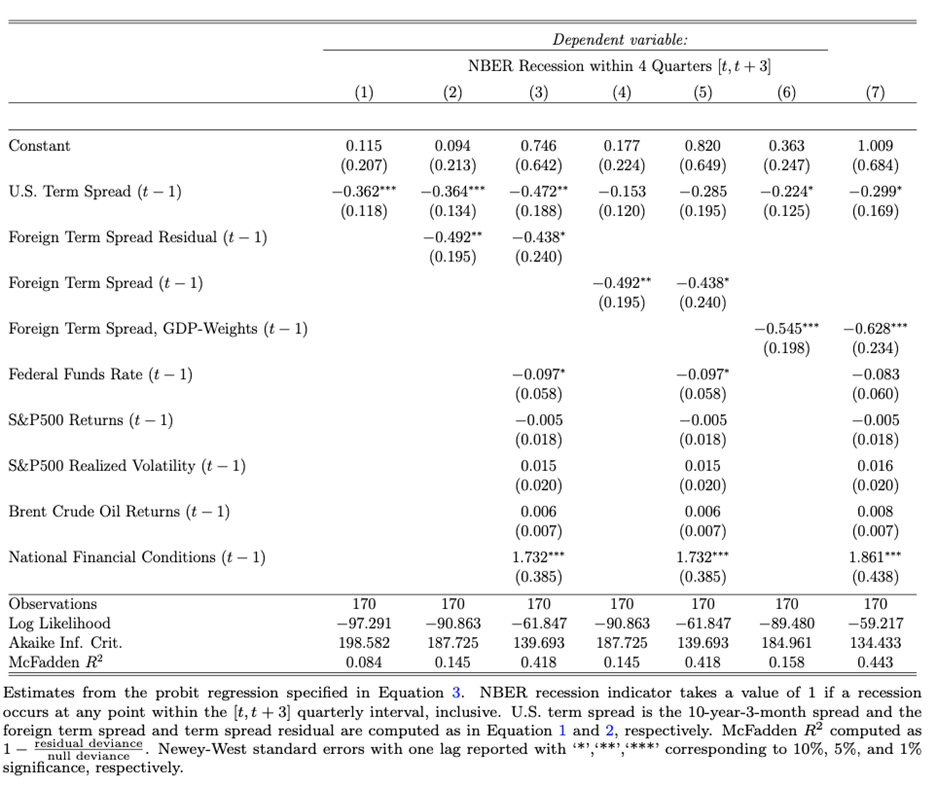
Columns 4-7 of Table 1 show that when the FTS enters directly, the coefficient on the USTS falls substantially. This result suggests that U.S. and foreign yields are partially governed by underlying common factors like the global financial cycle. However, the foreign term spread remains a significant predictor of U.S. recession risk after controlling for the U.S. term spread and additional proxies for the global financial cycle such as stock market volatility, U.S. financial conditions, and the FFR. Moreover, the coefficient on the GDP-weighted FTS that assigns heavier weights to particular regions (e.g., Europe) is larger than the coefficient on the equal-weighted FTS. Both results suggest that common factors cannot alone account for the predictive nature of foreign yield curves. The predictive power of foreign yields, therefore, seemingly arises from both common factors and cross-border spillovers.
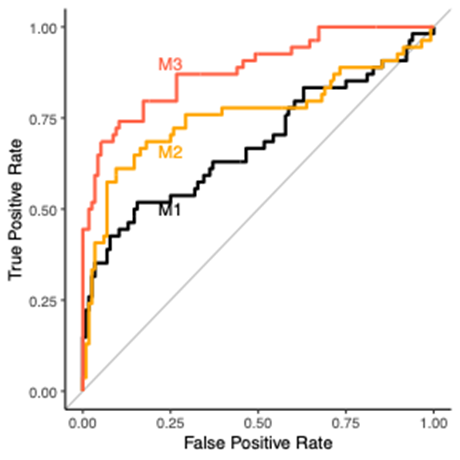
Figure 2: ROC Curves
Model Performance
To compare model performance, Figure 2 presents receiving operating characteristic (ROC) curves of the first three models in Table 1: the univariate USTS model (M1), the model with the USTS and FTS residual (M2), and the model with the USTS, FTS residual, and additional indicators (M3). Compared to M1, M2 has meaningfully higher true positive rates when false positive rates are 15-50% and lower false positive rates when true positive rates are 40-75%. M3 dominates both M1 and M2, unsurprisingly.
Separately from recession prediction, it is shown that foreign yield curves are useful for predicting U.S. real GDP growth up to three years ahead. The larger points in Figure 3 refer to point estimates over 1979-2019 (pre-COVID) and the smaller points refer to estimates over 1979-2021. The left-panel shows that a U.S. term spread which widens by 1 percentage point is associated with 0.77% faster real GDP growth over a 4-quarter horizon and a 2.22% faster growth over 12 quarters.
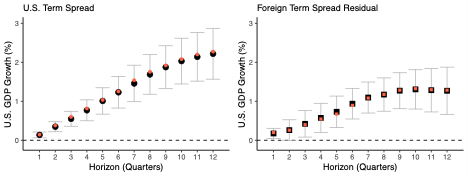
Figure 3: Local Projection Estimates of the U.S. Term Spread and Foreign Term Spread Residual on U.S. Real GDP Growth
The right-panel shows that a 1 percentage point widening of the FTS residual is associated with 0.57% faster growth in the U.S. over a 4-quarter horizon and 1.27% faster growth over a 12-quarter horizon. The vertical error bars represent 95% confidence bands, indicating that the relationships between these term spreads and future real GDP growth in the U.S. are statistically significant.
Recession Forecast using Data as of May 18th, 2022
To conclude, I use the latest available data on the indicators and Model 5 from Table 1 to produce a real-time forecast for a U.S. recession within the next 12 months. The model implies a 60% recession probability over the next 12 months (essentially Q3 2022 – Q2 2023). It’s worth noting that recession risk may be much higher than 60%. A threshold of 60% used to classify recessions results in a false positive rate of 3.4% over the in-sample period of 1979-2021. In other words, modeled recession probabilities at least this high rarely produced false alarms over the last 4 decades.
Furthermore, yield curves are not driving recession risk right now in 2022. In the model, the recent stock market drop, increase in stock market volatility, and sharp rise in oil prices together account for one-third of the 60% recession probability. The most important factor contributing to current recession risk is the oil price shock, which alone raises the recession probability by 12.6 percentage points.
References
- Ahmed, Rashad. “Do Foreign Yield Curves Predict US Recessions?.” Available at SSRN 4097006 (2022).
This post written by Rashad Ahmed.
The irony of it all. We all know that MAGA hat wearing domestic terrorists are a threat to our nation. We all know that there is a disinformation campaign to stroke this hatred with the prime example being the nightly racists on Faux News who inspired the East Buffalo murderer – even though Tucker Carlson is now saying “it wasn’t me”. Now I never heard of Nina Jankowicz until uberMAGA HAt liar Bruce Hall started his own disinformation campaign.
https://www.msn.com/en-us/news/us/nina-jankowicz-complains-disinfo-board-undone-by-disinformation-childish-attacks/ar-AAXwkU2?ocid=msedgdhp&pc=U531&cvid=92d2e50dcc834961b9fb5ab541709910
Her cable news appearance followed a Wednesday Washington Post piece which announced that the Governance Board, a Department of Homeland Security project, would be pausing its operations. The article blamed the “right-wing internet apparatus” and its “coordinated online attacks” for compelling the board’s decisions. Jankowicz appeared on CNN Tonight with host Laura Coates to vent about the end of her short-lived government appointment. She summed up her situation by telling Coates, “Unfortunately and ironically, we were undone exactly by a disinformation campaign coming from folks who apparently want to put our national security behind their own personal political ambitions.”
Bruce Hall – doing all he can on a daily basis to undermine our national security and promote racist terrorists. Then again he did all he could to make sure COVID-19 killed as many people as possible. Make America White Again!
https://www.msn.com/en-us/news/world/russia-official-has-rare-excuse-for-war-failure-ukraine-s-elite-military/ar-AAXwvYt?ocid=msedgntp&cvid=56e5b6432b5642a28909568ebbc96c54
An aha moment within the Russian government – Putin’s aggression is not going so well because the Russian army sucks while Ukrainians forces have a clue what they are doing. If Putin had a soul, he would cut his losses and get out.
Matt Schlapp has his own solution to Replacement – make white women have more babies by denying them their reproductive freedom:
https://www.msn.com/en-us/news/us/cpac-leader-offers-white-nationalists-a-solution-to-great-replacement-abortion-ban/ar-AAXwlNv?ocid=msedgntp&cvid=f4240b06e8734ebb8ccc17529942909b
During the Conservative Political Action Conference on Thursday, which was being held Hungary (aka the epicenter of backsliding democracy), Schlapp told reporters that the solution lies in Supreme Court’s expected overturning of Roe v Wade …. Schlapp’s comments came after Hungarian Prime Minister Viktor Orban, who’s been pushing his country into a distinctly authoritarian state, declared during his appearance at CPAC that European countries were “committing suicide” by allowing immigration.
Wait, wait – why is CPAC in Hungary. Oh – they admire Orban and his destruction of Hungary’s democracy. And they admire his blatant racism. Got it.
Do you know who else admires Orban? Princeton Steve of course.
From my skimming looks like a terrific paper. We are lucky Menzie and Prof Hamilton can attract such perceptive guests like Mr. Ahmed to post here.
In other news ruble at a 5 year high, more upward pressure expected. Congratulations Germany for providing Putin with enough temporary economic cover to continue an aggressive war farther into Europe. I’m sure Putin appreciates Germany’s, Italy’s and others’ sponsorship in the mass murder of thousands of Europeans. Way to make up for your World War 2 crimes. Outstanding. Call the relatives near the Rhine and tell them the more Russian gas they consume they might create more unnecessary savage slaughter. Make Hitler’s ghost proud.
And the bond liquidity picture.
https://www.marketwatch.com/story/junk-bonds-are-showing-signs-of-liquidity-strains-as-the-s-p-500-heads-into-bear-market-territory-11653074260?mod=mw_latestnews
Guess who’s next after junk bonds get attacked??
The ruble is nothing more than a speculative fiction. Not based on reality.
Your bond liquidity stuff is irrelevant as well. The real amount of bonds to other credit markets is lower than 40 years ago. Please Herzog, education is the key. Your a old warhorse out of touch where modern economies work.
You compliment me by calling me an “old war horse”. I always viewed myself more the middle aged “small fry”.
I give the following two links for anyone curious about this topic:
https://www.sifma.org/resources/research/fixed-income-chart/
https://www.cnbc.com/2022/02/08/consumer-debt-totals-15point6-trillion-after-a-record-breaking-increase-in-2021.html
I’m going to dissent. The paper purports to be about the predictive power of foreign term spreads, but concludes, “yield curves are not driving recession risk right now in 2022. In the model, the recent stock market drop, increase in stock market volatility, and sharp rise in oil prices together account for one-third of the 60% recession probability.”
In other words, the yield curve by itself is not forecasting a recession. Instead, several short leading indicators – stock prices, oil prices, and financial conditions – are.
So, the conclusion is based on other factors than those highlighted by the paper.
And the paper only examines the last 40 years, I.e., n=5 – not even the entire record of recessions with inverted yield curves, which go back 60 years.
Meanwhile, the tried and true long leading indicators (corporate profits, corporate bond yields, real M2, housing, in addition to the yield curve), which have a *much* longer record, have only just turned slightly negative, suggesting a heightened chance of a recession not this year, but beginning Q2 of next year.
New Deal Democrat: The paper’s title is “Do Foreign Yield Curves Help Predict U.S. Recessions?”, not do the current yield curves predict a recession in 2023. The answer to the question posed in the title is “yes”, based on pseudo-R2’s and receiver operating characteristics (ROCs).
Menzie, you recently asked me where I get some of my sites? I should do the same here. Tracing this paper it is listed on SSRN? SSRN Social Science Research Network, is a repository for preprints devoted to the rapid dissemination of scholarly research, blah, blah.
BTW, for you and the other Eco-warriors chasing the renewables unicorn, I found this link also listed on SSRN: “Full Cost of Electricity ‘FCOE’ and Energy Returns ‘eROI’
Accepted manuscript for publication at Journal of Management and Sustainability Vol. 12, No. 1, June 2022 issue at Canadian Center of Science and Education https://www.ccsenet.org/home/index.php/about” https://papers.ssrn.com/sol3/papers.cfm?abstract_id=4000800
It recommends: “Therefore, the authors suggest energy policy makers to refocus on the three objectives, energy security, energy affordability, and environmental protection. This translates into two paths for the future of energy,
(1) invest in education and base research to pave the path towards a New Energy Revolution where energy systems can sustainably wean off fossil fuels.
(2) In parallel, energy policy must support investment in conventional energy systems to improve their efficiencies and reduce the environmental burden of generating the energy required for our lives….”
The paper contains nothing controversial unless you are a renewables-warrior, but confirms what I have been saying: ” We introduce and describe the methodology for determining the full cost of electricity (FCOE) or the full cost to society. FCOE explains why wind and solar are not cheaper than conventional fuels and in fact become more expensive the higher their penetration in the energy system. The IEA confirms “…the system value of variable renewables such as wind and solar decreases as their share in the power supply increases”. This is illustrated by the high cost of the “green” energy transition.”
Just follow the science.
SSRN, like other preprint services, circulates publications throughout the scholarly community at an early stage, permitting the author to incorporate comments into the final version of the paper before its publication in a journal.
Let me translate this for CoRev – these are draft papers which have not been subjected to peer review. Does that matter? You bet it does even if CoRev would tell us otherwise.
OK – I will grant this:
Journal of Management and Sustainability (JMS) is an international, double-blind peer-reviewed, open-access journal for academics and practitioners of sustainable management. Published by the Canadian Center of Science and Education, JMS aims to provide an avenue for high-quality research in the fields of environmental sustainability, corporate social responsibility, economic sustainability and any disciplines concerning the interaction between management and enterprise sustainable development.
I have read the abstract so far as their metrics strike me as both interesting and also supportive of using solar/wind as part of the process of providing energy. They – unlike you – recognize the negative externalities of using fossil fuels. In other words, their metrics do not support your hyperbolic aversion to the use of solar and wind. But nice try CoRev.
https://eastfuelconf.com/lars-schernikau/
The bio of the lead author shows he has worked for commodity multinationals and consulting groups. Not necessarily saying his work is biased but we should all be honest here about our sources:
Dr. Lars Schernikau
Shareholder
HMS Bergbau AG, Germany/Singapore
Dr. Lars Schernikau joined the commodity business in 2003 and before worked at The Boston Consulting Group in New York, USA and Munich, Germany from 1997-2003. As a co-founder, shareholder and former member of the supervisory board in the German-based, publicly listed, international commodity marketing and mining companies HMS Bergbau AG and IchorCoal NV, Lars has founded, worked for, and advised a number of companies in the global raw material sector in Europe, Asia, Africa, and North America.
Currently, Lars focuses on further developing the companies’ global operations as well as marketing of energy and other commodities in Asia, Africa, the Americas, Europe and the Indian subcontinent. HMS has been marketing US coal and petcoke products for over a decade.
I see Menzie has CoRev broadening his horizons in reading materials. Just when Menzie was starting to wonder…….
“why do I bother with these people?” <<—my imaginations of Menzie's thoughts, nothing he actually ever said.
Bierka’s Pavlovian response is wrong again: “Let me translate this for CoRev – these are draft papers which have not been subjected to peer review. Does that matter? You bet it does even if CoRev would tell us otherwise.
I even highlighted the Journal acceptance: “Accepted manuscript for publication at Journal of Management and Sustainability Vol. 12, No. 1, June 2022…” But a slavering Bierka couldn’t resist his basest instincts.
Bierka, for once, read beyond the abstract and you will find much to support my contention that the big lie is that renewables are not accurately priced. Which has been my position.
CoRev: Who is “Bierka”?
@ Menzie
I suspect……
https://www.smithsonianmag.com/smart-news/what-kind-of-dog-was-pavlovs-dog-22159544/
Menzie asks who is Bierka. Just one of Pavlov’s trained dogs.
“you will find much to support my contention that the big lie is that renewables are not accurately priced.”
And the price of fossil fuels is accurately priced? Negative externalities? HELLO????
Bierka, unthinkingly comments: “Negative externalities? HELLO????”
No one has yet addressed these facts: “Unexpected and expected drops-offs are routine to wind and solar, that is why they need gas back-up. Wind and solar need gas, gas does not need wind and solar. In the real world why is it that nearly every article about natural gas failing winds up revealing a wind failure?”
And he wants to talk about pricing externalities of fossil fueled generation of electricity. There is plain ignorance, willful ignorance and then Bierka’s (and other renewables-warrior) ignorance. Renewables need back up and gas is the primary fuel used today!
Y’all want to drive the world down that “Negative externalities? HELLO????” hole. Adding renewables to the grid ALWAYS raise the costs.
“CoRev
May 22, 2022 at 5:20 am
Bierka, unthinkingly comments: “Negative externalities? HELLO????”
No one has yet addressed these facts”
I have suggested earlier that CoRev has gone insane. His reply here proves my suggestion. My simple point was that the private marginal cost of providing fossil fuel based energy grossly understates its true marginal costs. Your reply said NOTHING about my simple point. No CoRev is the insane dog gone crazy barking all night while chasing its own tail.
Bierka, negative externalities is a nebulous term unless defined. List those externalities (positive and negative) from the paper then add definitions for those you think were missed. To make it simple just do the FCOE list. If you’ve even read the paper you should find that EZ.
If that’s too hard then just answer the question: “Unexpected and expected drops-offs are routine to wind and solar, that is why they need gas back-up. Wind and solar need gas, gas does not need wind and solar. In the real world why is it that nearly every article about natural gas failing winds up revealing a wind failure?”
Respectfully, the conclusion of the paper is exactly what it says in the paragraph that begins “To conclude …”
New Deal Democrats: The entire quote is: “To conclude, I use the latest available data on the indicators and Model 5 from Table 1 to produce a real-time forecast for a U.S. recession within the next 12 months.” Model 5 includes other leading indicators as well as price of oil. Rough math indicates a specification including only the two term spreads yields a 43.4% probability. Whether that’s above the threshold is up to you…
Clarence Thomas frets over the future of our institutions after that leak of the Alito draft opinion. He needs to more concerned about the actions of that wife of his:
https://www.eastbaytimes.com/2022/05/20/emails-show-thomas-deep-involvement-in-2020-election/
Virginia “Ginni” Thomas, wife of Supreme Court Justice Clarence Thomas and a conservative political activist, urged Republican lawmakers in Arizona after the 2020 presidential election to choose their own slate of electors, arguing that results giving Joe Biden a victory in the state were marred by fraud. The revelations first published by The Washington Post on Friday show that Thomas was more involved than previously known in efforts, based on unsubstantiated claims of fraud, to overturn Biden’s victory and keep then-President Donald Trump in office. In the days after The Associated Press and other news organizations called the presidential election for Biden, Thomas emailed two lawmakers in Arizona to urge them to choose “a clean slate of Electors” and “stand strong in the face of political and media pressure.” The AP obtained the emails under the state’s open records law.
The monthly payments in a typical house has increased dramatically.
https://calculatedrisk.substack.com/p/lawler-the-sharp-increase-in-monthly?s=r
I think we may be looking at a housing market crash within the next year. People will simply not be able to afford houses at those monthly payment levels – and the only way to correct that problem is to have a drastic reduction in prices. Rates are not going to go down anytime soon.
NYC’s figure is $2753 per month which compares to the typical rent paid by residents here. I grant higher interest rates might cool this insanely strong housing market but not yet ready to forecast a crash.
Persistent excess inflation will help with real costs. Hopefully.
I looked over some of Bill McBride’s recent reports on the housing market. It may be cooling slightly from the red hot market we have seen in the last couple of years but sales and construction remain strong – at least for now.
There is certainly no signs of useful cooling here in the great north wet. I wish there were.
https://fred.stlouisfed.org/series/PRFIC1
Real Private Residential Fixed Investment
Big surge in 2021QIV with a bit of a reversal but still strong showing no indication of a crash just yet.
Right now a number of people on contract have locked in the 3% rate. I would keep a close eye on number of new contracts signed at the current 5%. It will take a few months for this to show up in the numbers. The next year will be interesting. It will also depend a lot on how much the Fed overreacts to temporarily increased inflation numbers.
“It will also depend a lot on how much the Fed overreacts to temporarily increased inflation numbers.”
I hear you. We do not need another Volcker.
Not the way it works. Housing payments go up and down. Credit markets determine housing levels.
I have considerable admiration for those who make their point with only as many words as needed. Sadly, that doesn’t apply to you. You’ve written only enough to be dismissive, but have failed to make a point haven’t made a point. Smug and shallow.
I you have a point to make, go to the trouble of making it clearly. Allow me to demonstrate:
You are wrong to make a blanket claim that “housing payments go up and down.” If, by ‘”housing payments” you mean mortgage payments, they are fixed under fixed rate mortgages and “go up and down” under variable rate mortgages. I you mean rent payments, they are often fixed for a period by a contract. While the contract is in force, payments don’t vary. See? Clarity. Your assertion was clearly wrong.
If you’d like, I can also show why “Credit markets determine housing levels” is a mess. We can’t be sure of what you mean, but no meaning I can guess at would be correct.
Educate yourself.
“I have considerable admiration for those who make their point with only as many words as needed.”
Why did I immediately think of Princeton Steve. He can write thousands of words and never make a point.
People like me and my wife wouldn’t be able to afford houses now in a whole lot of markets already. The fact that interest rates are going up just means fewer people can afford houses. Self-funded REITs don’t have that problem, which will continue to distort things a bit. Interest rate increases will put a damper on some of the rapacious developers in Seattle, with any luck. Tear down an older house on a small lot and stuff five or six cereal boxes onto that lot. Each of those cereal boxes sell for close to the same as the developer bought the original house for. I’m baffled by it. It’s ugly but it is not doing anything to ease housing shortages or easing housing prices.
The most important factor contributing to current recession risk is the oil price shock, which alone raises the recession probability by 12.6 percentage points.
[ This energy price or energy-food price risk however is just the risk many developing countries are confronting, and such an unallayed country by country seems especially worrying. India is taking special precautions, so too is China. ]
https://fred.stlouisfed.org/graph/?g=MN3g
January 15, 2018
Consumer Price Indexes for food and energy in United States, 2017-2022
(Indexed to 2017)
https://fred.stlouisfed.org/graph/?g=NT1G
January 30, 2018
Consumer Price Indexes for food and energy in Euro Area, 2017-2022
(Indexed to 2017)
You do well to point out it’s not just oil:
https://farmpolicynews.illinois.edu/2022/05/global-food-problems-piling-up-india-wheat-export-ban-adds-to-global-strains/
The story ranks wheat exports by nation but this statistic is not as meaningful as wheat production by country:
https://worldpopulationreview.com/country-rankings/wheat-production-by-country
China produces more wheat than any other nation but likely consumes all of it. India produces a lot of wheat but again it consumes a lot of wheat. That they are cutting off exports is a problem but then Ukraine not being able to export wheat may be a larger problem even if their wheat production is lower.
Russia produces as much wheat as Canada and the US combined. If wheat prices soar, is the world really going to boycott their wheat too?
https://fred.stlouisfed.org/graph/?g=Ndeh
January 30, 2018
Producer Price for Wheat, 2007-2022
(Indexed to 2007)
@ pgl I’m guessing you’re asking this rhetorically, but I think the short answer would be “NO”.
https://www.nytimes.com/2022/05/20/opinion/stagflation-inflation-economy.html
May 20, 2022
Wonking Out: Is stagflation making a comeback?
By Paul Krugman
When I talk to business groups these days, the most commonly asked question is, “Are we headed for stagflation?” I’m pretty sure they find my response unsatisfying, because I tell them it depends on their definition of the term.
If they understand it to mean a period of rising unemployment combined with inflation that’s still too high, the answer is that there’s a very good chance that we’ll suffer from that malady for at least a few months. But if they’re referring to something like the extreme pain we suffered to close out the 1970s, it looks unlikely.
To explain the difference, consider two historical episodes.
First, look at 1979 to ’80, which illustrates what I suspect most people have in mind when they talk about stagflation. At the beginning of 1979 the United States already had 9 percent annual inflation; the surge in oil prices after the Iranian revolution sent inflation well into double digits. The Federal Reserve, under Paul Volcker, responded with drastically tighter monetary policy, leading to a recession and a sharp rise in unemployment:
https://static01.nyt.com/images/2022/05/20/opinion/krugman200522_1/krugman200522_1-jumbo.png?quality=75&auto=webp
The stagflation we remember.
The recession brought inflation down but not enough, so the Fed tightened the screws further, sending the economy into a double dip (not shown on the chart). This finally did bring inflation down to around 4 percent, considered acceptable at the time, but at immense cost: Unemployment peaked at 10.8 percent in 1982 and didn’t get back down to 1979 levels until 1987.
Now look at the period from 2007 to the fall of 2008, just before the demise of Lehman Brothers. On the surface it looks somewhat similar, with uncomfortably high inflation, brought on by rising oil and other commodity prices, and surging unemployment:
https://static01.nyt.com/images/2022/05/20/opinion/krugman200822_2/krugman200822_2-jumbo.png?quality=75&auto=webp
This time was different.
And a fair number of influential people worried about runaway prices more than the recession. According to the transcript of the August 2008 meeting of the Federal Open Market Committee, which sets monetary policy, there were 322 mentions of inflation and only 28 of unemployment.
Yet inflation subsided quickly. And while there was a severe recession — still generally known as the Great Recession — it had nothing to do with squeezing inflation out of the economy and everything to do with the fallout from a severe financial crisis.
What was the difference between these episodes? At the beginning of the 1980s, inflation was deeply entrenched in the economy, in the sense that everyone expected high inflation not just in the near term but also for the foreseeable future; companies were setting prices and negotiating wage deals on the assumption of continued high inflation, creating a self-fulfilling inflationary spiral. It took a huge, sustained uptick in unemployment to break that spiral.
In 2008, by contrast, while people expected high inflation in the near future — probably because they were extrapolating from higher gasoline prices — their medium-to-long-term expectations about inflation remained fairly low:
https://static01.nyt.com/images/2022/05/20/opinion/krugman200822_3/krugman200822_3-jumbo.png?quality=75&auto=webp
Inflation, not entrenched
So there wasn’t any inflationary spiral to break.
Where are we now? As that last chart shows, consumer inflation expectations now look a lot like those of 2008 and nothing at all like those of 1979 to ’80…
https://fred.stlouisfed.org/graph/?g=PEoG
January 4, 2018
Unemployment rate and Consumer Price Index, 1978-2022
(Percent and Percent change)
https://fred.stlouisfed.org/graph/?g=PEiV
January 4, 2018
Unemployment rate and Consumer Price Index less food & energy, 1978-2022
(Percent and Percent change)
This research raises question abou the underlying source of additional information. What do we know about the predictive power of foreign term spreads for home economies? My (limited) understanding is that the U.S. case is well demonstrated, but there is a weaker case for other countries’ term spreads.
My reason for asking is that the U.S. economy is affected by the performance of other economies, so there could reasonably be additional information about the outlook for the U.S. in the term spread of other economies, if term spread contains information about the future performance of those economies. Otherwise, this is wierd.
Term structure elsewhere is affected by U.S. term structure. But it would be odd if that’s a source of information about the U.S. economy beyond what’s already in U.S. term structure.
Nice work. Raises qustions.
macroduck,
I think you have it. The obvious way that flattening foreign yield curves could suggest higher likelihood of output decline in the US beyond flattening of that curve in the US is through their implications for what happens in foreign economies. If they decline that puts downward pressure on the US economy by reducing US exports. I agree that it is not obvious what other mechanism would operate, although there may be some operating through linked financial channels. But the obvious link is from weak foreign economies leading to reduced US exports.
https://news.cgtn.com/news/2022-05-20/China-delivers-world-s-first-100-000-tonne-mobile-fish-farm–1abyPjeFiw0/index.html
May 20, 2022
China delivers world’s first 100,000-tonne ‘mobile fish farm’
By Gong Zhe
In a world first, China delivered a 100,000-tonne smart aquaculture vessel on Friday in Qingdao City, east China’s Shandong Province.
The ship, named Guoxin-1, is the realization of an innovative mobile fish farming model regarded as a technological breakthrough for China’s deep-sea aquaculture industry.
The fish farm vessel is 249.9 meters long, with a deadweight of 100,000 tonnes and a displacement of 130,000 tonnes, large enough to survive typhoons.
The cabin has 15 rooms, each larger than two standard swimming pools.
According to CMG, the ship can handle 3,700 tonnes of fish annually, including yellow croakers, groupers and Atlantic salmon.
The key technology is the non-stop water exchange between the cabin and the sea that makes the water environment on the ship enclosed and controllable, said Dong Shaoguang, deputy general manager of the ship’s state-owned funder, Qingdao Conson Development Group.
Dong told the media that the Guoxin-1’s breeding density is three to five times higher than traditional cages, and the aquaculture cycle can be up to a quarter shorter.
The ship will farm in the Yellow Sea, East China Sea and South China Sea, with the first batch of yellow croakers raised expected to be on the market by the fall of 2022….
There are 3 more such fish farm ships to be introduced. The technology has been long in development and increasingly necessary, as open river and sea fishing has been increasingly limited, with the entire Yangtse closed to fishing for 10 years. Also rice fields are increasingly being designed for fish and crab raising, while a new hybrid rice is beginning to be grown in saline soil against coastlines.
As for surplus grain stocks, both the United States and China have important surplus stocks; rice, wheat, corn, soybeans and seed oils.
Your use of oil and stocks is 20th century flawed. Oil is no higher than 2010-14 adjusted for inflation and frankly is going to come under pressure with alternatives starting to pop up which will require opec to respond. Stock prices bloated for speculation, with a notable floor being set.
I see no slowdown with credit markets, actually the opposite is happening. This in the 21st century is the first line when looking at recession %%%.
@ Gregory Bott
Investment grade bonds are paying around 4.4% right now. And you think this doesn’t effect stock market returns, and stock market returns don’t hugely effect main street?? Your “modern” way of viewing things is highly fascinating. And if economic growth rates are low at the same time rates are rising how do you think that effects corporate debt over the long-term?? I hope you have a good fiduciary/agent handling your money.
In case Gregory does not believe investment grade corporate bond yields have risen to 4.4% here is how FRED reports the yield on BBB rate bonds (the lowest investment grade:
https://fred.stlouisfed.org/series/DBAA
5.2% is quite high relative to where rates were.
Macroduck has been reporting on credit spreads of late, which is certainly of interest. Note a couple of comparisons of long-term interest rates as of 12/1/2021 versus 5/17/2022.
Corporate bond rates for BBB rated debt went from 3.25% to 5.25% (a 2% increases).
But government bond rates rose from 1.85% to 3.35% (a 1.4% increase).
So the credit spread was only 1.4% on 12/1/2021 but rose to 1.9% as of 5/17/2022.
We all know the FED is raising government bond rates but maybe we should ask Macroduck what he sees as driving the increase in credit spreads.
a 1.5% increase in government bond rates (sorry for the confusion).
You’ve misunderstood the meaning of “shock”.
You’ve made an unsubstantiatesd claim about credit market behavior. The fact that you don’t “see” something is of no importance. Conditions in credit markets have changed substantially from last year. Tell us, oh great one, why “slowdown” is the operative term?
Marjorie Taylor Greene says Bill Gates wants everyone to get Monkeypox:
https://www.msn.com/en-us/news/mma/watch-marjorie-taylor-greene-pushes-bill-gates-monkeypox-conspiracy/vi-AAXxOfn
Yep – she is that insane!
https://www.msn.com/en-us/money/markets/yellen-s-global-tax-plan-meets-resistance-abroad-and-at-home/ar-AAXx2Oo?ocid=msedgdhp&pc=U531&cvid=b1537d792dab47bdaefbf9def3f02ce4
The OECD and most nations are pushing called Pillar 2 which would make sure multinationals should pay at 15% of their worldwide income in profits taxes. I would put this minimum tax at 25% so 15% is not asking for too much. Of course the Republican Party does not like the idea of taxing the rich as they want to take the working class instead. But why is Poland so upset at this modest proposal?
https://english.news.cn/20220520/25936c53bb3a431ba46fd950a7da2aef/c.html
May 20, 2022
Lower energy consumption intensity reflects China’s commitment to green shift
BEIJING — As part of its efforts to foster a greener and more sustainable economy, China, the world’s largest energy producer and consumer, is rapidly reducing the intensity of its energy consumption.
In 2021, the country’s energy intensity — energy consumption per unit of gross domestic product (GDP) — decreased by 2.7 percent from the previous year, and the decline came as the energy intensity fell by 28.7 percent from 2011 to 2020, one of the fastest reductions in the world.
From 2016 to 2020, China’s average annual economic growth of 5.7 percent was fueled by a merely 2.8 percent annual increase in energy consumption, and the amount of energy it saved accounted for nearly half of the global energy savings during this period.
“The control over energy consumption intensity should focus on the industrial structure adjustment in high energy consumption areas and the technical transformation in relevant industries,” said Wang Jinnan, head of the Chinese Academy of Environmental Planning under the Ministry of Ecology and Environment.
While thermal power still accounts for about 70 percent of China’s power generation, the country is striving to reduce its dependence on coal to tackle pollution and climate change caused by fossil fuel combustion.
The country’s energy consumption was under 5 billion tonnes of standard coal in 2020, while the proportion of coal consumption registered 56.8 percent, shrinking from 72.4 percent in 2005….
https://english.news.cn/20220518/18333edae15a41dc9f0f32bb2d9d1027/c.html
May 18, 2022
China’s renewable energy capacity expands rapidly in first four months
BEIJING — China’s installed capacity of renewable energy registered fast growth in the first four months of the year as the country strived to reach its carbon peaking and carbon neutrality goals.
In the January-April period, the capacity of wind power jumped 17.7 percent year on year to around 340 million kilowatts, while solar farms saw capacity hit 320 million kilowatts, an increase of 23.6 percent, according to the National Energy Administration….
https://news.cgtn.com/news/2022-05-20/China-welcomes-more-countries-to-join-BRICS-Plus-Wang-Yi-1abPx6v2SlO/index.html
May 20, 2022
China welcomes more countries to join ‘BRICS Plus’: Wang Yi
China will always be a member of the big family of developing countries, and will always stand with other developing countries, adhere to the humanity’s common values of peace, development, equity, justice, democracy and freedom, and make unremitting efforts to build a community with a shared future for mankind, Chinese State Councilor and Foreign Minister Wang Yi said on Thursday.
Wang made the remarks when chairing a video dialogue between foreign ministers of BRICS, emerging markets and developing countries including Kazakhstan, Uzbekistan, Argentina, Egypt, Thailand, Indonesia, Nigeria, Senegal and Saudi Arabia.
True multilateralism: the guarantee for the survival of emerging markets and developing countries
When talking about multilateralism, the foreign minister said that the world is facing the risk of division and confrontation as bloc politics is rampant and the specter of a “new cold war” lingers.
In the face of unprecedented changes and turmoil, multilateralism is the guarantee for the survival of emerging markets and developing countries, he said.
“We need to firmly uphold the international system with the United Nations at its core, oppose ganging up to form small cliques, and oppose coercing other countries into taking a side,” Wang added,
China is willing to work with all parties to promote the implementation of the Global Security Initiative, enhance global security governance, and safeguard world peace and tranquility, he reiterated.
Sustainable development: the mission of global governance
Development is our common pursuit and the mission of global governance. We need to promote the international community to prioritize development in global governance, compose a ”melody” of common development, and play a “symphony” of sustainable development, Wang said….
President Xi Jinping has proposed importantly expanding the BRICS (Brazil, Russia, India, China, South Africa) association, as a development partnership, with Kazakhstan, Uzbekistan, Argentina, Egypt, Thailand, Indonesia, Nigeria, Senegal and Saudi Arabia looking to association and membership.
ltr,
This is actually an interesting development, although at some level it is sort of odd given that originally the BRICs were an idea cooked up by the research department at Golden Sachs. I am wondering what it is about this particular set of nations that makes them the ones that should be added to the group. Should somebody ask the folks at Goldman Sachs if they approve?
China is trying to align as much of the world as possible with China. No surprise.
What most people label “soft power” village idiot “ltr”, Xinhua news, and CGTN label “goodwill to all mankind”. Go figure……
It remains unclear what this group of nations has un common. If they are to include heavily populated nations or ones deeply involved in the CRI, why is not Pakistan on the list? If it is to include ones closely friendly to China and anti-US and exporting oil, why is not Venezuela on the list. And what are Thailand and Egypt and Senegal doing on the list? Why not Turkey, which the Goldman Sachs people have said should be in the group (they also have said Indonesia should be, which fits for being large and neutral with respect to US).
“BRI” not “CRI”. Sorry.