Mr. Steven Kopits writes:
But by and large, VMT on a 12 mms basis turns a bit before or right at the start of a recession.
I take the not seasonally adjusted vehicle miles traveled series extending back to 1970 and define a 12 month moving average variable. I think define a dummy variable that takes a value of 1 whenever this moving average term turns negative. This is plotted as blue bar in the graph below, with NBER defined recession dates shaded dark gray:
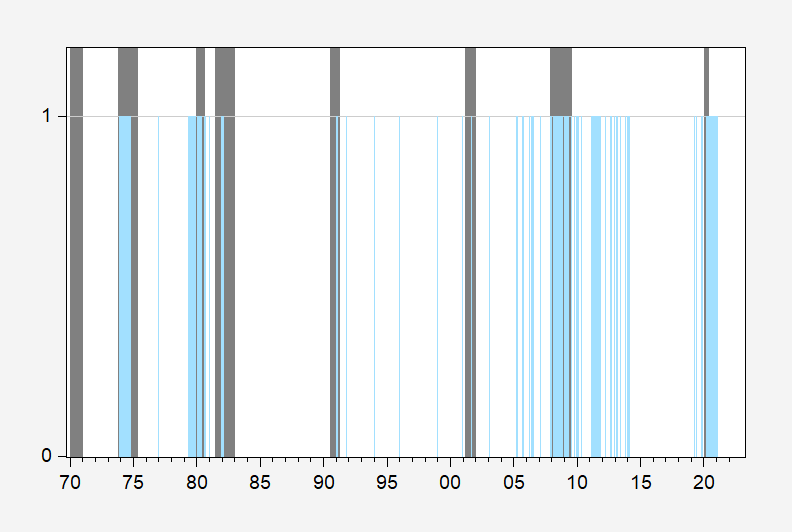
Figure 1: Months when 12 month trailing moving average of VMT declines (blue bar), and NBER defined recession dates (dark gray bars). Source: DOT FHA via FRED, NBER and author’s calculations.
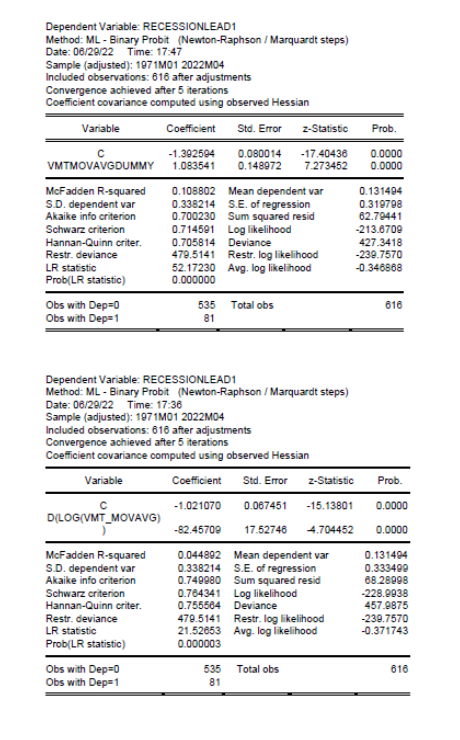
Using a one lag probit model, with negative 12 month trailing moving average of VMT dummy as a predictor, I predict recessions thusly:
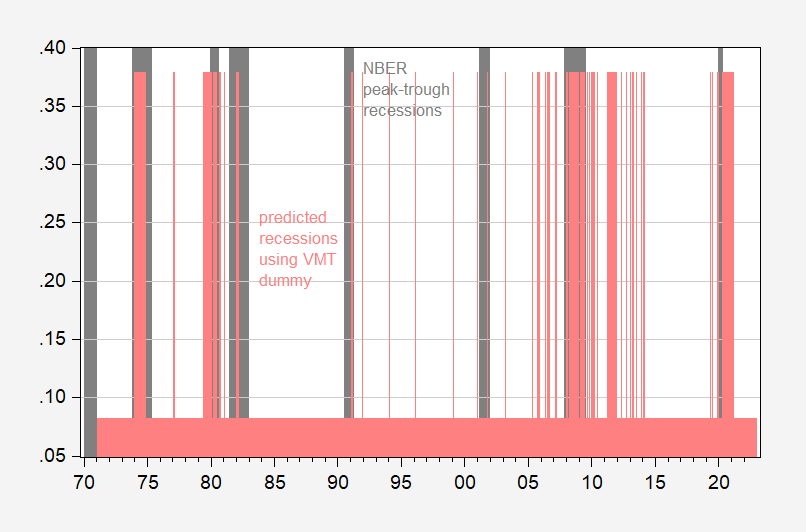
Figure 1: Implied probability of recession using dummy variable taking on value of unity when 12 month trailing moving average of vehicle miles traveled is negative, lagged one month (pink), and NBER defined peak-to-trough recession dates (gray bar). Source: NBER and author’s calculations.
The McFadden R2 from this regression is 0.11. The proportion of correct calls on recessions is 48% (using a threshold of 30% for predicting a recession). Regression output at end of post.
As is obvious, there are many false calls, exactly because there are numerous occasions where the 12 month moving average of VMT declines without an accompanying NBER-defined recession (of course, one could define recessions in a way to make the VMT variable predict perfectly; that would be to define recessions as the months after a decline in the 12 month moving average of VMT!)
What if we use actual change in the 12 month trailing moving average (lagged one month)? Then we get this picture.
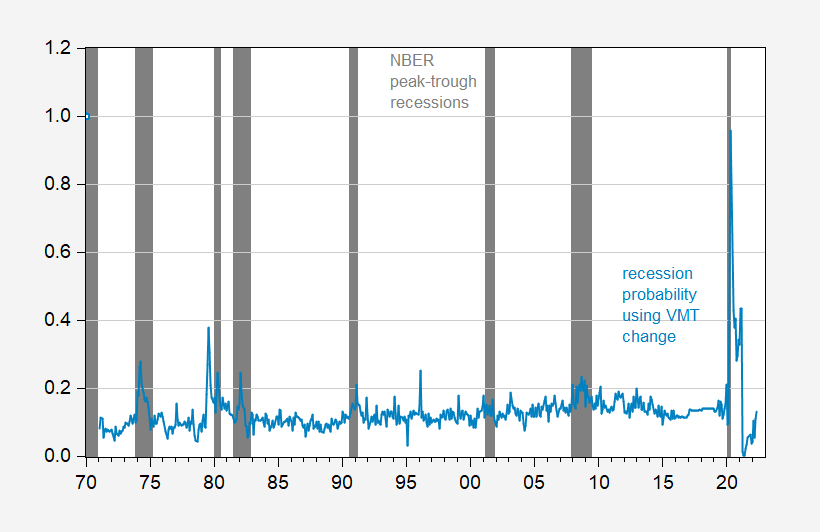
Figure 3: Implied probability of recession using 12 month trailing moving average of vehicle miles traveled, lagged one month (sky blue), and NBER defined peak-to-trough recession dates (gray bar). Source: NBER and author’s calculations.
The McFadden R2 from this regression is 0.04. The proportion of correct calls on recessions is 16% (using again a 30% threshold). Regression output at end of post.
Once again, not a particularly good predictor of recessions as defined by the NBER.
Addendum:
The VMT variable is a reasonable coincident indicator. A probit regression has a McFadden R2 of 7%, with 18% correct calls for recessions using a 30% threshold.
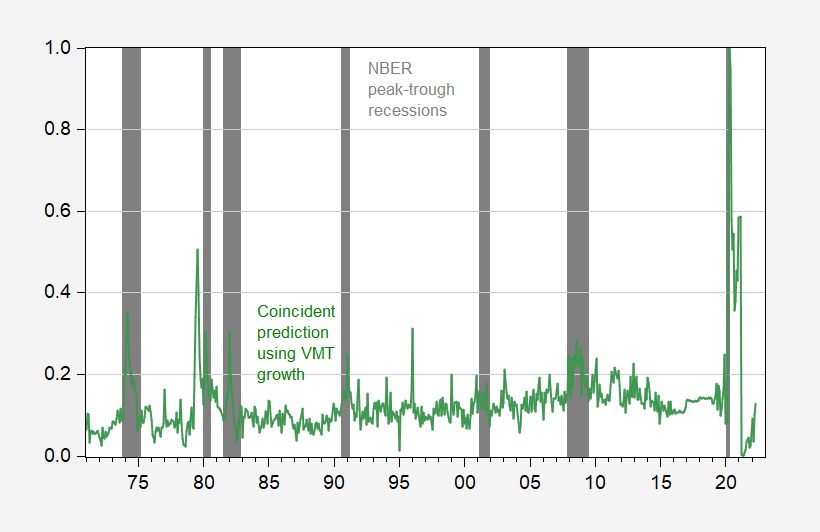
Figure 4: Implied probability of recession using 12 month trailing moving average of vehicle miles traveled, contemporaneously (green), and NBER defined peak-to-trough recession dates (gray bar). Source: NBER and author’s calculations.
Professor Chinn,
It looks like the Y/Y percent change in FRED series: TRFVOLUSM227NFWA, VMT NSA, shows a similar result to Figure 4 above with a McFadden R squared of about 0.08, but I did not think that an 18% correct rate would be considered a reasonable indicator, nor did I think that the 0.08 McFadden R squared was a good model. I used FRED series, USRECM as the recession indicator.
AS: R2 between the two variables is 0.98, so not surprising you’d get similar results to mine.
I concur, McFadden R2 of 0.08 is lousy (to be technical) for a time series model. 18% correct using such a low threshold (0.30) is also pretty pathetic. However, I was trying to be kind to Kopits’ model.
Last sentence got me to chuckle at my monitor.
Leading: “The proportion of correct calls on recessions is 16% (using again a 30% threshold).”
Coincident: “A probit regression has a McFadden R2 of 7%, with 18% correct calls for recessions using a 30% threshold.”
Isn’t the U.S. in recession about 15% of the time? So as a recession forecasting tool, vehicle miles traveled is a 1% improvement over a 15% coin-flip? (You know what I mean.) Doesn’t the term spread do a much better job?
And as confirmation of recession (coincident indicator), VMT is right 3% more often than a blind guess? Doesn’t the Sahm Rule do a much better job?
Thirty percent threshold? Don’t we have a whole toy box full of indicators that do a better job, which have already been rejected as not good enough?
Any chance the guy who tries to earn a living as an energy consultant is just pulling out a bunch of energy-consultant data series, squinting at them and deciding they’re recession indicators?
Macroduck: (1) Yes. (2) Yes. (3) Yes. (4) Yes.
“squinting at them and deciding they’re recession indicators?”
This comment thread gave me two of the best chuckles I’ve had all day.
Said the goof who’s not good at doing economic models.
Moses,
If you could get a student version of EViews with a text purchase, I think you could do just fine with economic models. I assume that using “R” is similar to building a car before you can drive it. EViews is similar to driving a sportscar off the dealer floor.
@ AS
I think there’s a great deal of truth in what you are saying. But I keep imagining in my mind using EViews student version, I get super excited because I get it to work on some easier models, easier examples, then the 6 month “trial” runs out, and I’m back where I started.
Your comment means a great deal to me from a morale standpoint.
And I’m going to revisit this in my thoughts over the next week or so. My birthday is rolling around here, and I’m not 1/10th as good at math as I was in my college years. If I don’t start focusing on this very soon, it’s becoming apparent to me I will never get this done~~which will be a kind of sadness for me.
I live to entertain. :^)
Today the SEC fined Ernst & Young $100 million for allowing their auditors to “cheat on their ethics exams.”
So my question:
Is this Alanis Morissette ironic or for real ironic? I’m never quite sure.
After Phil Gramm robbed the SEC of funding, manpower, and resources it’s a wonder any of them could do more than grab a single Dunkin’ Donuts coffee in the morning and boot up their Windows 98 at the office.
https://www.motherjones.com/politics/2008/05/foreclosure-phil/
“In the 1990s, as chairman of the Senate banking committee, he routinely turned down Securities and Exchange Commission chairman Arthur Levitt’s requests for more money to police Wall Street; during this period, the sec‘s workload shot up 80 percent, but its staff grew only 20 percent. Gramm also opposed an sec rule that would have prohibited accounting firms from getting too close to the companies they audited—at one point, according to Levitt’s memoir, he warned the sec chairman that if the commission adopted the rule, its funding would be cut.”
Soon after that we got Enron, Worldcom, and a host of other accounting scandals that brought down Arthur Andersen. The current Big Four are almost as tainted and yet they survive.
That someone at the Big Four cheats somehow does not surprise me at all. But cheating on an ethics exam takes this to a whole new level.
may people live by the philosophy that greed is good.
With all the fishing Stevie has been up to maybe it is time to review this classic from Ed Leamer:
https://www.jstor.org/stable/1803924
Let’s Take the Con Out of Econometrics
Edward E. Leamer
The American Economic Review
Vol. 73, No. 1 (Mar., 1983), pp. 31-43 (13 pages)
A story about the bigoted views of two really loathsome people:
https://thehill.com/changing-america/respect/equality/599427-marjorie-taylor-greene-says-she-is-threatened-by-trans/
Georgia Rep. Marjorie Taylor Greene (R) has said she feels threatened by transgender women, who she alleges are “aggressively replacing” cisgender women in some spaces. Taylor Greene in a tweet on Tuesday referred to trans women as “biological men,” a term often used by anti-LGBTQ+ activists to imply that trans people are not who they say they are, according to the media advocacy group GLAAD. “As a woman, I feel threatened because biological men are aggressively replacing women,” Taylor Greene wrote on Twitter. “All of my life, as an American women, I’ve been equal in every place to men, but not anymore.” Taylor Greene was replying to a tweet by conservative Fox News host Tucker Carlson criticizing USA Today for naming Assistant Health Secretary Rachel Levine, who is transgender, one of its “Women of the Year.”
Marjorie Taylor Greene is so ugly that it would be a service to humanity if she were replaced. As far as Tucker – are we sure he is not trans? He after all is a totally wussie girly “man”.
‘As is obvious, there are many false calls, exactly because there are numerous occasions where the 12 month moving average of VMT declines without an accompanying NBER-defined recession (of course, one could define recessions in a way to make the VMT variable predict perfectly; that would be to define recessions as the months after a decline in the 12 month moving average of VMT!)’
Now that is world class snark! Of course we have seen Stevie telling us that we were in a recession from 2011 to 2014 and we came close to a recession in 1998. I guess increasing real GDP and employment does not stop him from crying RECESSION!
In fairness to Steve Kopits, here is a FRED graph I’ve created comparing the YoY% change in vehicle miles driven and the YoY% change in real GDP:
https://fred.stlouisfed.org/graph/?g=R7Hv
It’s pretty clear there is a strong correlation. There appears to have been about a 1 year lag in the effect of GDP in the 1970s and 1980s, that more or less disappeared afterward.
But even the quarterly averages in vehicle miles driven appear far too volatile to make it very useful in forecasting, except in broad terms, even if in hindsight the relationship is clear. In other words, the YoY slowdown in miles driven to 2.5% in the last two quarters suggests YoY real GDP is likely to slow to about that range as well – but with a lot of variance.
I just don’t think focusing on one area – energy prices and use – to the exclusion of all others is a good way to forecast or even nowcast, except in extreme situations like 1974 and 1979.
Thanks for the analysis.
https://news.cgtn.com/news/2022-06-30/China-s-June-factory-activity-grows-as-recovery-gathers-pace-1bhnaBWT0ju/index.html
June 30, 2022
China’s factory, service sectors expand in June as recovery accelerates
China’s economic recovery gathered pace in June as the factory and the service sector expanded, official data showed on Thursday.
The June composite PMI, measuring both manufacturing and services activity, rose to 54.1 compared with 48.4 in the previous month, data from the National Bureau of Statistics (NBS) showed.
China’s manufacturing purchasing managers’ index (PMI) rose to 50.2 in June as production recovered and logistics improved. It slightly missed Reuter’s forecast at 50.5.
A PMI register above 50 indicates expansion in business activity. The manufacturing sector has reversed from a three-month contraction as the new order delivery time was slashed.
Measures in guaranteeing the smooth operation in the logistics sector have been effective in cutting suppliers’ delivery time to support the production and operation of enterprises, said Zhao Qinghe, a senior NBS statistician.
https://news.cgtn.com/news/2022-06-30/China-s-June-factory-activity-grows-as-recovery-gathers-pace-1bhnaBWT0ju/img/b0ad5b06d898428b8325db6baadc35c8/b0ad5b06d898428b8325db6baadc35c8.jpeg
The production index and new order index came at 52.8 and 50.4, respectively, 3.1 and 2.2 percentage points higher than in May, while the supplier delivery time index was 51.3, a monthly increase of 7.2 percentage points, the NBS data showed.
Zhao cautioned that despite the recovery trend, soft market demand still haunts the manufacturing industry and squeezed profit margins still weigh on enterprises.
Service sector rebounds swiftly
China’s service segment rebounded significantly for two consecutive months, NBS data showed.
The non-manufacturing PMI rose to 54.7 in June, 6.9 percentage points higher than the previous month as COVID-19 containment measures eased.
“With the impact of the pandemic phases out, market demand in the service industry warmed up, and business confidence is gradually recovering,” said Zhao.
In terms of market demand and expectations, the new order index and business activity expectation index were 53.7 and 61.0, respectively, up 10.0 and 5.8 percentage points from the previous month….
https://news.cgtn.com/news/2022-06-30/Chinese-mainland-records-33-new-confirmed-COVID-19-cases-1bhlX7sffcQ/index.html
June 30, 2022
Chinese mainland records 33 new confirmed COVID-19 cases
The Chinese mainland recorded 33 confirmed COVID-19 cases on Wednesday, with 8 attributed to local transmissions and 25 from overseas, data from the National Health Commission showed on Thursday.
A total of 77 asymptomatic cases were also recorded on Wednesday, and 832 asymptomatic patients remain under medical observation.
The cumulative number of confirmed cases on the Chinese mainland is 225,638, with the death toll from COVID-19 standing at 5,226.
Chinese mainland new locally transmitted cases
https://news.cgtn.com/news/2022-06-30/Chinese-mainland-records-33-new-confirmed-COVID-19-cases-1bhlX7sffcQ/img/5cb5559330f7459bad11b4a0a0db17d0/5cb5559330f7459bad11b4a0a0db17d0.jpeg
Chinese mainland new imported cases
https://news.cgtn.com/news/2022-06-30/Chinese-mainland-records-33-new-confirmed-COVID-19-cases-1bhlX7sffcQ/img/f85f219083a24a0fa3ad129989188a2d/f85f219083a24a0fa3ad129989188a2d.jpeg
Chinese mainland new asymptomatic cases
https://news.cgtn.com/news/2022-06-30/Chinese-mainland-records-33-new-confirmed-COVID-19-cases-1bhlX7sffcQ/img/881f7545ba5346dcbdba649642734592/881f7545ba5346dcbdba649642734592.jpeg
https://www.worldometers.info/coronavirus/
June 29, 2022
Coronavirus
United States
Cases ( 89,236,449)
Deaths ( 1,042,291)
Deaths per million ( 3,113)
China
Cases ( 225,605)
Deaths ( 5,226)
Deaths per million ( 4)
Inflation adjusted consumer spending down 0.4%. Sure goes hand in hand with Larry Summers’ arguments that demand is driving inflation, doesn’t it?? I wonder when Summers is planning on co-writing his next book with Judy Shelton?? Summers can tell us how East European War, mass murder of Ukrainians, and global supply chain problems heat up USA consumer demand and Judy can tell us how fiscal pandemic aid to low-income families from the Democrat Congress ruined America.
I can understand a dumb man like Powell taking Republicans’ and Summers bait that the inflation is demand based, but Brainard?? I was expecting more intelligence from her corner of the room. Oh well, she bit Republicans fish hook, and when they’ve ridden this economy into unnecessary job losses to put large employers back in the driver’s seat in the labor market, and Biden is drowning in the deep end of the pool going into 2024 they can send a thank you note to Ron DeSantis’ new head economic adviser, Larry Summers, who right after he gets appointed to whatever job he wants with DeSantis can tell us rates need to be lowered really fast, and NOW, and that Democrats need to sign on “right now” to whatever fiscal policy Larry Summers hated when Dems had the White House. Surely Summers will phone up Pelosi first since he knows she’s down at some premium ice cream salon sleeping with her head on the booth table, and she’ll be “newly energized” to pass stimulus now that she knows a Republican “she hates” has the White House. Because that’s “how Pelosi rolls”.
I have to say, this is an absolutely brilliant piece of analysis, best ever, as far as I am concerned, Menzie.
Now let me explain what it says, because I know this entire period pretty well. I’ll be referring to Fig. 1 above, but I think the various figures tell largely similar stories. Let’s take events chronologically.
1970: Not an oil shock, both of us agree.
1973-1974: Here, Fig 1 shows the VMT indicator as contemporaneous with the recession (Yom Kippur War and Arab Oil Embargo). This is the template recession for the Ukraine war.
There is some kind of false positive 1977, but gasoline prices were generally high in the latter 1970s.
1979: Once again, VMT is a good leading and / or contemporaneous indicator of the 1979 recession associated with the Iran Revolution, a recession again involving an oil producer.
1979-1983 As readers will recall, I treat this period as a single recession, as they do in Europe. By this interpretation, the indicator from 1979-1980 carries over into the 1980-1983 period. Nevertheless, In the US, it is counted as two recessions, because there is a ten month period (I think it’s ten months) of economic growth between the ’79 and ’81 recessions.
1981-1983. This is the period of the Iran-Iraq War, an oil shock recession associated with a war involving oil producers, another possible template for the Ukraine war. The oil market dynamics were quite peculiar here. Oil prices remained high, in real terms I believe this remains the period of the highest oil prices in real terms. However, there were two mitigating factors. First, oil prices were falling through the 1981 recession, as you can see on the blue line on this graph:
http://www.prienga.com/blog/2022/6/26/us-oil-consumption-and-recessions
Therefore, the situation was unacceptably bad, but improving.
Second, this period saw the beginning of rapid and material gains in automobile fuel efficiency. Those old enough to remember will recall that this is when we traded in our American behemoths with tail fins for thrifty Volkswagens and Hondas, the results of which you can see on this graph:
http://www.prienga.com/blog/2022/6/30/us-road-fuel-and-observed-mpg
As a consequence, the 1981 recession did not see a further decline in VMT , or just a short one. Nevertheless, the US did not regain April 1979 VMT levels (on a 12 mms basis) until August 1982, and this at a time when the country’s motorization was still ongoing. It was an almost three and a half year trough which would foreshadow the 2005-2014 period. I would note that anyone who talks about the price elasticity of oil demand needs go get their heads around this period. This is, for example, the crucible of the concept of ‘carrying capacity’, a term which I have used often in the past.
After this comes the 1991 recession, Gulf War I. For months the media was full of the risk of high oil prices, but they surged only for a short while, late, and oil spend (($ / barrel * barrels / day ) / GDP in nominal terms for the period in question) never reached the 4% of GDP threshold I use for an oil shock. As I recall, Jim has this as an oil shock and I sort of do, too, but clearly, Fig 1 provides only lackluster support of that thesis.
Similarly, to my mind, 2001 does not really qualify as much of an oil shock, and that’s what Fig. 1 suggests.
I would note a number of small, scratchy false positives in the 1990-2000 period. In general, VMT was rising through this period using a 12 mms basis. I don’t know where the seemingly false positives come from, but maybe they have some message which I have failed to discern. So let’s leave them in for now.
It is very important to note that Fig 1 shows that there are no major oil shocks between 1983 and 2005. And there is a reason for this. In order to maintain high oil prices after 1980, OPEC continuously cut production, such that Saudi Arabia’s production fell from around 11 mbpd in 1979 (same as today!) to around 2 mbpd in 1983 (around there). Had OPEC persisted with its high oil policy, Saudi Arabia would have ceased producing oil entirely by 1985. At the same time, high oil prices stimulated new production. Alaska’s Prudhoe Bay added 2 mbpd, and both the Gulf of Mexico and the North Sea were developed as a result of these high oil prices.
As a result, by 1983 (around there), the world had 25% spare capacity. In today’s terms, that would equal the production of Russia, Saudi Arabia and Iran combined, and that was turn-on-the-tap kind of spare capacity. Imagine that we had yet another Saudi, Russia and Iran producing nothing and hoping to get back into the game. That was the situation at the end of the early 1980s recession.
The predictable result was a period of sustained low oil prices, and that period has a name: The Great Moderation.
The spare capacity resulting from the early 1980s was largely consumed by 2002-2003. In 2005, the oil supply stopped responding, and that’s where discussions of peak oil started. At the same time, China hit its stride and its oil demand started to surge. This became acute in, wait for it, 2008 and 2009, when OECD consumers were providing up to 80% of China’s incremental oil consumption. That is, for every 5 barrels that China increased its oil consumption, 4 were contributed through lower oil consumption in the OECD economies. Those same OECD economies were the ones crushed by the GFC.
See Fig. 3, here: https://www.princetonpolicy.com/ppa-blog/2018/12/12/italy-oil-euro-and-populism. Menzie’s Fig. 1 above clearly shows this tension, with US consumers struggling to maintain their driving habits from 2005 through 2014.
This 2007 – 2014 stretch can thus reasonably be described as the China Depression, because the main, tangible achievement of this entire period was moving oil consumption from the OECD to China and other emerging economies in Asia and to commodity suppliers in various parts of the globe, eg, Brazil and Australia.
I would note that on Menzie’s Fig 1., 2011 does indeed present as a recession, just as I have been suggesting. I would also note that these continuing pressures also affected Europe, which went into a nasty recession from Q3 2011 to Q1 2013, consistent with Fig. 1 above.
Note that the pressure ends completely and abruptly after 2014. As we all know, that’s when oil prices cratered, that is, US shale oil growth was sufficient to ensure that both China and the OECD had enough oil to grow. Drill, baby, drill was not only successful, but actually necessary to end the China Depression.
After that, we see some end-of-cycle pressures manifesting in 2019. I think we discussed the topic here at the time, but I have nothing to add to the discussion, other than that we may have entered a recession in 2020 regardless of the pandemic. But that’s counter-factual speculation, not analysis.
We again see VMT plummeting in 2020 with the pandemic. This time, though, it is neither a demand nor supply shock. Oil prices collapsed at the time. So this manifestation is fundamentally different from any other positive indicator on Fig. 1. It is not a recession and certainly not a depression. Rather, it was a suppression, people were prevented from using their cars due to lockdowns or fear of covid. Therefore, interpreting the event as a supply shock per 1974, 1979, or 1981 would be incorrect. Similarly, interpreting it as a demand shock per 2005-2014 or some subsegment thereof would also be incorrect. This was the Fed’s and administration’s fundamental mistake: they thought 2020 was 2008, but it wasn’t. Not even close.
Finally, let’s turn to 2022. This does not show up at all on Fig. 1. This may be as a result of model specification. It may also result from a commingling of trends from pandemic recovery and high oil prices. That is, a 12 mms analysis will still be catching the dynamics of the H2 2021 oil demand recovery, so the data will be muddied.
Nevertheless, the historical track record makes clear that 2022 will indeed develop into an event like either 2011, in the better case, or 1974 or 1979 in the worse case. The last month’s gasoline and distillate supplied numbers, as well as the leading edge of the VMT data, make that clear.
I think the 1970s will prove the template. The economy is going down. The recession is either already in progress or will be soon upon us, as an updated Fig. 1 with Q3 data while likely show, I believe.
You spend a lot of time on the periods where it was Volcker’s monetary policy that led to the double dip recession. To call this an oil shock is beyond dumb and bordering on blatant dishonesty.
The whole period was a recession in Europe. The point, I think, is that you cannot stimulate your way out of a supply-side oil shock. You have to adjust consumption to the pro rata level of oil available. If you try to stimulate the economy to support aggregate demand, you’re going to get stagflation. That’s my take.
Europe was in recession but weren’t we talking about the US economy? Now had Germany allowed the rest of the EU to adopt fiscal stimulus. then they could have seen better outcomes.
A quick addendum on false positives.
If one uses 12 month moving sums, the small false positives disappear in 1977 and the 1990s.
Steven Kopits: I don’t know what software you’re using, but I’m calculating using 12 month moving averages, which is going to (in first differences) look like 12 month moving sums. Look at the algebra.
Kopits has talked about his “model” many times. Fascinating (though maybe not 100% incriminating) he’s never shared what econometrics/statistics package he’s using. I guess he hinted at Excel a couple times. Outside of that…….
He did share some sort of Excel file over at this blog. I made the mistake of looking at it – a total train wreck.
No worries. I don’t think it changes the message much. I really like the approach, though. Very X-Ray like.
Steven Kopits: The fact that it gives tons of false positives doesn’t change the message much? Are you serious?
Stevie is known to make stuff as he goes so hey!
If you use 12 mms minus 12 mms from prior month, the scratchy lines go away. The only anomaly you’re left with is either November or December 2019.
VMT depends on a number of factors. For example, blizzards or hurricanes can move an individual month around. Therefore, we might expect some outliers here and there. If you work with the data regularly, I don’t think you’re going to get too worked up about it.
On the other hand, I think your analytics really reflect the dynamics of the historical record, and I think your model strongly suggests that we are seeing a Q1 downturn for VMT coincident with a recession which the NBER will eventually determine to have started in Q1 2022, if the Atlanta Fed and IHS Q2 numbers hold up.
the use of a 12 month moving average during a year of high volatility is probably not a good model to use. large moves up and down can cancel one another out. further, large moves early in the series can bias the results when comparing to moves later in the series. probably why you get so many false positives since 2005, during volatile years. perhaps an error squared term would be better? i understand the need for a 12 month average for seasonal effects. however, are recessions seasonal? if not, then the model cannot discriminate between recession and high volatility?
“If you use 12 mms minus 12 mms from prior month, the scratchy lines go away.”
Princeton Steve has gone from fishing to deep sea fishing. I guess if he data mines enough – he will get invited back on Fox and Friends to discuss his results. MAGA!