Some people point to initial claims for unemployment insurance.
Atkinson and Wei today point out seasonal adjustment issues are probably behind the apparent rise in seasonally adjusted initial claims. Looking at 3 year changes:
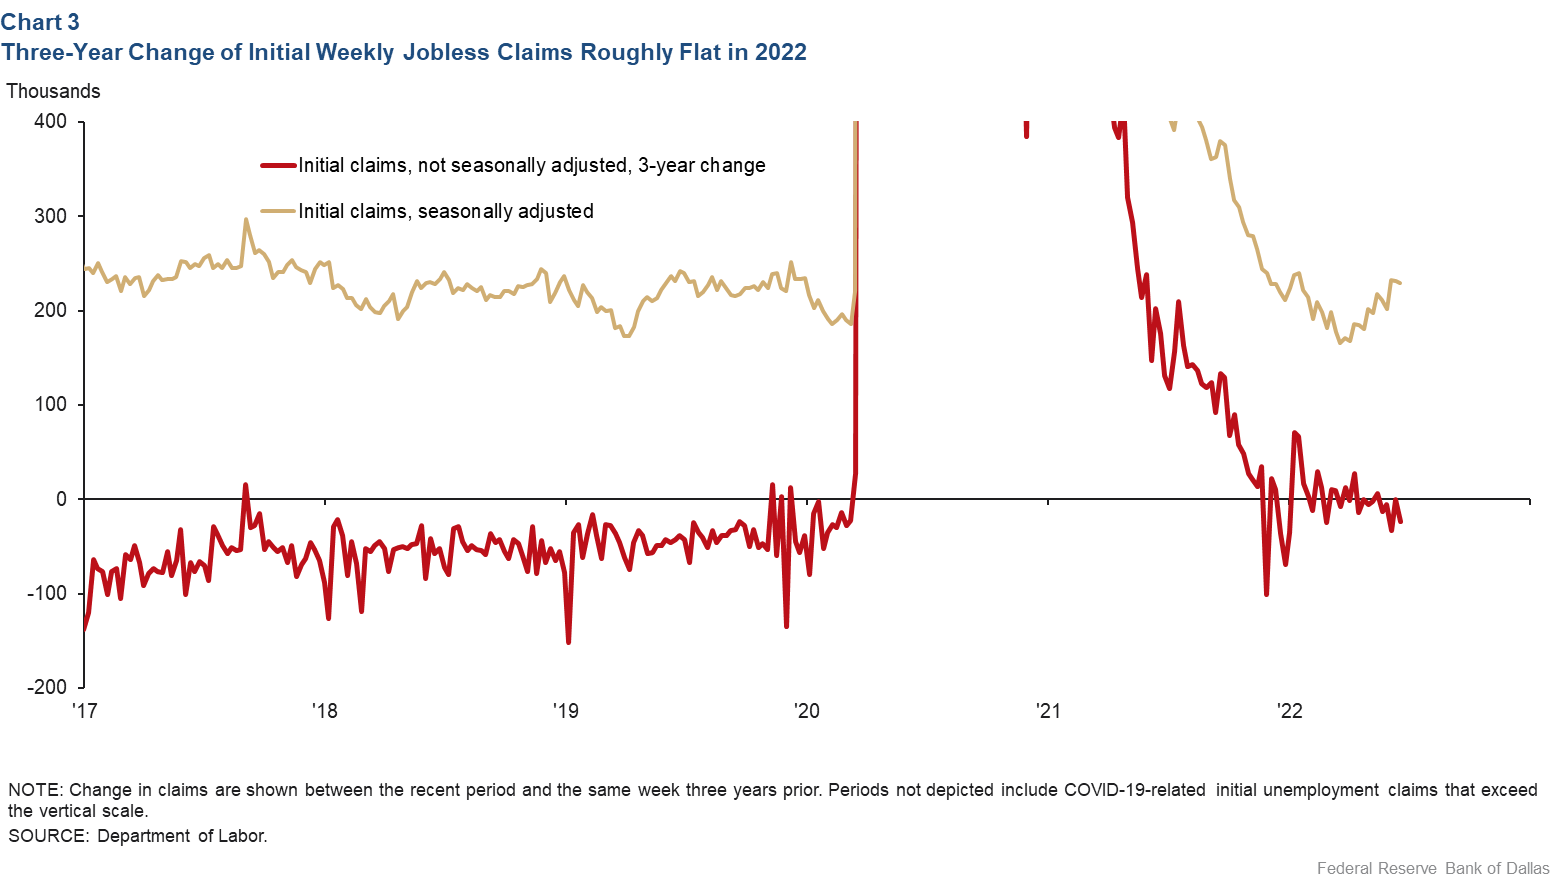
Source: Atkinson and Wei (2022).
As for the argument that vehicle miles traveled are indicating a recession:
VMT says US entered recession in the Jan-Apr time frame.
…vehicle miles traveled, which is either very short term leading (ie, failing one month or so prior to the official onset of recession), coincident, or lagging by up to 4-5 months if one is using, say, 12 month moving sums.
Here is a picture which casts some doubt on this proposition.
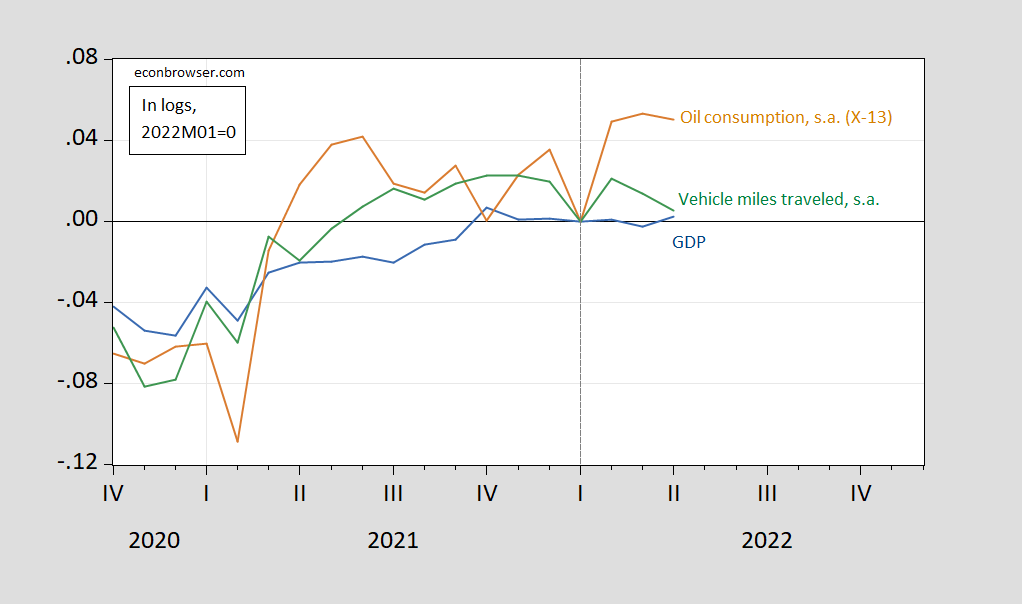
Figure 1: Monthly GDP (blue), oil consumption, s.a. (tan), and vehicle miles traveled, s.a. (green), all in logs, 2022M01=0. Oil consumption seasonally adjusted by author using X-13, log transformation. Source: IHS-Markit, DOE EIA STEO, DOT FHA via FRED, and author’s calculations.
Bill McBride at Calculated Risk does not see the economy currently in recession (although he’s thinking about one in 2023).
https://fred.stlouisfed.org/graph/?g=z21W
January 15, 2018
Shares of Gross Domestic Product for Private Fixed Nonresidential & Residential Investment Spending, Government Consumption & Gross Investment and Exports of Goods & Services, 2017-2022
https://fred.stlouisfed.org/graph/?g=z21I
January 15, 2018
Shares of Gross Domestic Product for Private Fixed Nonresidential & Residential Investment Spending, Government Consumption & Gross Investment and Exports of Goods & Services, 2017-2022
(Indexed to 2017)
[ The little model I use suggests to me that a recession is not here, and if a recession comes a faltering in housing will bring it on, and that means looking to 2023. Just as Paul Krugman in August 2006 looked to December 2007 as a possible recession start as housing faltered. ]
Relatedly, about the Chinese real estate or home buying market, China changed the nature of home buying in 2021 from possibly living in and speculation to simply living in. Homes are to be meant for living in, not buying for speculation, so purchases are meant for residency. This policy immediately limited price increases in real estate, with increases meant just to keep up with building costs and general inflation. So housing in China is no longer “hot,” and that is as intended. However, China has already begun a 33 point program to spur growth and planners currently think the 5.5% objective for GDP “quality” growth will be met.
https://news.cgtn.com/news/2022-06-28/China-can-handle-unexpected-risks-to-achieve-2022-GDP-growth-target-1beoaQDJc3e/index.html
June 28, 2022
China can reach 2022 GDP growth target despite unexpected risks: official
China can cope with unexpected risks this year to achieve its GDP growth target of around 5.5 percent, a senior official of the National Development and Reform Commission (NDRC) told a press conference on Tuesday.
Since March, the COVID-19 pandemic outbreaks and the Ukraine crisis have added risks and challenges to China’s economic growth, with increasing uncertainty regarding employment and inflation, acknowledged Ou Hong, deputy secretary general of the NDRC, the country’s economic planning agency.
However, the Chinese economy is resilient and has ample potential, he said, and the country “is fully confident of overcoming the difficult challenges in economic operation” to “ensure stable, healthy and sustainable economic development.”
The government will implement existing supportive measures, while improving its policy toolbox, which can be rolled out promptly depending on the circumstances, he said….
China reveals policy package to stabilize economy *
* https://news.cgtn.com/news/2022-05-31/China-reveals-policy-package-to-stabilize-economy-1atMrjMz5ni/index.html
Initial Unemployment Claims Appear Stable over Past Several Months by Tyler Atkinson and Victor Wei (June 28, 2022) is indeed an excellent discussion rebutting the latest spin from Stevie. We asked him to read it but it seems he was too busy fishing for some other way to spin his nonsense.
Bill McBride at Calculated Risk does not see the economy currently in recession
As usual McBride provides an insightful detailed analysis with no partisan spin. Princeton Steve claims to respect McBride but funny thing – Stevie’s rants are just the opposite of what McBride provides.
McBride is one of the components of my completely non-technical magic dowsing stick that tells me if we are in a recession or nearing one. He’s pretty cautious, and his blog reports that first quarter growth was revised down to negative 1.6%. One bad quarter doesn’t make a recession, especially after the blistering growth we have had since the beginning of 2021.
I am seeing a whole lot more traffic around here, which means people are reemerging. I can see how fuel prices would put a damper on things, but that doesn’t seem to be happening. At least not in and around Seattle. The endless pestering from real estate clowns is increasing, if anything. That does not indicate a bust just yet. Perhaps a bubble in the making, but I doubt it.
I just flat don’t see a recession in the cards yet. My usual indicator that says a recession is in progress when economists deny that we are in recession isn’t working this time, so far as I can tell.
we just concluded a trip to florida. i saw no signs of recession based on that trip. if fact, there are too many people out and about. if a recession were to occur, it will probably be caused by another covid variant that dodges past infection or vaccines in a more deadly manner. travelers and vacationers are very robust right now.
While I appreciate the “discipline” which Atkinson and Wei applied to the data, unless it applied consistently to all periods, it is problematic.
Using a much simpler K.IS.S. Method back in late 2018 with regard to a nearly identical rise to what we’ve had in the last 3 months, here is what I found, using data going back 50+ years:
there is almost always one or two periods a year where the four week moving average of jobless claims rises between 5% and 10%. About once every other year for the past 50+ years, it rises over 10%. Typically (not always!) it has risen by 15% or more over its low before a recession has begun. And a longer term moving average of initial claims YoY has, with one exception, turned higher before a recession has begun.
The current situation fulfills the first criteria (up about 25% from their March low), but not the second (down YoY almost 50%!).
Initial jobless claims are not signaling a recession at present.
On your graph, GDP hardly seems to have declined in Q1. Today’s revised number is -1.6%. How is that represented on your graph, or do you prefer IHS to BEA?
Are you now accusing our host of misrepresenting the data? Look – we know you do that all the time. Dr. Chinn does not.
Menzie can take that question.
Steven Kopits: I wanted to use EIA provided seasonally adjusted data. I have nsa data to 1970.
If you run 12 month sums, it shouldn’t matter whether you use NSA or SA, should it?
If you stick with SA, you’re left with a very small sample. That is, 2001, which we both agree with not an oil shock recession, substantively; 2008, which was an oil shock, among others; 2020, which was not an oil shock, but rather a suppression, so the correlation is not directly causal; and today, when we don’t really know if VMT is down cyclically yet. So you don’t have much of a sample set.
Take it back to 1970, and you’ll see the turns are pretty clear. We can quibble about 1981 if you like, which would take us into a rather technical discussion about calculating elasticities. But by and large, VMT on a 12 mms basis turns a bit before or right at the start of a recession. You can see that turn in the peach shaded zone on the far right of the graph I linked, but I don’t know that there’s enough data there to make me certain that the cup I am drinking from doesn’t contain iocane powder.
http://www.prienga.com/blog/2022/6/29/vehicle-miles-traveled-and-us-recessions
He explained his choice. Something you never do. So your point was what? That you are a jerk as well as a dumb troll? Got it!
As for McBride. His views are always worth taking seriously, and he may well be right. He has been in the past. On the other hand, he leans pretty heavily on the 3.1% personal consumption number for Q2, which was revised down to 1.8% in this latest release.
https://www.bea.gov/sites/default/files/2022-06/gdp1q22_3rd.pdf
I wonder why you did not include a link to the BEA data. I have. Oh wait – there was a strong increase in fixed investment during Q1. So consumption was up a bit and investment was up a lot.
Yea – it sure looks like a recession to anyone who cherry picks the data to mislead.
Also noted in my link to the BEA latest Q1 release, Gross Domestic Income rose by more than GDP fell. So when Dr. Chinn averages the two measures to get Gross Domestic Output, it rose slightly in Q1.
We had a recent post on this. But does Princeton Steve note these things. Of course not as he is not even trying to be honest.
…3.1 for Q1…
Gasoline and distillate consumption with today’s EIA data. Looks bad.
http://www.prienga.com/blog/2022/6/29/is-the-us-economy-cratering
Way to cite your data sources! Oh wait. Let’s see – relative price increases reduce the quantity demand for a product. Stop the presses – a new economic discovery!
…today’s EIA data…
Since the graphs have weekly data, it must be the EIA’s weekly source, which is the Weekly Petroleum Status Report
You can find it here. https://www.eia.gov/petroleum/supply/weekly/
The data I use comes from table labelled the “U.S. Petroleum Balance Sheet”. Click on the xls icon for the spreadsheet.