Nonfarm payroll employment in September was slightly above consensus (263K vs 250K), showing continued growth. This is the picture of key macro indicators followed by the NBER Business Cycle Dating Committee, plus IHS-Markit monthly GDP.
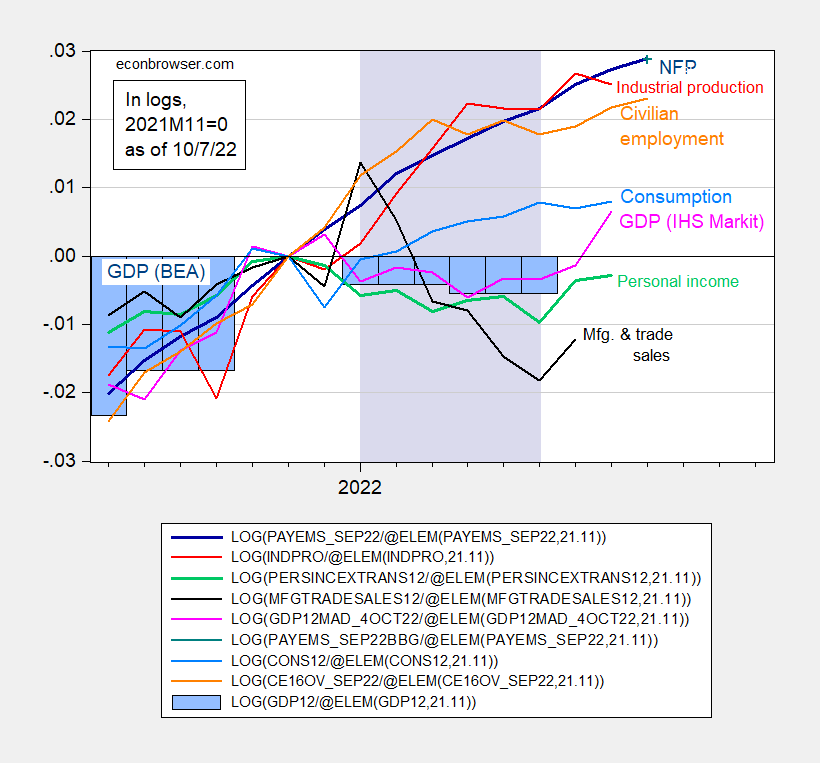
Figure 1: Nonfarm payroll employment (dark blue), Bloomberg consensus as of 10/4 for NFP (blue +), civilian employment (orange), industrial production (red), personal income excluding transfers in Ch.2012$ (green), manufacturing and trade sales in Ch.2012$ (black), consumption in Ch.2012$ (light blue), and monthly GDP in Ch.2012$ (pink), official GDP (blue bars), all log normalized to 2021M11=0. Lilac shading denotes dates associated with a hypothetical recession in H1. Source: BLS, Federal Reserve, BEA, via FRED, IHS Markit (nee Macroeconomic Advisers) (10/4/2022 release), and author’s calculations.
Among these, employment and personal income ex-current transfers are central. Hence, the employment report is noteworthy in its (continued) strength.
The prelminary benchmark revision indicates that the labor market has been stronger than the official NFP series indicates. In Figure 2, I show the official series (blue), the implied benchmark revised series (light blue), and the civilian employment series from the Current Population Survey, adjusted to the nonfarm payroll concept (red).
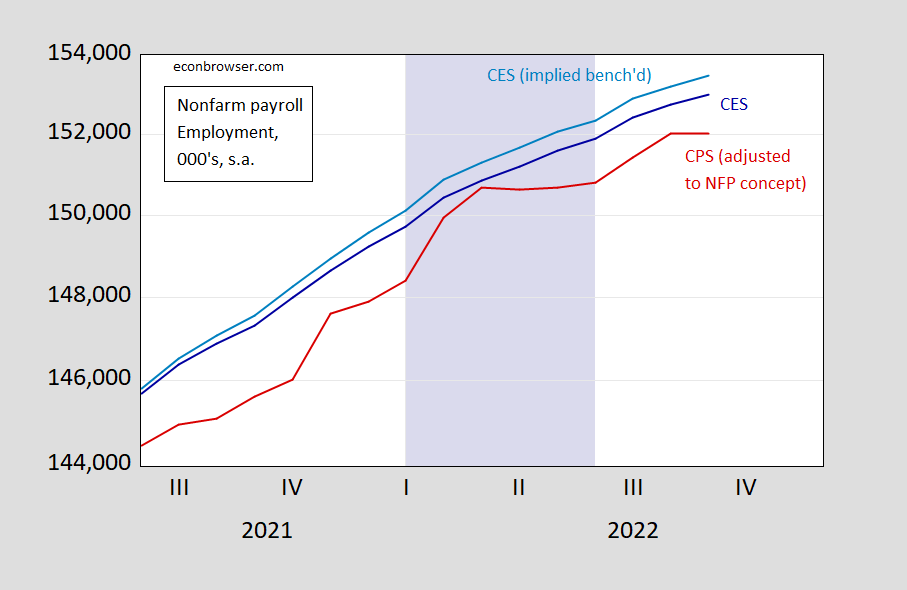
Figure 1: Nonfarm payroll employment (dark blue), implied series incorporating preliminary benchmark revision (light blue), civilian employment adjusted to nonfarm payroll concept (red), in 000’s, s.a., all on log scale. Lilac shading denotes dates associated with a hypothetical recession in H1. Source: BLS, and author’s calculations.
Note the continued growth in the labor series even during the slowdown in GDP during H1, which some observers have tagged as a recessionary period.
https://www.nytimes.com/2022/10/07/opinion/jolts-jobs-report-inflation-economy.html
October 7, 2022
Wonking out: A Jobs Survey Full of Good News
By Paul Krugman
For as long as I’ve been paying attention to economic news, pundits and investors have waited anxiously for the monthly report by the Bureau of Labor Statistics on the employment situation. That’s still true, and there was some important news in today’s report. More on that later.
But another report from the bureau, which came out on Tuesday, was a real eye-opener. It was, in particular, the best news about inflation we’ve seen in a long time — even though it never mentioned inflation.
JOLTS — the Job Offerings and Labor Turnover Survey — tracks, um, job offerings and labor turnover. That is, it asks employers how many unfilled positions they have, how many workers have quit or been fired and so on. It may seem obvious that this information is useful, but these days many economists believe that it’s even more so.
Some background: Standard macroeconomics relies a lot on an updated version of the Phillips curve. The original version of that theory asserted (based on historical evidence) that there was a downward-sloping relationship between unemployment and inflation: The higher the unemployment rate, the lower the inflation rate, all else being equal. Since the 1970s, almost everyone has assumed that expectations of inflation also play a big role. If the public expects a lot of inflation, as it did at the end of the 1970s, this will push up actual inflation for any given rate of unemployment.
So what explains the recent surge in inflation? The mystery is that while unemployment is low, it’s roughly the same as it was on the eve of the pandemic, yet inflation is much higher. This is true even if you focus on “core” inflation, which excludes volatile food and energy prices:
https://static01.nyt.com/images/2022/10/07/opinion/krugman071022_1/krugman071022_1-articleLarge.png
An ugly picture: the relationship between core inflation and the unemployment rate at points over the past 15 years.
Are we having a ’70s-type problem, with inflation driven by self-fulfilling expectations? Well, we have a lot of direct evidence on expected inflation, from both surveys and financial markets — and it isn’t especially high. Everyone seems to expect that the Federal Reserve will get inflation down, and fairly soon. So expectations aren’t the story….
A really excellent read. Some reason for hope for a less-than-hard landing.
https://www.nytimes.com/2022/10/07/business/binance-hack.html
October 7, 2022
Binance Blockchain Hit by $570 Million Hack, Exposing Crypto Vulnerabilities
The world’s biggest cryptocurrency exchange confirmed that assets were stolen from the Binance Smart Chain network, the latest in a series of attacks on so-called cross-chain bridges.
By Ephrat Livni
https://www.nytimes.com/2022/09/28/technology/crypto-hacks-defi.html
September 28, 2022
The Crypto World Is on Edge After a String of Hacks
More than $2 billion in digital currency has been stolen in hacks this year, shaking faith in the experimental field of decentralized finance, known as DeFi.
By David Yaffe-Bellany
[ Does such loss matter, and if so where is regulation of the exchanges by the Federal Reserve? ]
The performance of income relative to inflation has gotten a lot of attention in the post-recession period. Increased variability in both has clouded debate.
Today’s jobs data allow us to clarify one point – the performance of non-supervisory hourly employees’ paychecks after correcting for i flation. Here’s a comparison of monthly changes in the payroll index to monthly changes in CPI:
https://fred.stlouisfed.org/graph/?g=Uyx0
The payroll Index is a measure of weekly paychecks for non-supervisory hourly workers. In July and August, the index rose faster than CPI, and if CPI estimates for September (https://www.clevelandfed.org/en/our-research/indicators-and-data/inflation-nowcasting.aspx) are close to the mark, hourly workers’ paychecks have risen faster than inflation for the past three months and for 8 of the last 12 months.
In fact, paychecks for hourly workers have caught up to CPI, erasing all of the real losses suffered due to the recession:
https://fred.stlouisfed.org/graph/?g=Uyxw
By the way, it is not the case that average weekly earnings for all workers have kept pace with inflation. Weekly earnings of those higher up the pay-scale have apparently not kept pace with inflation. At least, that’s how I interpret the difference between the weekly-payroll-vs-CPI chart and this one:
https://fred.stlouisfed.org/graph/?g=UyzR
Hourly supervisory workers and salaried workers seem to be losing ground. They were not laid off in proportion to layoffs of lower-wage workers during the recession, so had less roomfor improvement.
AS I noted earlier, the labor force participation rate seems to be stuck between 62.3% and 62.4%. Now we can have more employment growth (in spite of RonJon’s incoherent babbling) if we can get more of the population to get past COVID issues and get back to work. Higher real wages would help.
Of course anyone state can see higher employment if they can find jobs for people out of state to take – as in labor mobility. A concept that eludes Princeton Steve.
Off topic, liquidity again –
The IMF Blog has published a recap of an issue raised in the Fund’s latest Global Financial Stability Report – the issue being the liquidity risks presented by open-ended funds :
https://www.imf.org/en/Blogs/Articles/2022/10/04/how-illiquid-open-end-funds-can-amplify-shocks-and-destabilize-asset-prices
This is not an alarm-bell going off, not like the UK’s recent experience. Everybody in the business knows this one, but it’s still a big issue. Open-ended funds are attractive to investors because of the liquidity they offer – you can redeem holdings anytime you want. That’s why open-ended have grown to the point that they now hold around $41 trillion in assets.
The problem is that greater liquidity for investors means greater systemic risk. Open-ended funds offer liquidity by taking liquidity risk onto their own books. There is not a net increase in market liquidity, just a transfer of risk. I won’t go into the mechanism; the IMF Blog and the Stability Report do that in detail.
I will make a coup!e of points, though. First, fund investors (retail) are often slow to redeem relative to other buy-side accounts. They tend to be driven more by losses than by changes in fundamentals. That means they redeem in markets already under pressure. When they redeem, though, they tend to swing big. When you see “capitulation” in market commentary, it often means big redemptions by retail investors – heavy selling into a falling market. All of which is to say, these guys don’t start a market drop, but they are the ones who turn it into a plunge which induces downside overshoot and requires intervention. Open-ended funds are just one of the channels through which this can happen.
The second point is that the IMF proposes a solution in the form of an increase in redemption fees. This is similar to a financial transaction tax, but with some crucial differences. For one, the fund manager collects the fee, not the fiscus. It’s not clear to me how that is a pareto improvement. Looks more like a bribe.
Another difference is that in some forms, the redemption fee kicks in only in down markets. There is no effort to discourage bubbles by raising the cost of speculation. There is only an effort to deny retail investors liquidity that hot-money investors already enjoyed while kicking off market downturns.
So this fee idea is one-sided twice over, punishing redemption but not speculation, and denying liquidity to open-ended fund investors, but not to the fast-money crowd. A financial transaction tax is not one-sided in either of these ways.