With the release of December 2022 consumption and personal income, and November real manufacturing and trade industry sales, plus Q4 GDP, we have the following picture of business cycle indicators followed by the NBER Business Cycle Dating Committee, along with IHS Markit monthly GDP:
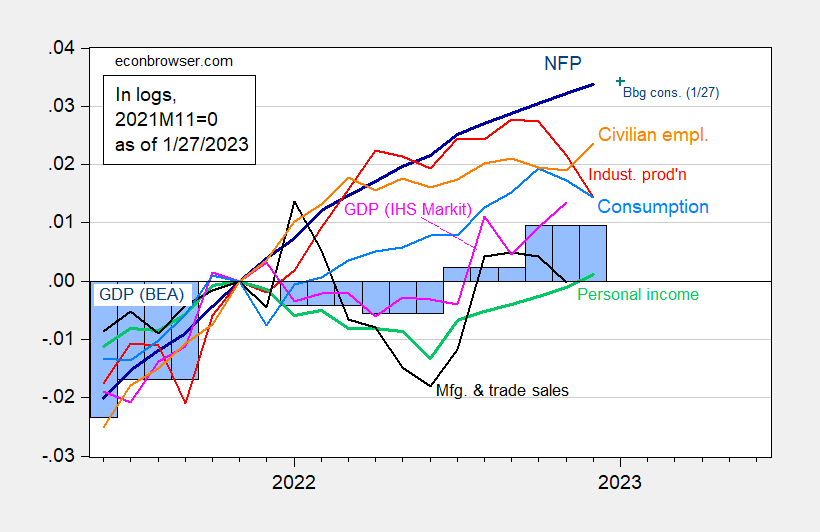
Figure 1: Nonfarm payroll employment, NFP (dark blue), Bloomberg consensus as of 1/27 (blue +), civilian employment (orange), industrial production (red), personal income excluding transfers in Ch.2012$ (green), manufacturing and trade sales in Ch.2012$ (black), consumption in Ch.2012$ (light blue), and monthly GDP in Ch.2012$ (pink), GDP (blue bars), all log normalized to 2021M11=0. Q3 Source: BLS, Federal Reserve, BEA, via FRED, IHS Markit (nee Macroeconomic Advisers) (1/3/2023 release), Bloomberg (as of 1/27) and author’s calculations.
While GDP grew at 2.9% Q/Q SAAR in quarter 4, exceeding Bloomberg consensus (2.6%) (see Jim’s post), the increase in inventories points to a drawback in 2023Q1. Along with the slowdown in consumption, and weaker exports in December (not shown), we have a definite slowdown in Q1 nowcasts/tracking estimates.
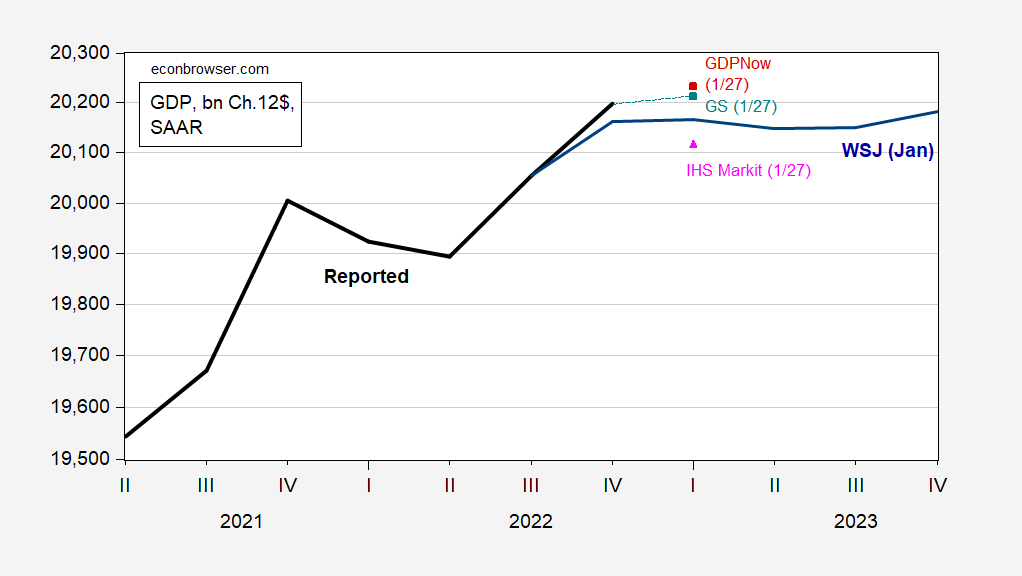
Figure 2: GDP (bold black), WSJ December survey mean (dark blue), GDPNow (red square), Goldman Sachs (teal square), IHS Markit/S&P Global (pink triangle), all in bn. Ch.2012$ SAAR. Source: BEA 2022Q4 advance, WSJ, Atlanta Fed (1/27), Goldman Sachs (1/27), and IHS Markit (1/27), and author’s calculations.
IHS Markit tracking indicates 1.6% decline in Q1 (Q/Q SAAR).
Yea – I am worried we may see a decline in real GDP which is why I would hope the FED would lower interest rates.
But funny thing – the RECESSION CHEERLEADERS have either gone silent after the November election or have turned into people who would suggest the FED tightening is going to have no impact on aggregate demand. Little Jonny for example is now suggesting the FED has no power to affect aggregate demand. His economic reasoning you ask? You do know Jonny boy never ever understood basic economics so sorry I have no answer to that question.
Worry wart.
Everything I look at – commodities, equities, bonds – is trending positive.
And employment is very close to full.
As Consumption expenditures are about 60 to 70 percent of GDP, the fall-off in Consumption bodes ill for growth in the first part of 2023.
Retail sales and growing inventories are signs of Consumption being deferred.
And the return to parental homes has lowered pressure on housing.
Some local housing markets are robust. Is this because of a government wringing its hands? Or is it because houses are not movable?
Our Polish friend has it right.
Two of the “big 4” coincident indicators most relied upon by the NBER in dating recessions – industrial production and real manufacturing and trade sales – appear to have rolled over. I suspect real income less transfer payments will have a rougher slog next month in the face of gas prices going up $.40. Two of them – real manufacturing and trade sales and real personal income less transfer payments – are also flat YoY, which typically is also a marker of recession.
That leaves jobs. By now you are probably already aware that the BLS’s “Business Employment Dynamics Survey” for Q2 2022, which uses the comprehensive QCEW data longitudinally to track individual firms’ hiring and firing over time, and which is seasonally adjusted, showed and actual *loss* of 287,000 jobs in that quarter. Not worth arguing about, because we’ll see in a week what the revisions to the Establishment Survey will be for 2022, but definitely a suggestion that job creation has been weaker than we have thought it was.
No it doesn’t. QCEW showed a huge overshoot in 2021 no other guidance showed. My guess its revised down in 2021 and revised up in 2022.
Your real estate is expanding debt again which is being seen in equities. You can’t have it both ways New Deal.
Real PCE on services was flat in December, I was a bit surprised by that. Clearly the economy lost momentum going into Q1. Pay attention to change in inventories, it may be a substantial drag on growth. I wouldn’t be surprised to see below zero print for real GDP in Q1. All eyes ob labor market report for January.
“Real PCE on services was flat in December”. Yep and real PCE on goods have been falling since October.
Georgetown Jerome has never met an unbroken Christmas toy he can’t “fix”. Nothing nears the fun for Jerome in killing off American jobs in the name of fixing supply chain problems. If Jerome was a superhero his suit’s chest emblem would read “JD F-Up”.
Except this is wrong. Real services grew in December, but was back loaded into January. Real Goods surged in January as well due to the backload. Goods can be misleading because of price cut effect which takes time.
Was the nominal PCE services read also flat in December?
There was a good column in today’s WSJ by Justin Lahart, “GDP Doesn’t Tell Economy’s Full Story”.
He mentions that Real Final Sales to Private Domestic Purchasers, FRED series, LB0000031Q020SBEA, increased only by 0.2% Compounded Annual Rate of Change. The category “excludes the effects of inventory swings, trade and government spending…”
https://fred.stlouisfed.org/graph/fredgraph.png?g=ZiKa
AS: Yes, this is the series that Jason Furman stresses.
One of the blog’s better commenters shines again. Nice find, and thanks for sharing.
Moses,
Thanks for the kind thoughts. Below is another chart that may be of interest.
The ratio of Real Final Sales to Private Domestic Purchasers / Real GDP has had increased from about 0.68 as of 1952Q1 to about 0.88 as of 2022Q4.
https://fred.stlouisfed.org/graph/fredgraph.png?g=ZkxQ
Am I reading that right??~~ that that implies average consumption per capita has gone down since about 2012?? It seems I am reading it in an incorrect way or something.
Moses,
Dividing Fred series, LB0000031Q020SBEA x10^9 by Fred series, POPTHM x 10^3, assuming my calculations are correct, I show per capita Real Final Sales to Private Domestic Purchasers of $47,499 for 2017Q1 and $53,064 for 2022Q4. I assume that per capita amounts may not tell the whole story, since I assume that business purchases are in the definition of final sales to private domestic purchasers as described by the BEA below.
Final sales to private domestic purchasers is defined as, “final sales to domestic purchasers less government consumption expenditures and gross investment.” See Table 1.4.3. Real Gross Domestic Product, Real Gross Domestic Purchases, and Real Final Sales to Domestic Purchasers, Quantity Indexes.
BEA Interactive Data Application
https://apps.bea.gov/iTable/?reqid=19&step=2&isuri=1&categories=survey#eyJhcHBpZCI6MTksInN0ZXBzIjpbMSwyLDNdLCJkYXRhIjpbWyJjYXRlZ29yaWVzIiwiU3VydmV5Il0sWyJOSVBBX1RhYmxlX0xpc3QiLCIyNyJdXX0=
@ AS
Thank you for that, it helps to a degree.
I wish I could find a “deeper” or more explanative (geared for 10-year olds like Uncle Moses) definition to “final domestic sales to domestic purchasers” because it seems like a relatively simple concept but for some reason I’m having a hard time wrapping my head around it. I wonder if it would be buried in one of those BEA budget book things??
Moses Herzog: Take out intermediate goods. Sales of goods and services to domestic households and domestic firms (so inventories are excluded).
I am like one of those guys newly recruited to the Army. I have to have things spelled out for me sometimes. For some reason this explanation hit me as a little better than the BEA’s, although I am sure it is the same definition, this more “wordy” definition helped this new Army recruit (in the brains dept) get the idea:
https://numbernomics.com/final-sales-to-domestic-purchasers-2/
Unless there is some other factor escaping me, I guess my comment to “AS” should have said, “as it compares as a ratio of GDP, it appears consumption has lowered since roughly 2012”, which again strikes me as very “off”. I mean the fact the blue line in the FRED graph dropping below the red line strikes me as very strange, since for decades the blue line was above the red line—is that as “strange” or “odd” as I am perceiving it (as in very peculiar??
I know the FRED numbers are correct, but I am wondering what factor made the blue line stay below the red line after 2012??
Moses,
Maybe using log scale for both Final Sales to Private Domestic Purchasers and Real GDP may help.
Some of the problem with the first chart presented may be scaling on the ratio of Final Sales to Private Domestic Purchasers to Real GDP.
https://fred.stlouisfed.org/graph/fredgraph.png?g=Zn5v
Your log scale version certainly makes more logic in my head, that the blue would stay below the red. I mean that the relationship between the two would stay relatively constant.
Maybe that’s obvious to econometricians or statisticians, that because the left margin and right margin of the graph are measuring different things, in different units, the lines wouldn’t necessarily “jive” together over time. But to my wanna-be-economist’s eyes it seemed strange in the first graph how the blue line dipped down in reference to the red in the first graph after the blue had been above the red for decades.
Anyone into nostalgia, they had a story on washboards in the same day’s WSJ. I saw people still using washboards when I was in China in a rural area in a river. Wouldn’t be surprised if in the countryside it was still the case, though assumably less.
Now…… if you have some white trash relatives (like some people’s maternal side of the family whose name we won’t mention, in order to protect the innocent) you may have heard them say “worshboards”. Just like you may have heard wrestling referred to as ‘raslin. That’s the end of today’s edition of “Masochistic Self-shame Comment”. Don’t forget to throw some coins in the tin pan on your way out.
Sorry New Deal, December data sucks. Its a lie. Most of the decline was because of a midmonth shut down in production and consumption related to a overly long Christmas break. Something that has been happening more and more lately. It was a bogus report, one reversed notably in January and we will have excessive “sales days”. Whirlpool LTD, not one of my favorite manufacturers, but the example is that. They only went 3 weeks after Thanksgiving with a extra hour thrown in. This cost December production and they were behind production by January a bit. So the extra hour stayed which will boost January output. Why these midmonth shutdowns are happening now, I have no clue. 2018 had one as well. So did 2021(which was understandable). Maybe 2018 was related to the Government shutdown, but 2022 was a blunder. A big one. IMO, the recession elites expected didn’t happen and now they are gonna be forced to produce and indeed, it will surge GDP, which will be boosted already by Trade. If they want to make money, you produce more and sell for cheaper ala since the 90’s.
Gonna be some hard lessons learned.
Lets note Auto sales dropped in December by choice, not by demand. They wanted to save inventory and indeed, many dealers shut down on the 16th. Now this will have to catchup. A total big reason why real pce dropped and goods pce dropped. You got a bunch of chips now go to a extended overtime schedule and make cars, sell at a cheaper price to make money. Its simple as that. No wonder Biden was putting a weed up commands ass. A bunch of elitist clowns who despise the people they sell too.
Where’s our obligatory comment on inventory restocking?? Where’s that confounded bridge!!!! I guess Menzie touched on it above. That’s like a swaying indicator Q to Q is it not?? It’s almost like a pendulum factor on growth.
Per BLS, CPI (all items) rose similarly in 2021 (7.0%) and in 2022 (6.5%).
See:
https://www.bls.gov/opub/ted/2022/consumer-price-index-2021-in-review.htm
and
https://www.bls.gov/opub/ted/2023/consumer-price-index-2022-in-review.htm
With that in mind, I’m puzzled why you routinely have an event marker for the Russian invasion in FEB22. When the series is actually rather similar before and after.
Also, I wonder if Scott Walker had gotten elected president in 2020, if we’d have a different event marker. 😉
@ Anon
I’m not saying I agree with Professor Chinn, Or I am even correct in guessing his thoughts here. But there are those out there (that would include myself) who believe the invasion did effect inflation. Menzie may be putting the marker there, in essence, to say “See folks, this didn’t effect inflation as much as you think”
a lot of the ‘effects’ are the us’ response to russian activities
Overall inflation was 4.7% by basic metrics in 2021. So no, your wrong. FIrst half of 2022 was definitely inflated by the Russian stuff.
I keep wondering how much of the drop in December sales (Can we pick that up looking at the last 10 years time??) is just Christmas internet sales being made in earlier months?? i.e. does anyone know or do we have any measures of earlier than in years past (say 1990–2000) internet Christmas sales creating a “misleading hole” in the December numbers?? Surely there’s some gauge for this??