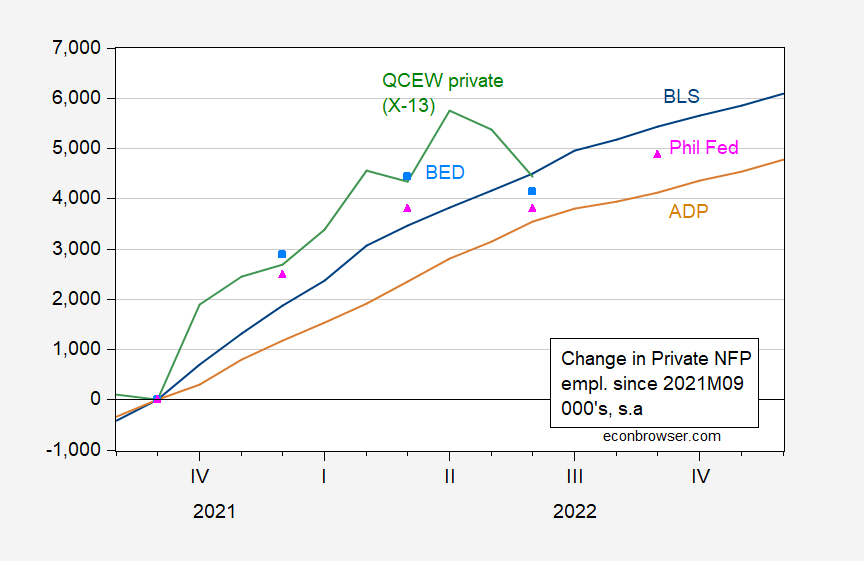
Various observers have argued private employment stagnated in Q2 and after (see debate here), perhaps signalling a recession in Q2. With Wednesday’s Business Employment Dynamics release, we have the following measures of cumulative changes since 2021M09:
Figure 1: Cumulative change in private nonfarm payroll employment, from BLS CES (blue), from ADP (tan), from Quarterly Census of Employment and Wages covered employment (green), from Business Employment Dynamics (sky blue square), from Philadelphia Fed preliminary benchmark (pink triangle), all in 000’s, s.a. QCEW employment adjusted using Census X-13, log transformation. Philadelphia Fed private NFP calculated using Philadelphia Fed NFP estimate minus actual government employment. Source; BLS, ADP via FRED, BLS QCEW, BLS BED, Philadelphia Fed, and author’s calculations.
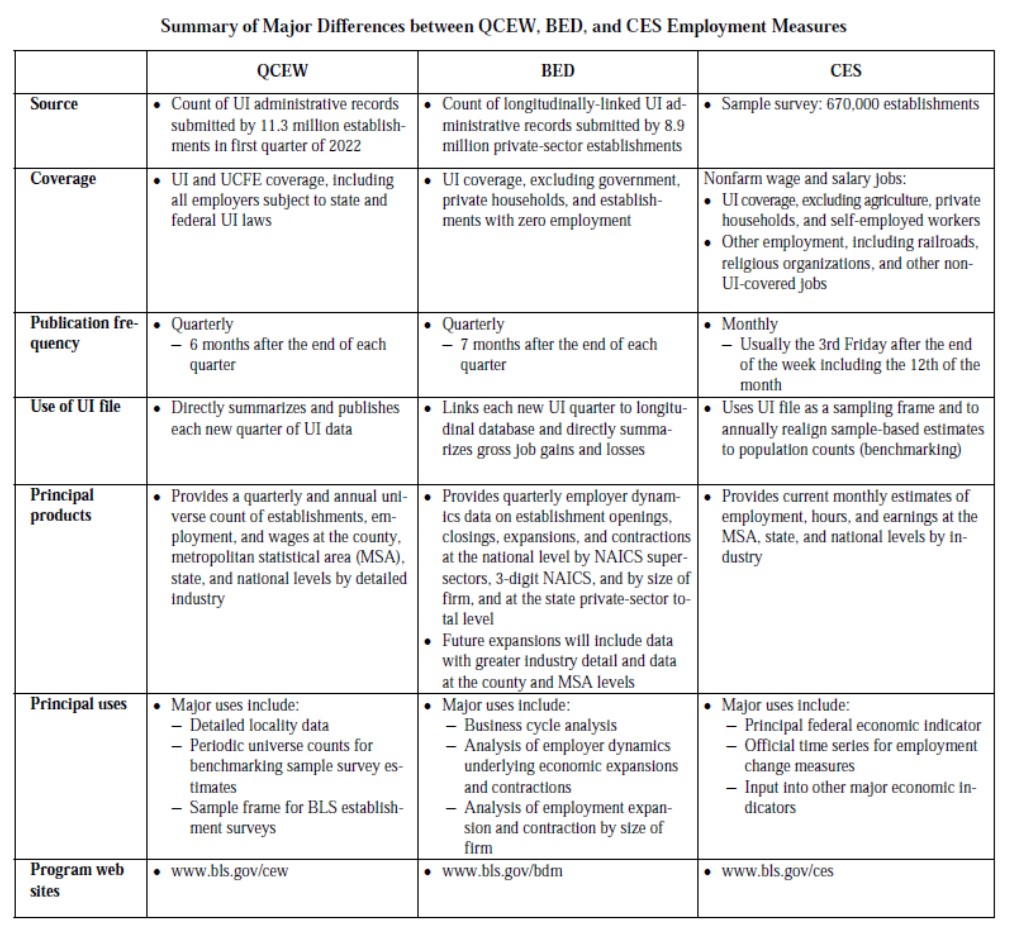
Note the QCEW and BED data share data, but the QCEW covers the universe of covered employees (in 11.3 million establishments, the “C” stands for “census”), BED uses longitudinal data (in 8.9 million establishments), and CES samples 670,000 firms each month.
Source: BLS.
ADP relies upon anonymized and aggregated data for 25 million employees (description here).
The debate is over whether the CES series is overstating employment growth. QCEW private employment, seasonally adjusted using X-13, is flat (albeit falling in June), while Philadelphia Fed’s early benchmark (based on QCEW data) subtracting off reported government employment, and BED indicate a downward movement in Q2. The revamped ADP series rose during Q2, providing another insight into employment trends.
Interestingly, the Philadelphia Fed series resumes its rise in Q3. With both the BLS and ADP series rising in Q3, this suggests continued employment growth.


Does Stevie get everything bloviates wrong? Yea – his really blew it on this labor market issue. But catch this claim when Stevie was pretending he was an expert on military matters:
Steven Kopits
January 26, 2023 at 9:30 am
Land for Russia: $625 billion for title to Crimea. That’s 4x Ukraine’s pre-war GDP. To me, that deal is a no brainer.
Actually is closer to 5x time Ukraine’s GDP but never mind Stevie flunked basic arithmetic. Permanently giving up part of your nation – which may be a area rich in potential oil – for 4 years worth of GDP strikes me as an awful deal. No wonder consultant Steve has no smart clients.
But what is really idiotic is the idea the Putin would be happy with just getting what he already stole by force in 2014. Putin want so restore the dominance of the old Soviet Union.
Look – it is good thing that Biden did not hire this Economic Know Nothing as the Sec. of Labor. It is even better than no one was stupid enough to make this bloviating clown Sec. of State.
First of all, thanks for putting together this graph.
A couple of comments: first of all, I couldn’t help noticing that the trajectory of the QCEW-derived metrics, including that from the Philadelphia Fed, appear pretty close to the trajectory of the Household survey.
https://fred.stlouisfed.org/graph/?g=Zkg2
Second, I’m not surprised in the Q3 rebound preliminarily measured by the Philadelphia Fed. Just as rapidly rising gas prices can do viscous damage, rapidly declining gas prices can do wondrous things.
As I said in my last comment, we’ll have a more complete picture next Friday, whatever it might be. I do think that if the revised CES data remain far apart from that of the QCEW, the BLS really owes it to us to explain why, especially differences in the method of seasonally adjusting.
https://fred.stlouisfed.org/graph/?g=ZksD
January 15, 2020
Real Median Weekly Earnings, * 2020-2022
* All full time wage and salary workers
(Indexed to 2020)
https://fred.stlouisfed.org/graph/?g=ZksN
January 15, 2020
Real Median Weekly Earnings for men and women, * 2020-2022
* Full time wage and salary workers
(Indexed to 2020)
https://fred.stlouisfed.org/graph/?g=Zktb
January 15, 2020
Real Median Weekly Earnings for White, Black and Hispanic, * 2020-2022
* Full time wage and salary workers
(Indexed to 2020)
https://fred.stlouisfed.org/graph/?g=G5Ya
January 4, 2020
Real Average Hourly Earnings of All Private Workers, 2020-2022
(Indexed to 2020)
https://fred.stlouisfed.org/graph/?g=TRE7
January 4, 2018
Real Average Hourly Earnings of All Employees in Manufacturing, 2020-2022
(Indexed to 2020)
https://fred.stlouisfed.org/graph/?g=QhLH
January 4, 2020
Real Average Hourly Earnings of All Employees in Transportation and Warehousing, 2020-2022
(Indexed to 2020)
https://news.cgtn.com/news/2023-01-21/Incomes-of-people-lifted-out-of-poverty-jump-14-3-pct-in-2022-1gM95DhWPp6/index.html
January 21, 2023
Incomes of people lifted out of poverty jump 14.3 pct in 2022
Incomes of people lifted out of poverty grew at a robust rate of 14.3 percent year on year in 2022, data from the National Rural Revitalization Administration showed.
The growth rate was eight percentage points higher than that of per capita disposable income of rural residents, the administration said.
Last year, the per capita net income of those lifted out of poverty reached 14,342 yuan ($2,118.4).
Chinese authorities have been creating more jobs for those lifted out of poverty and developing characteristic industries in rural areas in a bid to boost their incomes.
China will continue to increase job opportunities for people lifted out of poverty with the support of policies to expand effective investment and stimulate domestic demand, Liu Huanxin, head of the administration, said earlier this week.
Measures will be taken to ramp up the development of the rural collective economy, such as making good use of collective land and supporting the growth of rural cooperatives, he added.
[ Lifting people out of poverty is only a beginning. ]
Bloomberg forecasts Nonfarm Payrolls at a change of 185K
Briefing.com forecasts Nonfarm Payrolls at a change of 200K
Briefing.com consensus forecasts Nonfarm Payrolls a change of 190K
My humble efforts show a forecast change of 214K, so most likely high, maybe by a lot.
I always find interesting the forecast range for various forecasts as shown on Econoday’s Economic Calendar.
Econoday’s consensus for Nonfarm employment change is 185K same as Bloomberg, but the consensus range is 150K to 260K. Econoday releases its forecast data on Sundays as linked below.
https://us.econoday.com/byshoweventfull.aspx?fid=559258&cust=us&year=2023&lid=0&prev=/byweek.asp#top
So, the recession seems to be postponed for yet another quarter or so.
Why did the following passage in Blair Fix’s blog immediately call to mind this site?
《Take, for example, the supposed trade-off between growth and inflation. Where does it come from? Not from any empirical evidence. No, it comes from the totem of the Macro, illustrated in Figure 7.》
This is one of the rare things I will take your side on to a degree. They are tethered, but not AS tethered as orthodox macro would have us believe.
But I think Professor Chinn has been flexible or somewhat amenable on this, so your criticism of the blog is unfair.
Off topic, Trouble in Modi Land –
The biggest publically held fim in India faces accounting fraud accusations and short selling:
https://www.washingtonpost.com/business/energy/what-really-worries-indians-about-adanis-empire/2023/01/26/8f1ad00c-9dd3-11ed-93e0-38551e88239c_story.html
India’s largest life insurer aims to buy another $2.5 billion in a Adani new offering, despite the accusation. The insurer is state owned:
https://www.bloomberg.com/news/articles/2023-01-27/india-state-insurer-doubles-down-on-adani-amid-short-seller-row
Don’t have a clue how large the systemic risk is. MSCI has so e questions for Adani:
https://www.financialexpress.com/market/index-provider-msci-seeks-feedback-from-adani-group-over-hindenburg-report/2962672/
Tanks revisited, from the Modern War Institue at West Point –
The essential message is that Ukraine’s proven ability to do a lot with a little vs Russia’s proven inability to do much means an influx of highly capable new tanks can give Ukraine a big advantage, if tanks and training are delivered quickly and support is adequate. Pretty much as we already concluded. This is from MWI’s conclusion:
“When Russia invaded Ukraine last February, it did so with a marked advantage in tanks—both raw numbers and the technological sophistication and capability of the tanks it had available. Since then, Ukraine’s use of its tanks has been vastly superior to that of Russia. While Russia’s stocks of armor have been steadily attrited, Ukraine’s have grown…The war’s course so far provides ample evidence that Ukraine’s disadvantage in numbers and the technological sophistication of its armored platforms can be offset by superior employment.
“If these patterns continue even as Ukraine receives the highly capable Leopard 2 and other tanks, their introduction has the potential to measurably impact the balance on the battlefield. That potential, however, comes with an asterisk. It will only be achieved if they arrive in time to be involved in the anticipated spring offensives and if Ukraine’s supporters provide not just the tanks, but the training to maximize their effectiveness and the logistics and maintenance support needed to keep them in the fight.”
https://mwi.usma.edu/leopards-into-the-fray-how-will-german-tanks-affect-the-battlefield-balance-in-ukraine/
I did read the West Point think tank paper. ukraines are smart as Connecticut Yankees.
they would have all maintenance done by contractors up to the feba?
apparent assumptions on logistic require best case outcome.
complexity of a new security assistance case. what language are the operator or repair manual in? who sends expensive, short stock parts, servicing tools and test gear? shops are in Germany…. repairers need training, tools, books and spec data, takes time.
fuel, fuel haulers, fuel dispensers, magazines full of ammunition.
and the Donbas/dneiper feba is a long haul over distance from sustainment assets.
a 14 tank company is a lot more than the tanks and 56 crew members
ratio of mechanics to crew?
Actor, author and one-time OK athlete has a substack:
https://kareem.substack.com/
I was going through some old stuff on the computer here, weekend reading. This is actually from way back in March, but still felt it was worth sharing:
https://scienceintegritydigest.com/2022/03/23/citation-statistics-and-citation-rings/
As I have stated before this happens more than academics are aware of and I suspect are aware of but not willing to admit.
Not at all surprising. This is the same practice we see from ltr with non-academic writing.
Remember the endless jokes back in the 1970s about “glorious Soviet inventions” – television, washing machine, computer, combine, capuchino machine, aspirin… Backthen, “Glorious Soviet Science!” invented everything. China does that now.
My main point was actually American academia—- but—-I think I stated once before on this blog, a Chinese person (semi well educated) wanted to get into a real verbal sparring match with me that Chinese invented window air conditioning units, (still common when I was there because most urban people have relatively small apartment houses), and I got about two sentences in (about 15 seconds time I guess), knew where it was going and just gave up. I thought “How silly am I going to let these people push me into being?? So walk along the sidewalk with this plebeian and pretend window air-conditioning units are something for western culture to hang their hat on, you know, vs the atomic bomb, Burroughs calculators, IBM mainframes, landing on the Moon??” and then I stopped myself mid-sentence and attempted my best fake recollection facial expression, fixated my eyes sideways towards the left in pretend deep thought and held if for about a three second count and went “Oh yeah, you’re right, I forgot the Chinese did do that!!!” God, if I could give foreigners in China the “how to” on that. Of course most foreigners in China, it only takes you about 3 days to figure out how to play that poker hand, ‘cuz you realize your life will become one single long-running awkward moment if you dare tell them one lepton’s worth of truth about “all the Chinese inventions”.