With the release of the January 2023 Employment Situation release incorporating benchmark revisions we have the following picture of business cycle indicators followed by the NBER Business Cycle Dating Committee, along with IHS Markit/SP Global monthly GDP (released on Wednesday):
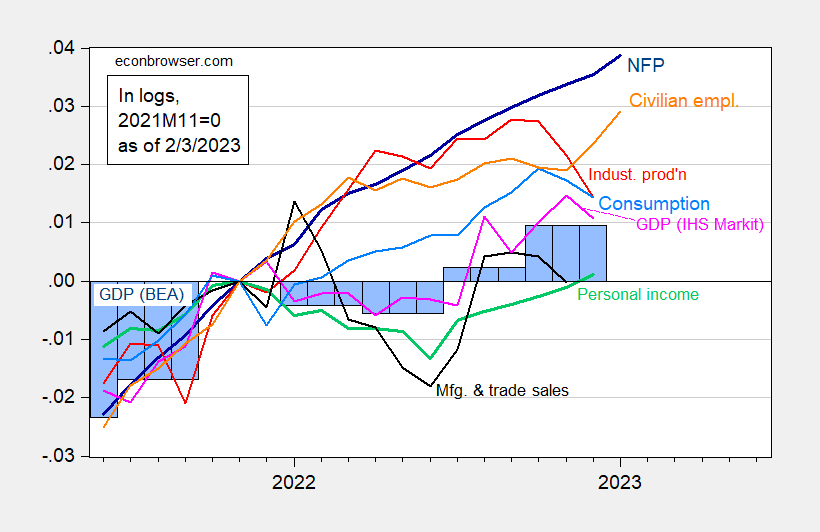
Figure 1: Nonfarm payroll employment, NFP (dark blue), civilian employment (orange), industrial production (red), personal income excluding transfers in Ch.2012$ (green), manufacturing and trade sales in Ch.2012$ (black), consumption in Ch.2012$ (light blue), and monthly GDP in Ch.2012$ (pink), GDP (blue bars), all log normalized to 2021M11=0. Q3 Source: BLS, Federal Reserve, BEA, via FRED, IHS Markit (nee Macroeconomic Advisers) (2/1/2023 release), and author’s calculations.
While one has to be careful (as always, but particularly when new population controls are incorporated) with the household survey employment series (see this post), I think it’s hard to say that the economy has taken a decided downturn in December/January.
“Nonfarm payroll employment, NFP (dark blue), civilian employment (orange)”
Notice how both the payroll survey and the household survey have shown considerable growth with the alleged gap closing. Another long winded rant from Princeton Steve bites the dust.
https://fred.stlouisfed.org/graph/?g=lSy9
January 30, 2018
Manufacturing and Nonfarm Business Productivity, * 1988-2022
* Output per hour of all persons
(Percent change)
https://fred.stlouisfed.org/graph/?g=lSyd
January 30, 2018
Manufacturing and Nonfarm Business Productivity, * 1988-2022
* Output per hour of all persons
(Indexed to 1988)
https://fred.stlouisfed.org/graph/?g=lSwT
January 4, 2018
Manufacturing and Nonfarm Business Productivity, * 2000-2022
* Output per hour of all persons
(Percent change)
https://fred.stlouisfed.org/graph/?g=lSwU
January 4, 2018
Manufacturing and Nonfarm Business Productivity, * 2000-2022
* Output per hour of all persons
(Indexed to 2000)
https://fred.stlouisfed.org/graph/?g=Q9pS
January 4, 2018
Average Hourly Earnings of All Private and Production & Nonsupervisory Workers, * 2017-2023
* Production and nonsupervisory workers accounting for approximately four-fifths of the total employment on private nonfarm payrolls
(Percent change)
https://fred.stlouisfed.org/graph/?g=IBTh
January 4, 2020
Average Hourly Earnings of All Private and Production & Nonsupervisory Workers, * 2020-2023
* Production and nonsupervisory workers accounting for approximately four-fifths of the total employment on private nonfarm payrolls
(Percent change)
https://fred.stlouisfed.org/graph/?g=N741
January 4, 2020
Interest rates on 10-Year Treasury Bond minus 2-Year Treasury Note, 2020-2023
https://fred.stlouisfed.org/graph/?g=zSG6
January 4, 2020
Interest rates on 10-Year Treasury Bond minus 3-Month Treasury Bill, 2020-2023
https://fred.stlouisfed.org/graph/?g=mQUa
January 30, 2018
Labor Share of Nonfarm Business Income and Real After-Tax Corporate Profits, 2000-2022
(Indexed to 2000)
Decline in labor share of income:
89.1 – 100 = – 10.9%
Increase in real profits:
258.7 – 100 = 158.7%
https://fred.stlouisfed.org/graph/?g=PGTe
January 30, 2020
Labor Share of Nonfarm Business Income and Real After-Tax Corporate Profits, 2020-2022
(Indexed to 2020)
Decline in labor share of income:
97.2 – 100 = – 2.8%
Increase in real profits:
113.1 – 100 = 13.1%
Anybody notice what’s happened to the dollar since November?
https://fred.stlouisfed.org/graph/?g=ZB9B
I realize the Fed is irrelevant – it’s embarrassing to have believed otherwise for so long – but I would point out that November is also when the fever of Fed rate-hike expectations broke:
https://www.cmegroup.com/markets/interest-rates/cme-fedwatch-tool.html
Obviously just a coincidence.
Anyhow, since Fed folk are silly enough to believe that the cost of overnight funding matters, the slide in the dollar may be part of the reason Powell made such crazy excuses for continued rate hikes.
In the short run – and everything since Covid first landed has been a collision of short runs – changes in FX rates don’t have much to do with trade volumes. Physical supply has dominated trade. However, a persistent dollar drop should be good for the real trade balance as supply constraints fade into the background.
Again as I have said the Fed is only as relevant as the interest they force banks to pay. Put the Fed rate to 1000bps, I can see the banks grimacing in the short run. 500 points…..eh, not so much. Truman and the New Dealers weren’t stupid. They were not going to let a group of bank heads set consumer finance. That would be instead left to buyers have US currency and debt. The inflation surge last year shook confidence for a while, while the Euro tanked due to Putin’s crap.
Putin frankly is the big loser. He tried to rattle the dollar led global economy but instead we found the North sea can pump out oil faster if the government pays for it, we have loads of natural gas and he has destabilized balto-slavic Russians in the north/northwestern part of the country into crossing through the U.S. southern border further depleting the nation. He, Bibi and Murdoch are in a bind.
So real exchange rates do not matter in your Bot model?
Don’t you love it when a troll writes 1000 basis points? Wow – that’s a BIG number. Oh wait that is only 10%.
Volatility.
I come to bury the FED not to praise the FED.
Gold had fallen into the low $1,600’s in November 2022. Last week it was in the high $1,900’s., $1,878 last night.
The UST 10-year market rate hit 4.30%+/- in November 2022. Last night it was 3.54%.
But this week the BoE and ECB raised short rates 50 bp.
Anyhow. November 2022 saw the fourth consecutive [and likely last that large] 75 bp FF target rate jump. The December 2022 bump was 50 bp and February 2023 was 25 bp. Approximately no one expects the next increase will be over 25 bp.
I take serious exception to your, ‘the FED is irrelevant.’ The FED and its 9,000 economists have been consistently wrong and that causes damage, which is not irrelevant.
So all you care about is gold? Why not invest in the crypto disaster?
Dean Baker has weighed in on the issue of the discrepancy between the Household Report and the Establishment Report:
https://cepr.net/job-growth-is-the-household-or-establishment-survey-right/
First, he notes that excluding the annual population adjustment, the household survey showed only 84,000 jobs added in January.
And that even adding the population increase doesn’t close the gap between the two surveys. [Since last March, the Establishment Survey has shown a 2.4% increase in employment, while the Household Survey still only shows a 1.1% increase].
He also discusses the divergence between payroll tax withholding and the Establishment Survey during the past year.
Finally, he makes an important point about the QCEW:
“The QCEW relies on unemployment insurance filings, which give a virtual census of payroll employment. The establishment survey is benchmarked to QCEW annually, but the benchmark takes place with the January data, using the QCEW data from the first quarter of the prior year. The QCEW data from March 2022 were just included in the establishment survey, increasing employment growth in the year from March 2021 to March 2022 by 568,000.”
In other words, he says the punk QCEW data from Q2 of last year were *not* included in this month’s benchmarking.
In the last couple of months, the payroll survey indicated continued employment growth while the household survey indicated lots more employment growth. Anyone notice? Kevin Drum did:
https://jabberwocking.com/chart-of-the-day-employment-in-the-us/
‘Well, in December the employment level increased by 700,000 jobs and in January it increased by another 900,000 jobs. It’s still well below the headline number, but it sure made up a lot of ground.’
Did Princeton Steve notice? If he did – he is not honest enough to admit it.