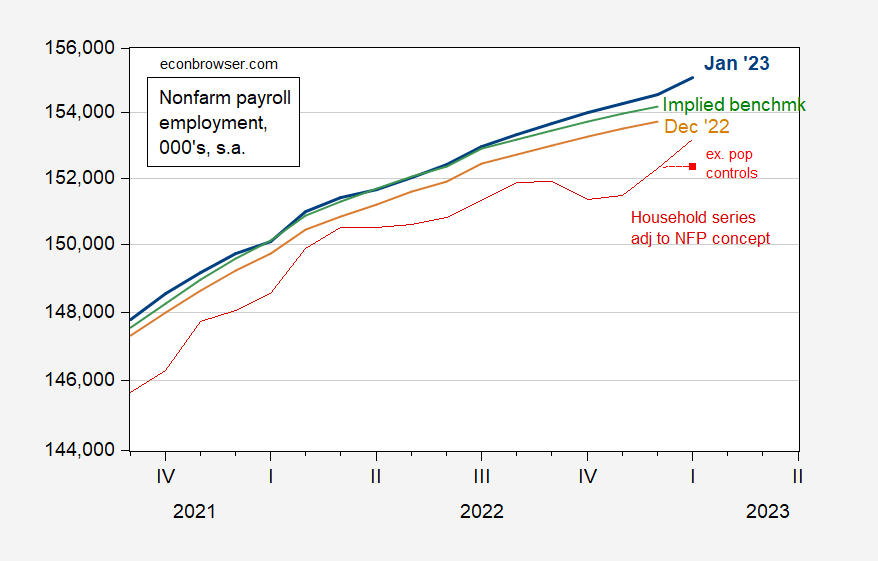
The Employment Situation release for January 2023 incorporated annual benchmark revisions to establishment survey series, and reported population controls for the household survey series. NFP at 517 thousand exceeded the Bloomberg consensus of 115 thousand.
Here’s nonfarm payroll employment according to several measures.
Figure 1: Nonfarm payroll employment from January 2023 incorporating benchmark revision (blue), NFP from December 2022 (tan), and author’s calculation of implied benchmark revision using preliminary benchmark for March 2022 (green), and household survey series on civilian employment adjusted to NFP concept as reported (red), and for January 2023, adjusted household series removing effect of revised population controls (light red square). Adjustment to remove revised population controls assumes overall civilian employment increases 1.24% for each 1% change in adjusted employment, ratio 2019M09-2022M12. Source: BLS (January 2023, December 2022 releases), author’s calculations, BLS.
The civilian employment series incorporates the effects of new Census population controls. I try to remove the impact of new population controls by accounting for the ex-pop control change in total civilian employment, which is 84 thousands (versus 894 thousand officially reported). Over the 2021M09-22M12 period, each 1.24% change in civilian employment is associated with a 1% change in civilian employment adjusted to NFP concept. Applying this ratio, civilian employment adjusted to NFP concept barely budged. (In this case, it pays to read the footnotes!). As I have mentioned before, it’s dangerous to apply to much weight to the household survey series versus the establishment, because of the high variability of those series (and it’s particularly dangerous to look at growth rates that span the incorporation of new population controls).
Noteworthy is that the NFP increase is in growth (denoted by increase in slope in log scale) and level of employment, both with respect to December official series, and the series incorporating the preliminary benchmark for March 2022 (calculation I made described here). I think the bulk of the increase in level from 2022M03 onward is updating in seasonal factors. Both of these are suggestive of a still tight labor market, as discussed in the earlier post by Paweł Skrzypczyński.
The fact that the level of measured employmet is attributable to seasonal factors leads to questions of whether the apparent strength is due to seasonality issues. In order to partly address this, I plot 12 month log changes in several employment series.
Figure 2: Year-on-year growth rate in nonfarm payroll employment incorporating benchmark revision, seasonally adjusted (blue), not seasonally adjusted (sky blue), from Quarterly Census of Employment and Wages covered employment, not seasonally adjusted (pink), and household survey series on civilian employment adjusted to NFP concept as reported (red), and for January 2023, adjusted household series removing effect of revised population controls (light red square). Growth rates calculated using log differences. Adjustment to remove revised population controls assumes overall civilian employment increases 1.24% for each 1% change in adjusted employment, ratio 2019M09-2022M12. Source: BLS (January 2023 release), BLS QCEW, author’s calculations, BLS.
It’s not obvious to me seasonal adjustment issues are a big issue, since the 12 month (log) changes for seasonally adjusted and not seasonally adjusted match up for January. The higher variability in the household series is obvious from the bigger swings; this puts into context the flat move in the level. Finally, QCEW covered employment fell in Q2 (latest available data). However, these data will be revised.
The report highlights the limitations of using the ADP series for tracking what happens to BLS series on private NFP (443 thousand vs. consensus 190 thousand).
Figure 1: Month-on-month growth rate in BLS private nonfarm payroll employment (blue), and ADP private nonfarm payroll employment (chartreuse), both calculated as log first differences. Source: BLS and ADP via FRED, and author’s calculations.


ADP has claimed in the past that mismatches between ADP and BLS private net hiring figures in the initial release are predictive of BLS revisions in subsequent releases. ADP’s methods change over time, so that claim may no longer apply.
I’m reading Brad DeLong’s Slouching Towards Utopia: An Economic History of the Twentieth Century, and thinking about my personal career – I was let go in the “Great Leveling of Middle Managers” 2008 GOP Recession and just within the past year – now making in wages what I did ten years ago. To me, every time the Republicans get in charge – they cause a recession via tax cuts for the wealthy, blowing up govt oversight, providing easy money for speculative bubbles to goose the stock market (remember Powell lowered rates when he saw Trump tax cuts were doing nothing for economy) – while the Dems come in and fix things with responsible governance while the Repubs yell “Austerity!” the whole time. When does the general media narrative change to the Dems are good for the economy and you can not trust Repubs with money or governance. Thanks Menzie!
I’ll admit I didn’t read DeLong’s book cover to cover. And I won’t say that it doesn’t even have a very few good excerpts. But it struck me as a book obsessed with convincing the reader of Delong’s supposed knowledge of history by continual and never-ending name-dropping. Name-dropping is fine. But name-dropping in obsessive amounts presents very little in the way of wisdom or learning. It’s like trying to impress girls at a party and going “Shakespeare…… Bernard Shaw….Caesar……. Napoleon…….. Neil Simon…… Truman……. Warhol…. I mean, am I right or am I right??” Yeah, uhm, great. Who else is in your pocket-sized Who’s Who?? Please, tell us more.