I am fascinated by maps, including maps of the United States which display the geographic variation of institutional features. But qualitative features, such as institutions or laws, cannot be directly subjected quantitative analysis. Fortunately, as I’ve been discussing in my intro econometrics class, one can convert qualitative data into quantitative data by use of dummy variables, i.e., variables that take on a value of 1 or 0 (one could have ordinal values as well, but I’ll skip that aspect today).
These four maps depict qualitative data applying to the 50 states plus the District of Columbia, to yield 51 observations. Blue means presence of the relevant institutional feature, gray means absence. I’ll consider four such features, call them Z1, Z2, Z3, and Z4.

Figure 1: United States, variable Z1=1 denoted by blue, variable Z1=0 by gray.

Figure 2: United States, variable Z2=1 denoted by blue, variable Z2=0 by gray.

Figure 3: United States, variable Z3=1 denoted by blue, variable Z3=0 by gray.
Figure 4: United States, variable Z4=1 denoted by blue, variable Z4=0 by gray.
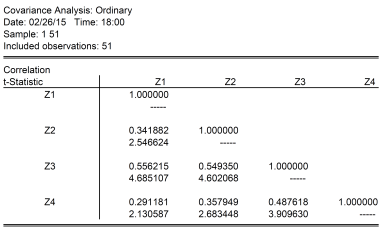
Notice the interesting pattern. I convert the categorical data in these four maps into quantitative data using dummy variables, Z1 through Z4. Here are the correlation coefficients for the four variables, along with associated t-stats for the null hypothesis the correlation coefficient is zero.

Results reflect coding error fixed 2/25 5:20PM Pacific
Notice the correlation between Z2 and Z3 are highest, at 0.61 is 0.55. The t-statistic for the null of zero correlation coefficient is soundly rejected at any conventional significance level. This confirms the impression gained by a visual inspection of maps 2 and 3; however, now we have a quantitative measure. (Note that the interpretation of a Pearson correlation coefficient when applied to binary variables is as a phi coefficient, also referred to as the “mean square contingency coefficient”.)
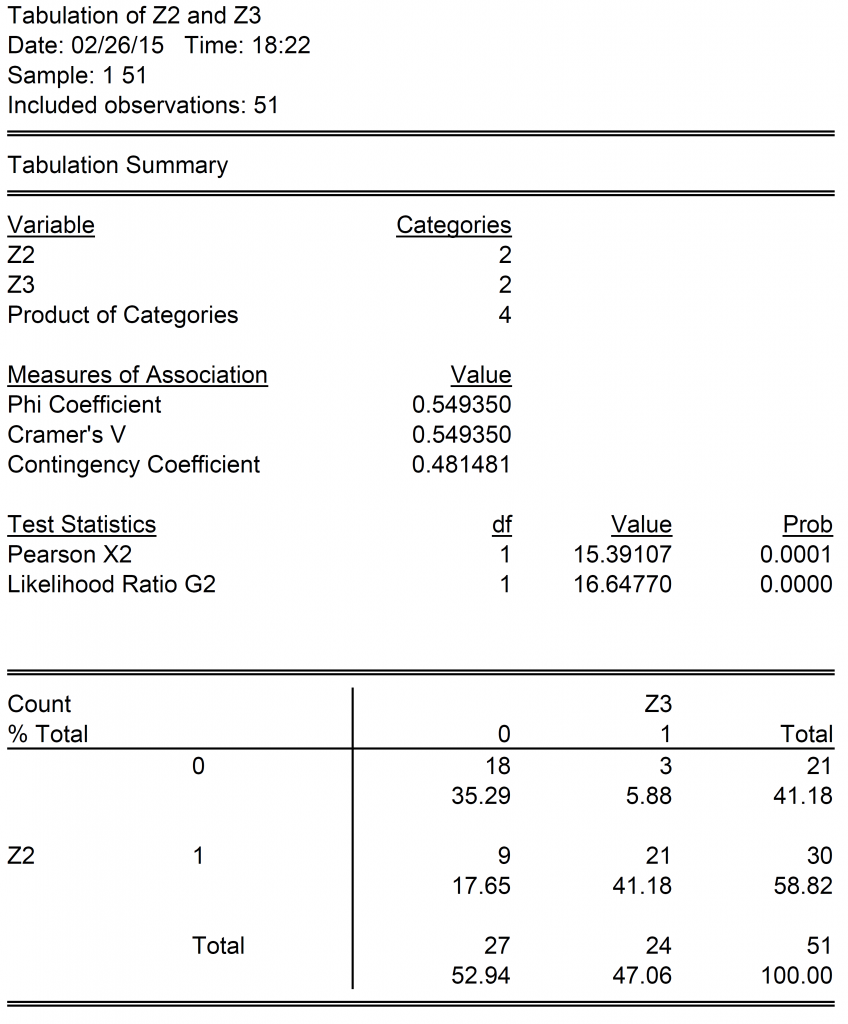
One can examine how the states align along each dimension by looking at a contingency table for Z2 and Z3 (notice the “phi coefficient” is the same as the correlation coefficient).

Results reflect coding error fixed 2/25 5:20PM Pacific
Eighteen states (35.3% of sample) fail to exhibit both of the characteristic in Z2 and Z3, while 23 21 states (45.1% 41.2% of sample) exhibit both of the characteristic in Z2 and Z3. A total 10 12 states fall “off-diagonal”, with states exhibiting one, and not the other. That is, the correlation is not perfect.
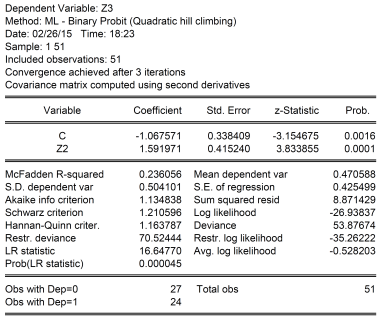
One could estimate a linear regression between Z3 and Z2; this is called a linear probability model. Doing so would yield a slope coefficient of 0.62 0.56, adjusted R-squared of 0.36 0.29. This means a one unit increase in Z2 would increase the probability of Z3=1 from 0 to 0.62 0.56. A linear probability model is problematic to the extent that it does not restrict probabilities to lie between 0 and 1. A probit model, which allows for a nonlinear relationship between Z3 and Z2 (and is based on the cumulative normal distribution) yields the following results:

Results reflect coding error fixed 2/25 5:20PM Pacific
The slope cannot be directly interpreted; one can find the implied probability using the cumulative normal distribution. When Z2 takes on a value of 0, then the probability of Z3=1 is 14.3%. When Z2 takes on a value of 1, then the probability is 76.7% 70.3%.
Of course, even when one runs a regression, one can’t necessarily say one has identified a causal relationship, regardless of whether the coefficient is statistically significant or not. But certainly, knowing Z2 improves ones guesses of what Z3 will be. In fact, the above probit regression correctly predicts over 68.3% 66.7% of the cases where Z3 takes on values of 0, and 88.5% 87.5% of the cases where Z3 takes on values of 1 (assuming a cutoff value of 0.5, that is when the probability Z3=1 exceeds 0.5, predict Z3=1).
To highlight the non-causality interpretation, let’s consider what Z2 and Z3 are. Z3 takes on values of 1 if “right-to-work” laws are in effect, according to the National Right to Work Legal Defense Foundation, Inc.. Z2 takes on a value of 1 if anti-miscegenation laws were in effect in 1947. [1] A causal interpretation would be “having anti-miscegenation laws in 1947 cause one to have right-to-work laws in 2014”; this is clearly implausible. Reverse causality seems also implausible – that is it doesn’t seem likely that “having right-to-work laws in 2014 caused a state to have anti-miscegenation laws in 1947.” It is possible that adding in additional covariates would make the correlation disappear; but if it didn’t, a plausible interpretation is that there is a third, omitted, variable that caused certain states to have anti-miscegenation laws on the books in 1947, and caused certain states to have right-to-work laws in place in 2014.
By the way, the other variables are as follows: Z1 is a dummy variable that takes a value of 1 if restrictions on abortion at 20 weeks are in effect. [2] (some states have restrictions at 24 weeks, some third trimester, yet others at viability; and some had no restrictions.) I wanted to obtain a more general measure of restrictiveness on reproductive rights, but that would have entailed a lot more data collection, so I settled for this dummy variable. Finally, Z4 takes on a value of 1 if the state has implemented “stand-your-ground” laws. [3] Inclusion of these additional variables does not eliminate the statistically significant correlation found in the probit regression equation.
So…correlation is not causation! to quote Edward Tufte, “Correlation is not causation but it sure is a hint.”

If only Wisconsin became a right to work state, all the right to work states would be connected!
Steven Kopits: Visual inspection of Map 3 fails to confirm your assertion. Minnesota and/or Iowa would also need to implement, on top of Wisconsin. Adding just Wisconsin would yield a contiguous group of WI, MI, IN, still separated from the other right to work states.
Well then, let’s add Indiana!
Why not make right-to-work a federal law. Who having a right mind could be against a person’s right to work?
Steven Kopits: I think you are reading too fast. Indiana is already a right to work state.
You know, this is shaping up to be an interesting presidential election.
I think the apparent corruption at the family foundation and newly released Benghazi emails, as well as a lack of enthusiasm by the Democratic Party, are going to sink Hillary’s primary. One can’t but think Elizabeth Warren will be the candidate on the left.
On the other hand, Jeb Bush inspires similarly little enthusiasm on the right. Scott Walker, thanks to the protesters in Wisconsin, is really appearing to light up the political right.
Warren vs Walker. My goodness. What kind of election would that be? A wacko lefty versus a college drop-out. Almost makes me want to draft Rahm Emanuel. He’s a bastard, but actually an intelligent bastard. (Actually, Andrew Cuomo, Perry’s son, is my guy, I think.)
Ten states have no restrictions on abortions. Most are at 20 weeks or viability, the latter generally defined as 24 weeks, which is considered the lower limit of survival for a premature baby.
Those states which allow the termination of infants which could have otherwise survived (some people call this infanticide) include:
Alaska, Colorado, DC, New Hampshire, New Jersey, New Mexico, Oregon, Vermont, and West Virginia. Not immediately clear what the common denominator is.
steven, it would be interesting to see the abortion data compared to the death penalty-and is there any correlation?
By the way, Menzie, some big GDP numbers coming out. India at 7.5%. Didn’t I predict something like that?
Also, some big oil demand numbers coming out, too.
A good number of shale players look like they can operate pretty well at $75 WTI, call it $80 Brent. That price is only moderately constraining on the global economy and would imply US production growth in the 1.0-1.2 mbpd range, making the US a net oil exporter by 2020 if the industry remains on trend.
If that happens, look out, the US will be king of the hill again, something like we saw in the early 1970s. Both the oil producing and consuming sectors will be doing well.
BTW, still worth looking at labor supply. Scott Sumner may have a point: not all the people who have left the labor market might return, and if that’s the case, labor will be the binding constraint on the economy. (And we know what happened to oil prices when oil was the binding constraint…)
Steven,
It may be instructive for Jeffrey Brown to comment on the supply & demand of petroleum based upon your comments.
Ricardo: “Why not make right-to-work a federal law. Who having a right mind could be against a person’s right to work?”
It is amusing to hear a conservative talk about the “right to work” when all of the labor laws are about the right of employers to terminate any worker at will. The intent is to eliminate any worker rights at all.
It’s also amusing to hear “right to work” posed as a libertarian policy when right to work laws explicitly insert the government in forbidding a contractual relationship between unions and companies. Companies have always been able to enter contracts with workers. What “right to work” laws do is forbid certain types of contracts. Conservatives claim to oppose government interference in contracts yet that is exactly what these laws do. There is no consistency in the conservative position except that they consistently favor government interference on the side of corporations.
Joseph wrote:
…the “right to work” when all of the labor laws are about the right of employers to terminate any worker at will.
First, name one law that grants the right of employers to terminate any worker at will.
Second, name one union contract that guarantees a person the right to work at any job and the right to work for any pay rate.
Third, please reread my second sentence.
From the Nevada Department of Business and Industry, Office of the Labor Commissioner:
Can my employer fire me without a reason?
Yes. Nevada is an “employment-at-will” state, meaning that an employer may terminate the relationship at any time and without any reason. The employer cannot discriminate based on sex, race, color, national origin, age, religion or disability. For information on discrimination claims, please contact the Nevada Equal Rights Commission.
http://www.laborcommissioner.com/faq.html
“So…correlation is not causation!”
I had some trouble with this expression as to whether it is logically true.
rewriting the statement to:
If correlation then not causation.
-to be true that would would mean-
If not(not causation) then not correlation (Modus Tollens)
-assuming that ‘not(not causation)’ is the same as ‘causation’ that means-
if causation then not correlation.
Which makes no sense as a true statement.
A similar statement to the original quote can be achieved by the use of the following statement:
If causation then correlation
-when true it would mean-
If not correlation then not causation (again Modus Tollens) (which makes sense as a true statement)
-but I remind all it not true that-
if correlation then causation. (the similar statement)
My guess is the original discrepancy is due to the reversal of independent and dependent variables. Or perhaps just poor wording which might be change to correlation is not sufficient for causation.
Ed
Oh and by the way, Steven, per the link provided by Menzie, Iowa is already a right to work state.
Ed, “correlation is not causation” means correlation does not equal causation.
Peak,
No it does not.
Ed
Ed Hanson: Just for you, I have edited. I hope you like it. It actually summarizes my views even better.
Menzie As a pedagogical matter, I think trying to extend this particular example of the states to a probit example might be confusing to your students because it doesn’t make clear that in a probit model it is the dependent variable that is binary. Here’s how I would modify the example if I wanted to extend it to a probit (or logit) model. First note that Z1, Z2, Z3 and Z4 are all outcomes, which put them on the left side of the equation; i.e., they are dependent variables. Then note that this would actually be a case of a multiple probit model. Then offer up some potential explanatory variable such as percent of voters who are registered Republicans, average education level, percent of population who regularly attend church, etc. The key thing is that the explanatory variables should be quantitative and non-binary. Yes, you can have a binary dummy variable as an explanatory variable, but for a good probit or mprobit model you’d rather have non-binary quantitative variables as explanatory variables. In this case I’m not sure that Z1, Z2, Z3 and Z4 would be ideal examples of an mprobit model because normally each of the dependent variables is regarded as a mutually exclusive outcome. I guess my point is that while your example works for the correlation matrix you showed, I don’t think I’d want to try and present it as an example of a probit model.
2slugbaits: Good point. The first example they will get is one with a continuous independent variable (as well a binary). After that, they get this.
false matrix with CA / CO as right to work states
x/y z1 z2 z3 z4 rbs z14
z1 1.000 0.342 0.514 0.291 0.139 0.683
z2 0.342 1.000 0.614 0.358 -0.108 0.778
z3 0.514 0.614 1.000 0.416 -0.010 0.850
z4 0.291 0.358 0.416 1.000 0.074 0.697
rbs 0.139 -0.108 -0.010 0.074 1.000 0.025
z14 0.683 0.778 0.850 0.697 0.025 1.000
Trying to replicate your analysis as a first step, before developing some ideas of my own
1. Excluding Guam from the list of 51, I count only 24 z3 “right to work state” instead of your 26
http://www.nrtw.org/rtws.htm
Falsely adding California and Colorado to the “right to work” states would replicate your counts and correlation coefficients
2. I did that work in order to check against the Red- blue state (“rbs”) coefficient, which turned out, to some of my surprise, a pretty weak predictor
x/y z1 z2 z3 z4 rbs z14
z1 1.000 0.342 0.556 0.291 0.139 0.695
z2 0.342 1.000 0.549 0.358 -0.108 0.752
z3 0.556 0.549 1.000 0.488 0.033 0.860
z4 0.291 0.358 0.488 1.000 0.074 0.719
rbs 0.139 -0.108 0.033 0.074 1.000 0.040
z14 0.695 0.752 0.860 0.719 0.040 1.000
3. z14 represents the sum of variables z1 to z4
The very high correlations of all singles seem to represent all of them to be a kind of expression of some general property with some historical noise and particularities on it. E.g. please take a look at the “green states” ring around the core confederates in the miscegenation wiki page
genauer: Thanks, you are right. I mistakenly MO and WV as right-to-work. I have now posted the corrected results.
maybe better to read this way
x/y___z1___z2___z3___z4___rbs___z14
z1___1.000___0.342___0.556___0.291___0.139___0.695
z2___0.342___1.000___0.549___0.358___-0.108___0.752
z3___0.556___0.549___1.000___0.488___0.033___0.860
z4___0.291___0.358___0.488___1.000___0.074___0.719
rbs___0.139___-0.108___0.033___0.074___1.000___0.040
z14___0.695___0.752___0.860___0.719___0.040___1.000
Ricardo: “First, name one law that grants the right of employers to terminate any worker at will.”
Surely you are joking. You really don’t know anything about running a business at all, do you.
Every state in the U.S. except Montana has adopted labor laws that protect employers, allowing them to fire any employee at will for any reason except for certain discrimination classes. That means they can fire you at any moment simply because they don’t like you or your politics or your sexual orientation. No just cause is required. Unless an employee has a written contract saying otherwise, from a union for example, the default common law is that all employees are “at-will” and can be dismissed instantly at the discretion of the employer.